
Articles
- Page Path
- HOME > Korean J Community Nutr > Volume 21(6); 2016 > Article
-
Research Article
- Comparison of Diet Quality and Diversity according to Obesity Type among 19-64 year old Korean Adults
-
Hyae Min Gu, So Yeon Ryu
 , Jong Park, Mi Ah Han, Yeong Eun Son
 -
Korean Journal of Community Nutrition 2016;21(6):545-557.
DOI: https://doi.org/10.5720/kjcn.2016.21.6.545
Published online: December 31, 2016
1Department of Health Science, Graduate School of Chosun University, Gwangju, Korea.
2Department of Preventive Medicine, College of Medicine, Chosun University, Gwangju, Korea.
- Corresponding author: So-Yeon Ryu. Department of Preventive Medicine, College of Medicine, Chosun University, 309 Pilmundae-ro, Dong-gu, Gwangju 61452, Korea. Tel: (062) 230-6483, Fax: (062) 225-8293, canrsy@chosun.ac.kr
• Received: October 13, 2016 • Revised: December 9, 2016 • Accepted: December 22, 2016
Copyright © 2016 The Korean Society of Community Nutrition
This is an Open-Access article distributed under the terms of the Creative Commons Attribution Non-Commercial License (http://creativecommons.org/licenses/by-nc/3.0/) which permits unrestricted non-commercial use, distribution, and reproduction in any medium, provided the original work is properly cited.
- 1,849 Views
- 1 Download
- 2 Crossref
Abstract
-
Objectives
- This study was performed to compare the diet quality and diversity according to types of obesity categorized by body mass index and waist circumference among Korean adults aged 19-64 years.
-
Methods
- This study used the data of the 5th Korea National Health and Nutrition Examination Survey (KNHANES-V) and included 11,081 study participants. Type of obesity was categorized into 4 groups (Type 1: BMI obesity + abdominal obesity; Type 2: BMI obesity only; Type 3: abdominal obesity only; Type 4: Normal). To compare the diet quality and diversity according to obesity type, ANCOVA (Analysis of covariance) was used with stratification of age groups (19-44 years, 45-64 years).
-
Results
- With regard to comparative analysis of diet quality, there were significant differences between diet qualities in energy, protein, thiamin, riboflavin, niacin, phosphorous and iron and type of obesity in the 19-44 age group, while there were significant differences between diet qualities on protein, vitamin C, phosphorous and type of obesity in the 45-64 age group. There was no significant difference between diet diversity score and type of obesity in Korean adults.
-
Conclusions
- This study showed that in Korean adults, diet qualities of some nutrients were different among obesity types, while diet diversity was not. These observations should be considered in an effort to improve intake of over-and deficient nutrients and in further studies to evaluate the effects of nutrient quality on obesity.
- 1. Ministry of Health and Welfare & Korea Centers for Disease Control and Prevention. Korea Health Statistics 2012: Korea National Health and Nutrition Examination Survey (KNHANES V-3) [Internet]. 2013; cited 2016 Jan 13]. Available from: https://knhanes.cdc.go.kr/knhanes/index.do.
- 2. Ko JH, Kim KJ. Comparison of body composition according to the obesity types based upon percent body fat, BMI and waist circumference in women. J Growth Dev 2007; 15(1): 1-7.
- 3. Zhu S, Wang Z, Heshka S, Heo MS, Faith M, Heymsfield S. Waist circumference and obesity-associated risk factors among whites in the third National Health and Nutrition Examination Survey: Clinical action thresholds. Am J Clin Nutr 2002; 76(4): 743-749.ArticlePubMed
- 4. Ardern C, Katzmarzyk P, Janssen I, Ross R. Discrimination of health risk by combined body mass index and waist circumference. Obes Res 2003; 11(1): 135-141.ArticlePubMed
- 5. Lee YE, Park JE, Hwang JY, Kim WY. Comparison of health risks according to the obesity types based upon BMI and waist circumference in Korean adults: The 1998-2005 Korean National Health and Nutrition Examination Surveys. Korean J Nutr 2009; 42(7): 631-638.Article
- 6. Bae YJ. Evaluation of nutrient and food intake status, and dietary quality in Korean female adults according to obesity: Based on 2007-2009 Korean National Health and Nutrition Examination Survey. J Nutr Health 2012; 45(2): 140-149.Article
- 7. Kim MH, Lee JC, Bae YJ. The evaluation study on eating behavior and dietary quality of elderly people residing in Samcheok according to age group. Korean J Community Nutr 2009; 14(5): 495-508.
- 8. Arroyo Izaga M, Rocandio PA, Ansotegui AL, Pascual AE, Salces BI, Rebato OE. Diet quality, overweight and obesity in university students. Nutr Hosp 2005; 21(6): 673-679.
- 9. Wolongevicz DM, Zhu L, Pencina MJ, Kimokoti RW, Newby PK, D'Agostino RB, et al. Diet quality and obesity in women: the Framingham Nutrition Studies. Br J Nutr 2010; 103(8): 1223-1229.ArticlePubMed
- 10. Jennings A, Welch A, van Sluijs EM, Griffine SJ, Cassidy A. Diet quality is independently associated with weight status in children aged 9-10 years. J Nutr 2011; 141(3): 453-459.ArticlePubMed
- 11. Kim MS, Kweon DC, Bae YJ. Evaluation of nutrient and food intake status, and dietary quality according to abdominal obesity based on waist circumference in Korean adults: Based on 2010-2012 Korean National Health and Nutrition Examination Survey. J Nutr Health 2014; 47(6): 403-415.Article
- 12. Jayawardena R, Byrne NM, Soares MJ, Katulanda P, Yadav B, Hills AP. High dietary diversity is associated with obesity in Sri Lankan adults: an evaluation of three dietary scores. BMC public Health 2013; 13(1): 314.ArticlePubMedPMCPDF
- 13. World Health Organization. The Asia-pacific perspective: redefining obesity and its treatment [Internet]. 2000; cited 2016 Jan 13]. Available from: http://www.wpro.who.int/nutrition/documents/Redefining_obesity/en/.
- 14. Lee S, Park HS, Kim SM, Kwon HS, Kim DY, Kim DJ, et al. Cut-off points of waist circumference for defining abdominal obesity in the Korean population. Korean J Obes 2006; 15(1): 1-9.
- 15. Bergier J, Kapka-Skrzypczak L, Bilinski p, Paprzycki P, Wojtyla A. Physical activity of polish adolescents and young adults according to IPAQ: a population based study. Ann Agric Environ Med 2012; 19(1): 109-115.PubMed
- 16. Choi HM, Kim JH, Lee JH, Kim CI, Song KH, Jang KJ, et al. 21st Century nutrition. 4th ed. Paju: Kyomunsa; 2011. p. 5.
- 17. Hansen RG. An index of food quality. Nutr Rev 1973; 31(1): 1-7.ArticlePubMed
- 18. Oh SY. Analysis of methods on dietary quality assessment. Korean J Community Nutr 2000; 5(2S): 362-367.
- 19. Bae YJ. Evaluation of nutrient intake and anthropometric parameters related to obesity in Korean female adolescents according to dietary diversity score: from the Korean National Health and Nutrition Examination Surveys, 2007-2009. Korean J Community Nutr 2012; 17(4): 419-428.Article
- 20. Um JS, Park MY, Chung YJ. Composition of food groups appropriate for evaluation of diet quality of Korean adolescents based on Kant's minimum amount. Korean J Nutr 2006; 39(6): 560-571.
- 21. Kant AK, Block G, Schatzkin A, Ziegler RG, Nestle M. Dietary diversity in the US population, NHANES II, 1976-1980. J Am Diet Assoc 1991; 91(12): 1526-1531.ArticlePubMed
- 22. Korean Nutrition Society. Dietary Reference Intakes for Koreans 2010. 1st ed. 2010.
- 23. Park S, Park MS, Ko JA. The association between carbohydrate intake and waist circumference. Korean J Obes 2008; 17(4): 175-181.
- 24. Lee TY, Yoo HJ, Joo NS. Daily calcium intake and obesity in middle-aged Koreans. Korean J Obes 2009; 18(2): 59-64.
- 25. Lee JY, Chang HS, Seo KH, Lee BS, Nam BS. Diet therapy. Seoul: Shinkwang Publishing Co.; 2007. p. 231.
- 26. Chang HS. A study on weight control behaviour, eating habits and health-related life habits according to obesity degree by body fat percentage among middle-aged women in Gunsan city. Korean J Community Nutr 2010; 15(2): 227-239.
- 27. Bae YJ. Evaluation of nutrient and food intake status, and dietary quality in Korean female adults according to obesity: Based on 2007-2009 Korean National Health and Nutrition Examination Survey. Korean J Nutr 2012; 45(2): 140-149.Article
- 28. Kim SH, Kim JY, Ryu KA, Sohn CM. Evaluation of the dietary diversity and nutrient intakes in obese adults. Korean J Community Nutr 2007; 12(5): 583-591.
- 29. Rosell M, Johansson G, Berglund L, Vessby B, de Faire U, Hellenius ML. Associations between the intake of dairy fat and calcium and abdominal obesity. Int J Obes Relat Metab Disord 2004; 28(11): 1427-1434.ArticlePubMedPDF
- 30. Marques-Vidal P, Goncalves A, Dias CM. Milk intake is inversely related to obesity in men and in young women: data from the Portuguese Health Interview Survey 1998-1999. Int J Obes (Lond) 2006; 30(1): 88-93.ArticlePubMedPDF
- 31. Lee CJ, Joung HJ. Milk intake is associated with metabolic syndrome: Using data from the Korea National Health and Nutrition Examination Survey 2007-2010. Korean J Community Nutr 2012; 17(6): 795-804.Article
REFERENCES
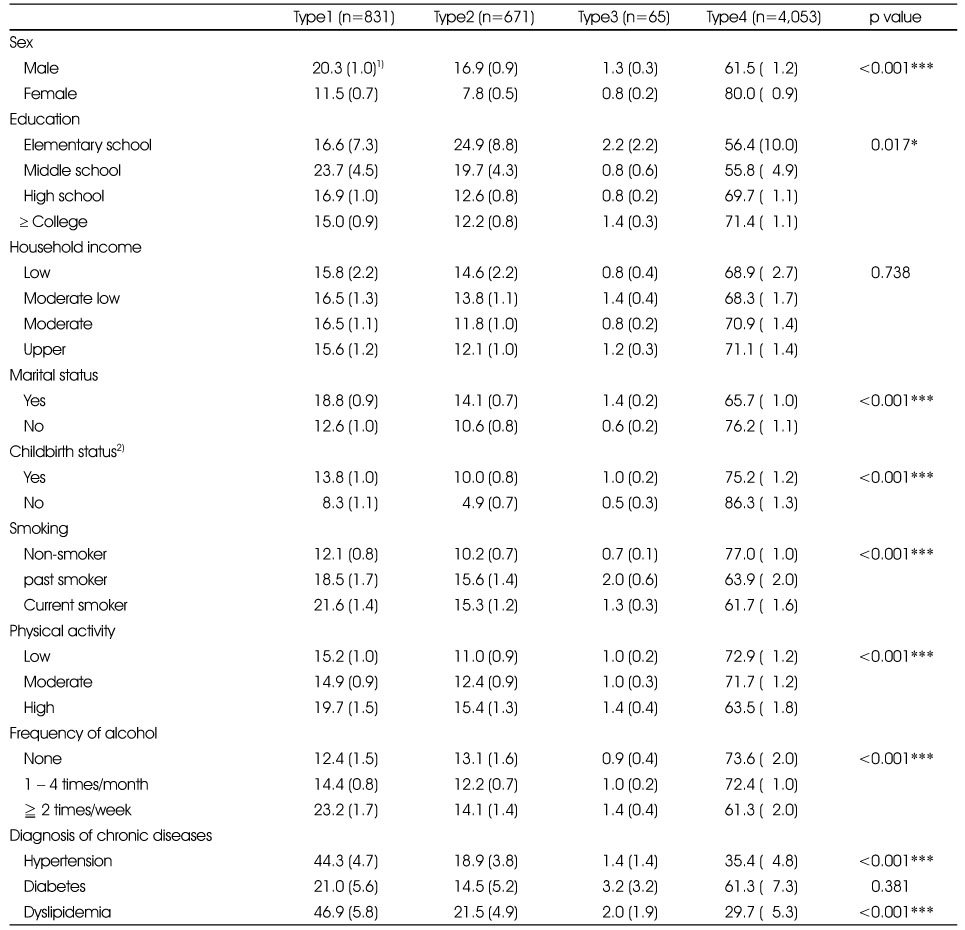
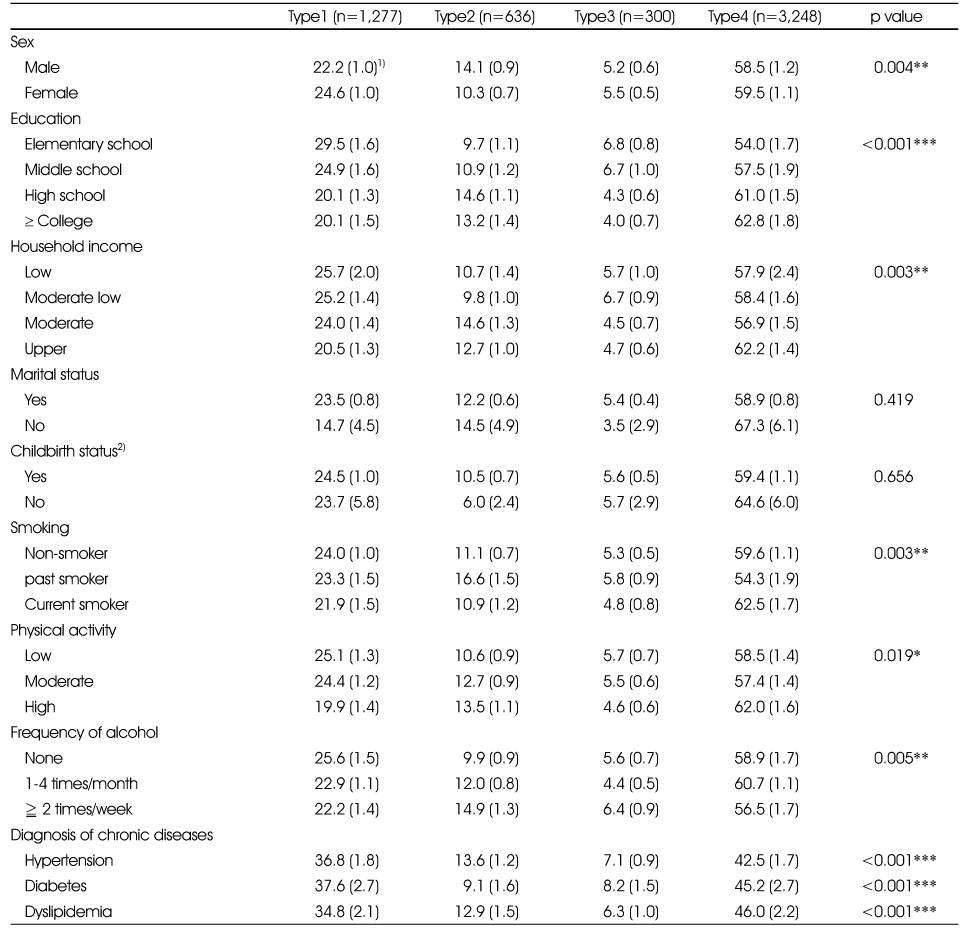
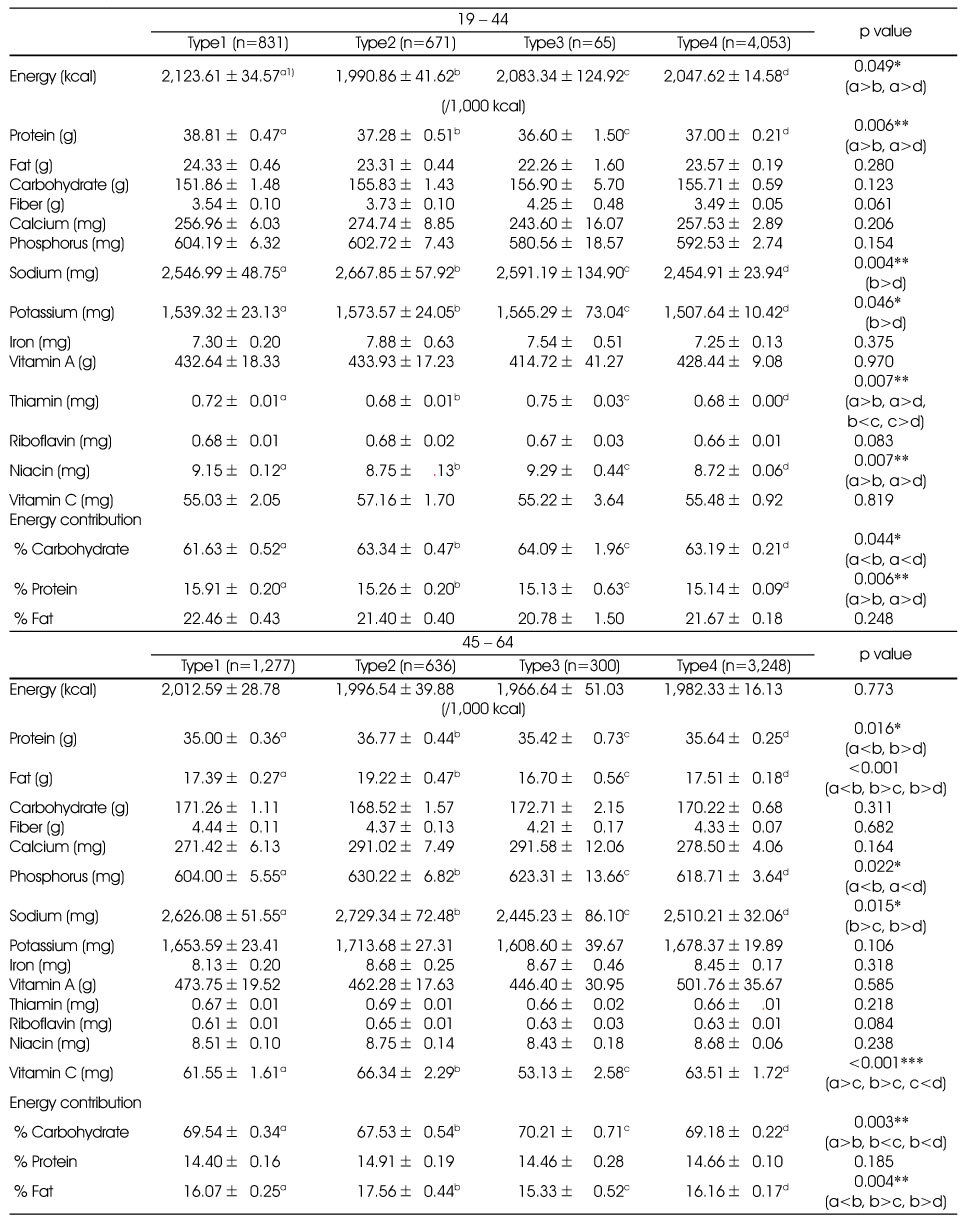
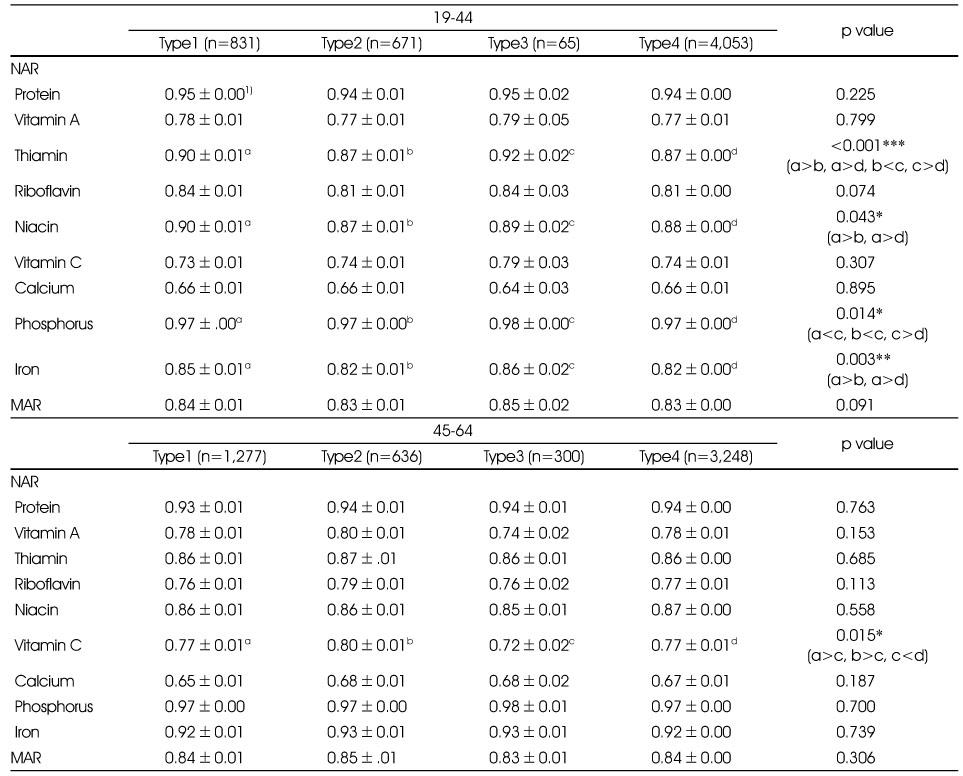
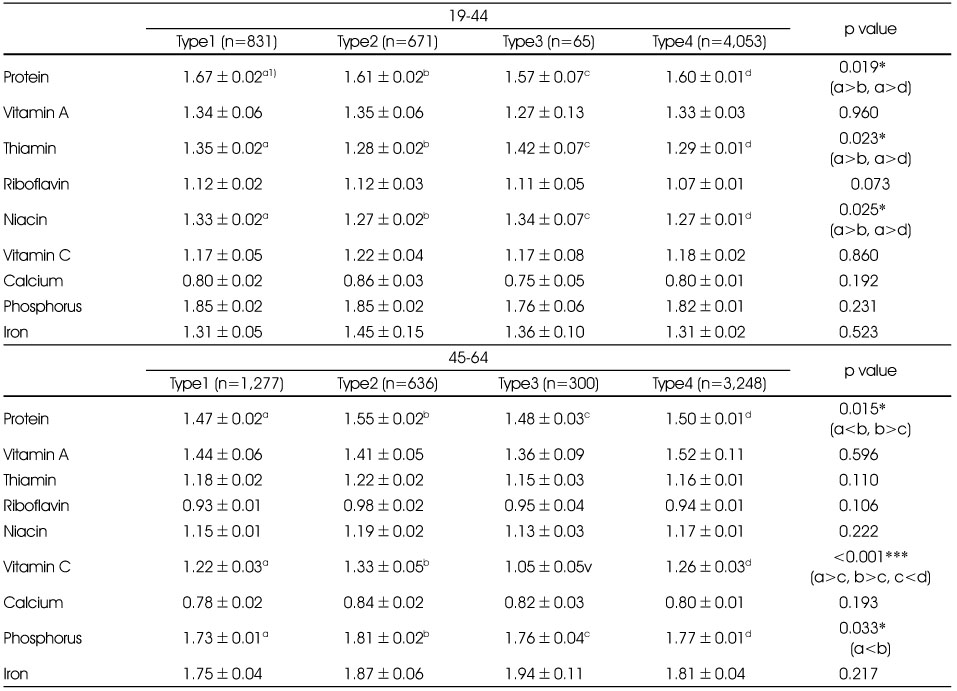
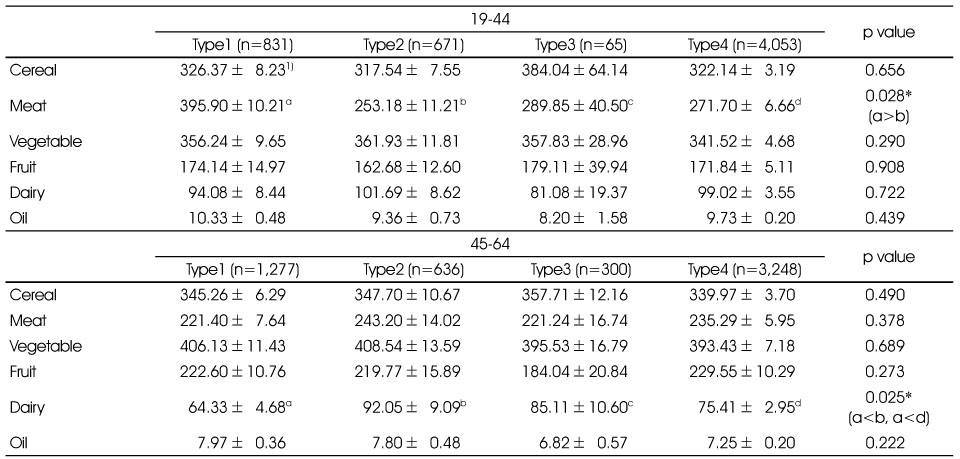
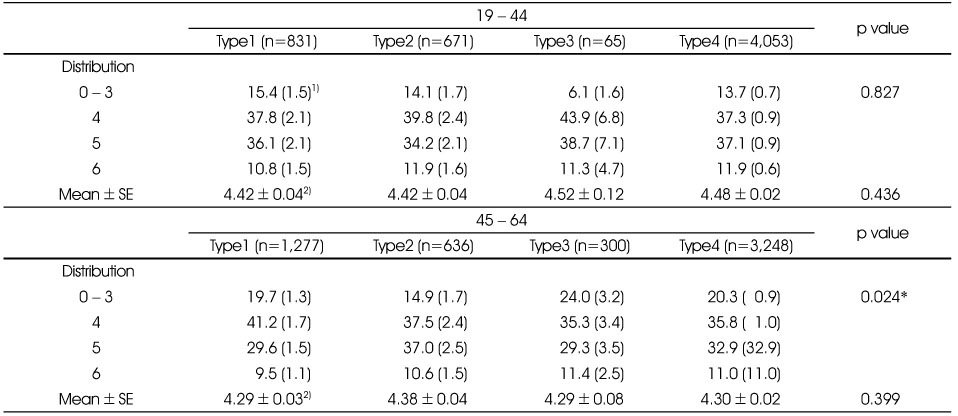
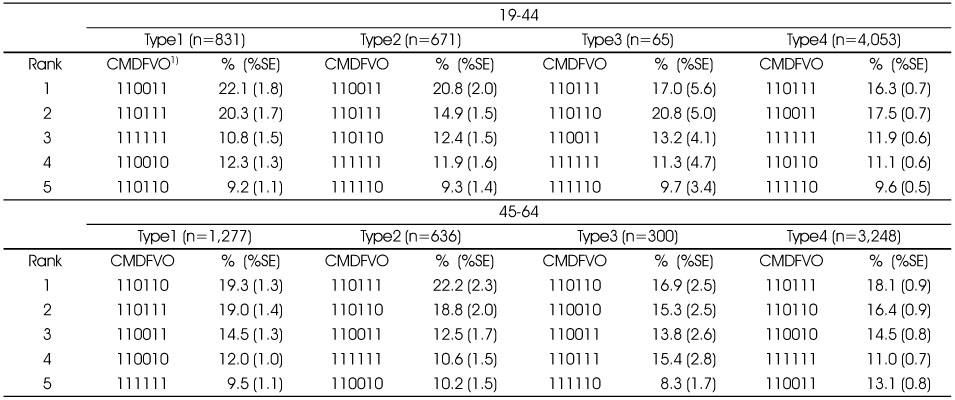
Figure & Data
REFERENCES
Citations
Citations to this article as recorded by 
- Prevalence of pre-obesity and above and its associated factors in adult women: an analysis of the 2020 Korea National Health and Nutrition Examination Survey
Hyunju Chae
Women's Health Nursing.2024; 30(2): 117. CrossRef - The Factors Influencing the Bone Mineral Density in Korean Adult Men : Based on Korea National Health and Nutrition Examination Survey 2010~2011 Data
Hye-Sang Lee
Korean Journal of Community Nutrition.2017; 22(2): 136. CrossRef
 Cite
CiteComparison of Diet Quality and Diversity according to Obesity Type among 19-64 year old Korean Adults
Comparison of Diet Quality and Diversity according to Obesity Type among 19-64 year old Korean Adults
Distribution of characteristics according to obesity types in 19-44 years old subjects
1) Estimated % (%SE)
2) Female only
*: p < 0.05, ***: p < 0.001 by χ2-test
Distribution of characteristics according to obesity types in 45-64 years old subjects
1) Estimated % (%SE)
2) Female only
*: p < 0.05, **: p < 0.01, ***: p < 0.001 by χ2-test or T-test
Energy and nutrient intakes of study subjects according to obesity types
1) Mean±SE
*: p < 0.05, **: p < 0.01, ***: p < 0.001 by ANCOVA adjusted with age, sex, education, marital status, physical activity, smoking and alcohol intake frequency, hypertension, diabetes, dyslipidemia diagnosis
Nutrient adequacy ratio (NAR) and mean adequacy ratio (MAR) according to obesity types
1) Mean±SE
*: p < 0.05, **: p < 0.01, ***: p < 0.001 by ANCOVA adjusted with age, sex, education, marital status, physical activity, smoking and alcohol intake frequency, hypertension, diabetes, dyslipidemia diagnosis
Index of nutritional quality (INQ) according to obesity types in subjects
1) Mean±SE
*: p < 0.05, ***: p < 0.001 by ANCOVA adjusted with age, sex, education, marital status, physical activity, smoking and alcohol intake frequency, hypertension, diabetes, dyslipidemia diagnosis
Food intakes from 6 food groups according to obesity types in subjects
1) Mean±SE
*: p < 0.05 by ANCOVA adjusted with age, sex, education, marital status, physical activity, smoking and alcohol intake frequency, hypertension, diabetes, dyslipidemia diagnosis
Dietary diversity score (DDS) according to obesity types
1) estimated % (%SE)
2) Mean±SE
*: p < 0.05 by χ2-test
Distribution of food group intake patterns (CMDFVO) according to obesity types
1) CMDFVO (Cereal, Meat, Dairy, Fruit, Vegetable, Oil) : 1=food group (s) consumed. 0=food group (s) not consumed.
Table 1
Distribution of characteristics according to obesity types in 19-44 years old subjects
1) Estimated % (%SE) 2) Female only *: p < 0.05, ***: p < 0.001 by χ2-test
Table 2
Distribution of characteristics according to obesity types in 45-64 years old subjects
1) Estimated % (%SE) 2) Female only *: p < 0.05, **: p < 0.01, ***: p < 0.001 by χ2-test or T-test
Table 3
Energy and nutrient intakes of study subjects according to obesity types
1) Mean±SE *: p < 0.05, **: p < 0.01, ***: p < 0.001 by ANCOVA adjusted with age, sex, education, marital status, physical activity, smoking and alcohol intake frequency, hypertension, diabetes, dyslipidemia diagnosis
Table 4
Nutrient adequacy ratio (NAR) and mean adequacy ratio (MAR) according to obesity types
1) Mean±SE *: p < 0.05, **: p < 0.01, ***: p < 0.001 by ANCOVA adjusted with age, sex, education, marital status, physical activity, smoking and alcohol intake frequency, hypertension, diabetes, dyslipidemia diagnosis
Table 5
Index of nutritional quality (INQ) according to obesity types in subjects
1) Mean±SE *: p < 0.05, ***: p < 0.001 by ANCOVA adjusted with age, sex, education, marital status, physical activity, smoking and alcohol intake frequency, hypertension, diabetes, dyslipidemia diagnosis
Table 6
Food intakes from 6 food groups according to obesity types in subjects
1) Mean±SE *: p < 0.05 by ANCOVA adjusted with age, sex, education, marital status, physical activity, smoking and alcohol intake frequency, hypertension, diabetes, dyslipidemia diagnosis
Table 7
Dietary diversity score (DDS) according to obesity types
1) estimated % (%SE) 2) Mean±SE *: p < 0.05 by χ2-test
Table 8
Distribution of food group intake patterns (CMDFVO) according to obesity types
1) CMDFVO (Cereal, Meat, Dairy, Fruit, Vegetable, Oil) : 1=food group (s) consumed. 0=food group (s) not consumed.


