
Articles
- Page Path
- HOME > Korean J Community Nutr > Volume 27(1); 2022 > Article
- Research Article 우간다 성인의 외식과 식이패턴의 관련성: 온라인 기반 설문조사
-
키됴안토니
 , 박필숙
, 박필숙
- Away-from-Home Eating and Dietary Patterns of Ugandan Adults: a Web-based- Survey
-
Anthony Kityo
, Pil-Sook Park
-
Korean Journal of Community Nutrition 2022;27(1):1-11.
DOI: https://doi.org/10.5720/kjcn.2022.27.1.1
Published online: February 28, 2022
1경북대학교 식품영양학과, 석사졸업생
2경북대학교 식품영양학과, 교수
1Master’s graduate, Department of Food Science and Nutrition, Kyungpook National University, Daegu, Korea
2Professor, Department of Food Science and Nutrition, Kyungpook National University, Daegu, Korea
2경북대학교 식품영양학과, 교수
1Master’s graduate, Department of Food Science and Nutrition, Kyungpook National University, Daegu, Korea
2Professor, Department of Food Science and Nutrition, Kyungpook National University, Daegu, Korea
-
Corresponding author:
Pil-Sook Park, Tel: +82-53-950-6236, Fax: +82-53-950-6229,
Email: pspark@knu.ac.kr
Received: 6 September 2021 • Revised: 15 November 2021 • Accepted: 25 November 2021
- 2,279 Views
- 32 Download
- 1 Crossref
- 0 Scopus
Abstract
Objectives
Away-from-home (AFH) eating has been associated with poor diet quality and health outcomes like obesity in developed countries. AFH eating is also emerging in lowincome countries, but its influence on overall diet quality is under-researched. We examined the prevalence of AFH eating and its influence on the dietary patterns of Ugandan adults.
Methods
This cross-sectional study employed a web-based survey to interview Ugandan adults aged 18 ~ 65 years. A qualitative food frequency questionnaire was used to assess the food group intake, which was then converted into daily intake frequencies. Principal component analysis was used to derive dietary patterns. The participants were then classified based on the tertiles (T) of dietary pattern scores.
Results
About 75% of the 375 participants reported eating AFH. The young men, food insecure, and urban dwellers were more likely to eat AFH 5 times/week. Three dietary patterns emerged; the animal-based, beverage pattern; the high fat, sweet pattern; and the traditional, plant-based pattern. Participants who frequently ate AFH were 2.85 times and 5.64 times more likely to be in the second and third tertiles, respectively, of the animalbased, beverage pattern compared to the rare eaters (OR = 2.85, 95% CI: 1.35-6.06 for T2 vs T1; and OR = 5.64, 95% CI: 2.50-12.73 for T3 vs T1). The odds of being in the second tertile of the high fat, sweet pattern was significantly higher for frequent AFH eaters compared to the rare eaters (OR = 2.61, 95% CI:1.23-5.52).
Conclusions
The prevalence of AFH eating was high. Frequent AFH eating was common among the young, male, food insecure, and urban dwellers, and was associated with unhealthy dietary patterns.
Korean J Community Nutr. 2022 Feb;27(1):1-11. English.
Published online Feb 28, 2022.
https://doi.org/10.5720/kjcn.2022.27.1.1
Published online Feb 28, 2022.
https://doi.org/10.5720/kjcn.2022.27.1.1
Copyright © 2022 Korean Society of Community Nutrition
Original Article
우간다 성인의 외식과 식이패턴의 관련성: 온라인 기반 설문조사
Away-from-Home Eating and Dietary Patterns of Ugandan Adults: a Web-based-Survey
Anthony Kityo ,1
and Pil-Sook Park2
,1
and Pil-Sook Park2
Abstract
Objectives
Away-from-home (AFH) eating has been associated with poor diet quality and health outcomes like obesity in developed countries. AFH eating is also emerging in low-income countries, but its influence on overall diet quality is under-researched. We examined the prevalence of AFH eating and its influence on the dietary patterns of Ugandan adults.
Methods
This cross-sectional study employed a web-based survey to interview Ugandan adults aged 18 ~ 65 years. A qualitative food frequency questionnaire was used to assess the food group intake, which was then converted into daily intake frequencies. Principal component analysis was used to derive dietary patterns. The participants were then classified based on the tertiles (T) of dietary pattern scores.
Results
About 75% of the 375 participants reported eating AFH. The young men, food insecure, and urban dwellers were more likely to eat AFH ≥ 5 times/week. Three dietary patterns emerged; the animal-based, beverage pattern; the high fat, sweet pattern; and the traditional, plant-based pattern. Participants who frequently ate AFH were 2.85 times and 5.64 times more likely to be in the second and third tertiles, respectively, of the animal-based, beverage pattern compared to the rare eaters (OR = 2.85, 95% CI: 1.35-6.06 for T2 vs T1; and OR = 5.64, 95% CI: 2.50-12.73 for T3 vs T1). The odds of being in the second tertile of the high fat, sweet pattern was significantly higher for frequent AFH eaters compared to the rare eaters (OR = 2.61, 95% CI:1.23-5.52).
Conclusions
The prevalence of AFH eating was high. Frequent AFH eating was common among the young, male, food insecure, and urban dwellers, and was associated with unhealthy dietary patterns.
Keywords
away-from-home eating; dietary patterns; principal component analysis; Ugandan adults
Introduction
Sub-Saharan Africa (SSA) is currently the world’s fastest urbanizing region with a growth in urban population of 3.5% per annum [1]. Urbanization on the continent has resulted in the nutrition transition [2], characterized by the emergence of Western eating patterns such as the preference of convenient and non-home prepared foods [3]. An epidemiological transition characterized by a rise in cardio-metabolic diseases and cancers is also apparent in SSA [4]. A pooled analysis reported a high prevalence of overweight/obesity, hypertension and low-density lipoprotein cholesterol in Uganda [5]. The 2016 Non-communicable disease (NCD) collaboration report indicated that 30.9% and 8.6% of women and 13.7% and 1.8% of men were overweight and obese, respectively [6]. Obesity is an established risk factor of cardiovascular disease, type 2 diabetes and certain types of cancer [3, 5].
The epidemiological transition has been linked to the nutrition transition. Evidence suggests that a shift from a traditional diet high in carbohydrates and fiber and low in fat and sugar to a Western diet high in energy, saturated fat, sodium, sugar, and low in fiber, increases the risk of obesity and other NCDs [7]. A multi-country study in SSA countries, including Uganda, reported a positive association between processed food dietary patterns and an increased risk of overweight and obesity [8]. To identify public health efforts for tackling the non-communicable disease epidemic, it is necessary to understand the determinants of the changing dietary patterns in a particular population.
Away-from-home (AFH) eating is one of the eating habits that is being adopted in Uganda and could be an important factor in understanding the context of the evolving epidemiological patterns in Uganda. Due to structural consequences of urbanization that do not favor home-food preparation, urban consumers have become more reliant on highly processed, non-home prepared foods [9, 10]. In a 2014 nationwide survey, close to 40% of Ugandans reported eating at least a meal away from home in a week [11]. AFH eating is linked to excessive consumption of energy dense, high fat and sugary foods[10]; and low fruit and vegetable intake [12, 13]. AFH eating also increases the risk of obesity [12, 13], and has been linked to a low-quality diet in developed nations [14, 15].
However, the influence of AFH eating on diet quality in low-income countries is largely not studied. Previous research on this topic has either been conducted in Western countries [14, 15, 16, 17, 18, 19, 20], focused on specific foods and nutrients [10, 21, 22, 23, 24], or region-specific diet indices such as the Mediterranean diet scores (MDS), Health Eating index (HEI) [14, 25] or Dietary Approaches to Stop Hypertension (DASH) [17]. A few studies that were conducted in Uganda only targeted street food consumers and did not analyze the overall diet quality [26, 27]. We found only two studies that investigated empirical dietary patterns in relation to AFH, but none of these studies was conducted in Uganda [19, 20]. Empirically derived dietary patterns provide insights into dietary patterns of countries without established diet indices. Since dietary patterns vary by region and culture, evaluating food intake in form of empirical dietary patterns captures the local overall dietary intake and can be used to offer public health advice focused on locally available foods.
Therefore, this study examined the influence of AFH on empirically derived dietary patterns of Ugandan adults aged 18 ~ 65 years.
Methods
Survey procedure and Sampling
This study employed a cross-sectional design using a self-administered online-based questionnaire that was distributed from December 2020 to February 2021 via socio-media platforms. A convenience sampling method was used to recruit study participants. The sample size was determined using the Cochran equation:
Study participants
The study population comprised all Ugandans aged 18 to 65 years who consented to respond to the questionnaire and resided in Uganda at the time of the survey. For this analysis, participants who had unreliable responses (n = 2), missing dietary data (n = 24) and missing data on the history of chronic diseases (n = 1) were excluded leaving a final analytical sample of 375 participants.
Data collection
Data was collected using a modified self-administered dietary habits and nutrition beliefs Questionnaire (KomPAN). The questionnaire was designed to assess dietary habits, nutritional knowledge and lifestyle behaviors and has been validated elsewhere [28]. The questionnaire was designed using Google forms (docs.google.com) and was pre-tested for relevancy, ease of understanding and appropriateness on 20 individuals who did not participate in the final survey. After adjusting and correcting the questionnaire, an online link was generated and randomly shared with participants using social media platforms such as Facebook®, Instagram, WhatsApp and twitter. To avoid multiple responses, the online link required the participants to sign in using their unique google accounts. When participants clicked on the shared link, they were automatically redirected to the survey questions. Once they read the consent statement and agreed to participate, they continued to answer and submit their responses, which were recorded automatically.
Measurements
Dietary intake
Dietary intake was assessed using a qualitative food frequency questionnaire that consisted of locally consumed foods in Uganda classified into 34 food groups according to recent studies [8, 29]. The frequency of food consumption over the past year was categorized into six (6) responses (from ‘never/rarely’ to ‘few times a day’). For each food group, the frequencies were weighted and converted to frequency of consumption per day (times/day). For example, “once/day was assigned a weight of 1.0 and 5 ~ 6 times/week was assigned the average of 5 and 6 divided by 7. The daily frequency ranged from 0 ~ 2 times/day [30].
Assessment and evaluation of AFH eating
Participants were asked to indicate the number of meals consumed in the previous week (breakfast, lunch, dinner) that were not prepared at home [11]. The frequency categories ranged from “rarely to “every day. For descriptive purposes, the frequency of AFH eating was categorized into four groups: “rarely; 1 ~ 2 times/week, 3 ~ 4 times/week and 5 or more times/week. Participants who ate AFH ≥ 5times/week were considered frequent AFH eaters.
Socio-demographic, lifestyle and clinical covariates
Socio-demographic, lifestyle and clinical variables were assessed using a lifestyle questionnaire. Covariates included: age (> 30 years; >30 years); sex; highest educational level achieved (high school, undergraduate and graduate); employment status (unemployed, student and employed); marital status (single, cohabiting or married); economic status (below average, average, above average); smoking status (current smoker, non-smoker: past and never smokers); drinking (current drinker, non-drinker: never and past drinkers); physical activity (active, sedentary); individual food security status (food insecure, not food insecure); and presence of any chronic diseases (ever diagnosed and/or on medication for any of the following chronic diseases: diabetes, hypertension, heart disease, stroke or dyslipidemia).
Measurement of physical activity
Participants’ physical activity at work/school and at leisure time were assessed by two separate questions and reported by participants as low, moderate or high physical activity. The overall physical activity level was then evaluated by combining the two questions into 3 categories: low, moderate and high physical activity [28]. For the present analysis, low physical activity was classified as sedentary and moderate/high were classified as active.
Determination of dietary patterns
The main outcome variable was the prevalence of dietary patterns. To determine dietary patterns, the 34 food groups were further combined into 29 food groups. Maize, millet and sorghum dishes were combined into traditional cereals; energy drinks and soft drinks into sugar-sweetened beverages (SSB); and nuts/seeds and their sauces were combined into nuts and seeds. The daily frequency of intake of food groups (times/day) was used to generate dietary patterns by Principal components analysis (PCA). Kaiser-Meyer-Olkin (KMO) test was used to check for the adequacy of the sample. Bartlett’s test of sphericity was used to check whether data was suitable for reduction. The two conditions were satisfied i.e. KMO was 0.86 and Bartlett’s test was significant (P < 0.0001). Eigen values ≥ 1, the scree plot and cumulative percentage variance were considered in deriving initial components. Three components were identified and were rotated using varimax rotation. Food groups with a factor loading of ≥ 0.4 were used to interpret components. The scores of the derived components were assigned to each participant.
Statistical Analysis
SAS 9.4 (SAS Institute, Cary, NC, USA) was used to analyse data. Data are presented as frequencies and prevalence. Participant characteristics were compared across frequencies of AFH eating using chi-square tests. We categorized dietary pattern scores into tertiles (T). The first tertile represented low consumption and upper tertile represented high consumption of dietary patterns. Adjusted multinomial logistic regression was used to estimate odds ratios (ORs) and 95% confidence intervals (CIs) for the association between AFH eating and adherence to dietary patterns. Rare consumers and tertile one (T1) were used as the reference categories for the independent and dependent variables respectively. The models were adjusted for age group, sex, educational level, place of residence, economic status, employment status, drinking, smoking, physical activity, food security and presence of any chronic diseases (diabetes, hypertension, heart disease or dyslipidemia). All covariates were examined for multi-collinearity based on the conditional index ≥ 30. In all analyses, P < 0.05 was used to test statistical significance.
Ethical considerations
All study materials were approved by the Institutional Review Board (IRB) of Kyungpook National University (approval number: KNU-2020-0138).
Results
Socio-demographic, lifestyle and clinical characteristics of participants according to frequency of AFH eating are displayed in Table 1. About 75% of participants reported eating at least a meal away from home per week. The distribution of age, gender, place of residence and perceived food insecurity significantly differed across AFH categories. Frequent AFH eaters were more likely to be less than 30 years old, men, urban residents and food insecure compared to rare eaters.
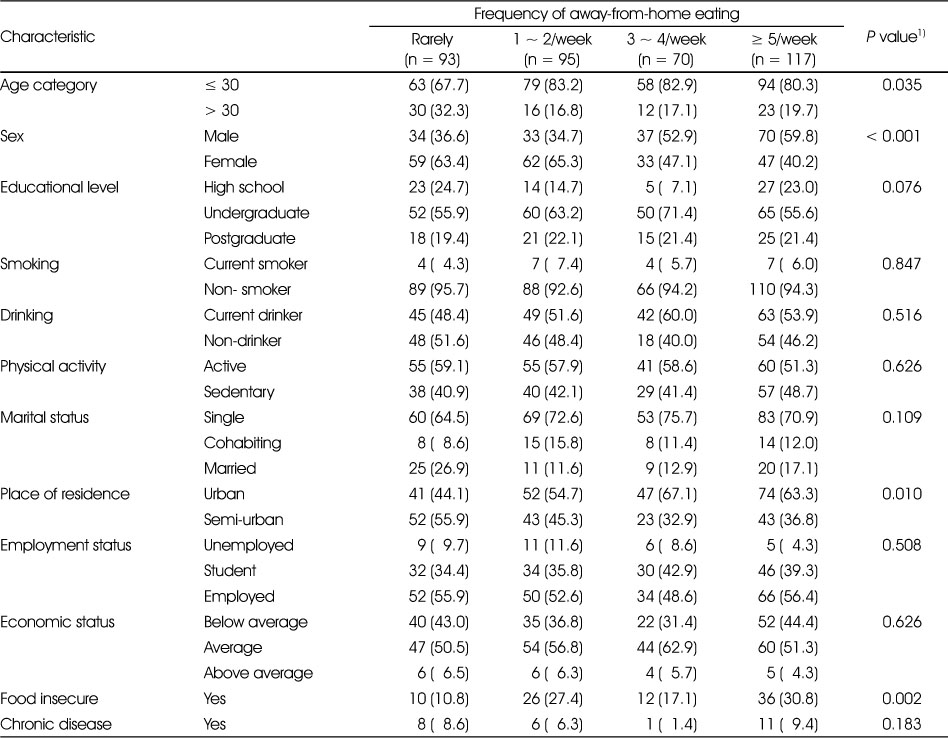
Table 1
Characteristics of participants according to frequency of away-from-home eating (n = 375)
The 29 food groups and corresponding food items used to derive dietary patterns are shown in Table 2. Table 3 shows the factor loadings of different food items on the 3 principal components. Three components that explained 33.2% of the total variance in food groups were generated. The components were labelled based on the food items with a factor loading of ≥ 0.4. The first component highly correlated with meats, fish, insects, eggs, SSB, alcoholic and coffee beverages and hence was labelled “animal-based, beverage pattern”. The second component had high factor loadings on bread and buns, fats, milk, chips, sweets and confectionary and was thus labelled “high-fat, sweet pattern”. The third component was highly correlated with traditional cereals, legumes, nuts and seeds, starchy roots, plantain, and fresh juices and was thus labelled “traditional, plant-based pattern”.
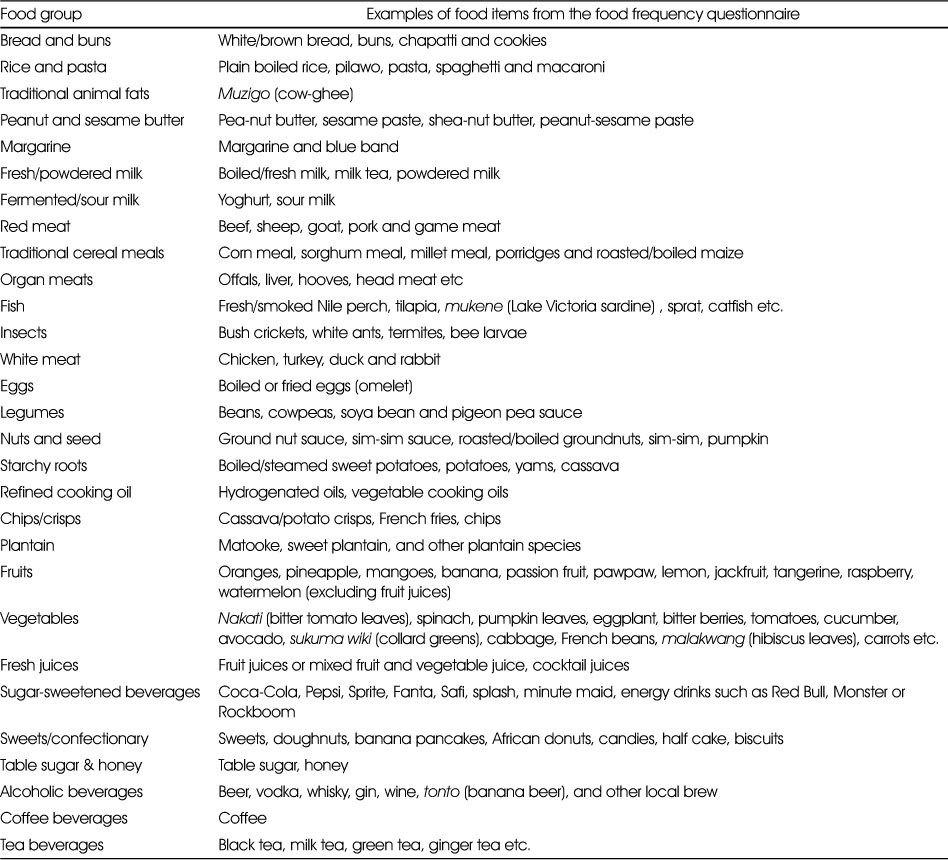
Table 2
Food groups used to generate dietary patterns of participants
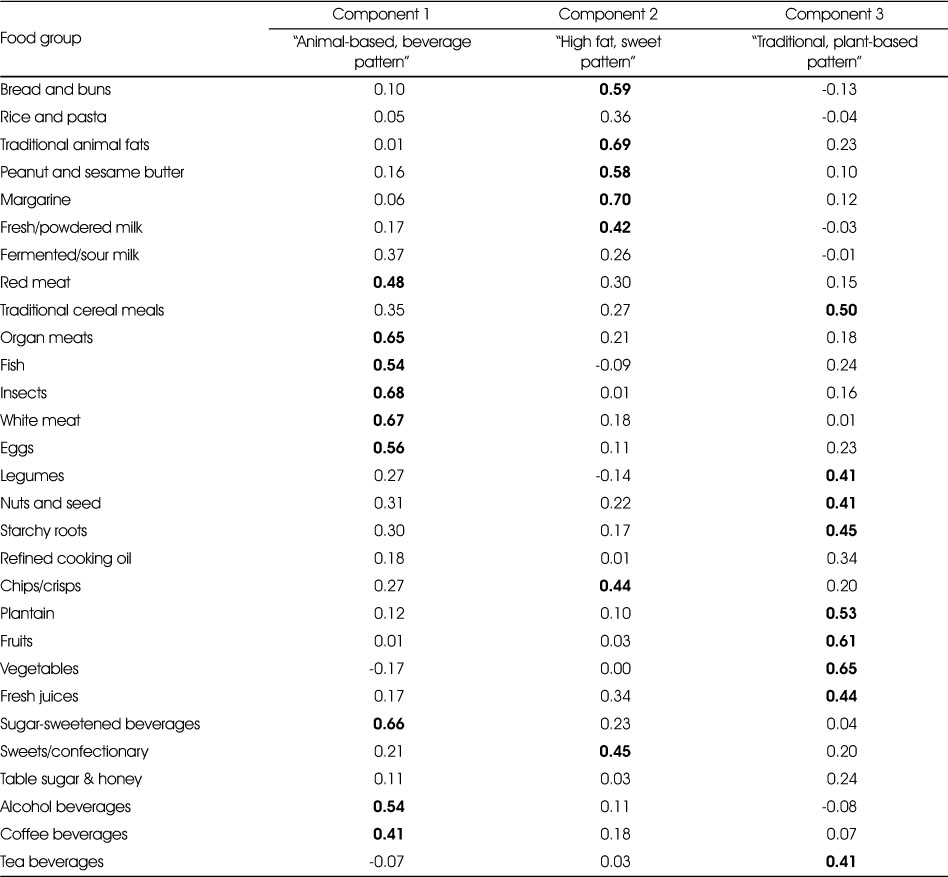
Table 3
Factor loadings of food groups explaining dietary patterns of participants
Results of the bivariable association between AFH eating and tertiles of the three dietary patterns are presented in Table 4. The distribution of participants across tertiles of the animal-based, beverage pattern significantly differed across frequency of AFH. The proportion of participants in the extreme tertile of the animal-based, beverage pattern was highest among frequent AFH eaters compared to rare eaters. However, except the traditional, plant-based pattern, both the animal-based beverage and high fat, sweet patterns were significantly associated with AFH after adjusting for potential covariates (Table 5). Participants who ate AFH ≥ 5 times/week were 2.85 times more likely to be in the second tertile and 5.64 times more likely to be in the third tertile of the animal-based, beverage pattern compared to rare eaters (OR = 2.85, 95% CI:1.35-6.06 for T2 vs T1; and OR = 5.64, 95% CI:2.50-12.73 for T3 vs T1). In addition, those who ate AFH 3 ~ 4 times/week were 2.70 times and 5.04 times more likely to be in the second and third tertile of the animal-based, beverage pattern respectively, compared to rare AFH eaters (OR = 2.70, 95% CI: 1.15-6.32 for T2 vs T1; and OR = 5.04, 95% CI: 2.02-12.58 for T3 vs T1). On the other hand, the odds of being in the second tertile of the high fat, sweet pattern were significantly higher for frequent AFH eaters compared to rare eaters (OR = 2.61, 95% CI:1.23-5.52).
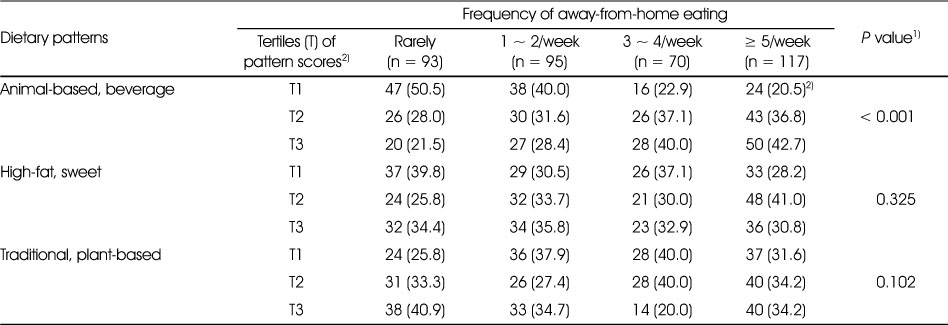
Table 4
Bivariable association between tertiles of dietary pattern scores and frequency of away-from-home eating (n = 375)
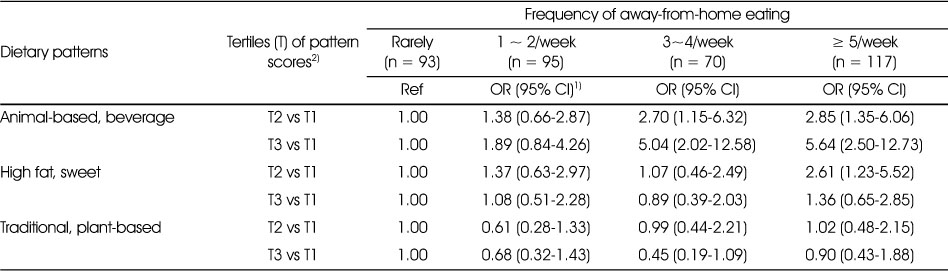
Table 5
Multivariate association between tertiles of dietary pattern scores and frequency of away-from-home eating (n = 375)
Discussion
For the first time, we sought to understand the influence of AFH eating on the overall diet quality of Ugandan adults. We observed that three quarters of adult Ugandans who participated in this survey ate at least a meal away from home in a week. We identified three dietary patterns: the animal-based beverage pattern, the high-fat sweet pattern and the traditional, plant-based pattern. Frequent AFH eating was associated with increased adherence to the animal-based, beverage pattern and the high fat, sweet pattern.
The prevalence of AFH reported in this study is comparable to that in Singapore [31] but higher than that in the UK [32] and the US Hispanic community study [14]. In nationwide study in Uganda, AFH eating was estimated at about 40% [11]. The sampling method and overall survey methodology used in our study make it difficult to compare our results with those of previous studies. However, our findings suggest that AFH eating behavior may have increased and exceeded that reported in some developed nations. Notably, fast-food use was reported at 70% by previous studies in Uganda [33] while street food users were estimated at 63.5% in Kampala [26]. The rapid socio-economic transformation and urbanization evidenced by an increase in Gross-Domestic Product, a decrease in youth unemployment rate, and an increase in the working and urban population are probable drivers of the increasing popularity of AFH eating in Uganda [34, 35]. In line with the previous association between AFH eating and obesity [12, 13, 14, 17, 25, 36], nutritional and public healthy interventions aiming at reducing AFH eating or encouraging healthier choices during dining out are urgently needed.
This study examined the overall diet quality specific to the Ugandan population, rather than specific nutrients or regional specific diet indices. Furthermore, we used principal components analysis to derive dietary patterns. This approach has the advantage of capturing variations in eating patterns that exist in different populations depending on socio-economic status, ethnicity and cultural background [37]. The influence of AFH eating on empirically derived dietary patterns has not been widely reported which makes comparisons with other studies difficult. Nevertheless, our dietary patterns are comparable to previously derived dietary patterns and reflect the healthiness of the diet in this population [29]. Our findings show that AFH eating is associated with a poor diet quality, consistent with several studies. Full-service and fast-food restaurant use was associated with non-adherence to the Alternate Healthy Eating Index 2010 (AHEI-2010) [14], while fast-food use was associated with non-adherence to the HEI and MDS [25]. Consumption of high energy from fast foods was associated with non-adherence to the DASH diet. Moreover, abstaining from AFH eating appeared to favor consumption of a prudent dietary pattern [19]. Frequent AFH eating was associated with consumption of an ultra-processed food pattern [20], low intake of vegetables [13], high intake of energy , fat, and low intake of micronutrients [23], and consumption of less healthy foods [18]. The two dietary patterns associated with AFH in this study resemble a Western dietary pattern. The animal-based, beverage pattern was correlated with intake of meat, including red meat, eggs, sugar-sweetened beverages, alcohol and coffee. The high-fat, sweet pattern was rich in refined bread, processed fats, deep fried foods and sugary confectionary. Such food choices have been linked to obesity and cardiovascular diseases [7, 8, 12].
Our results highlight a shift from a traditional Ugandan dietary pattern among frequent AFH consumers. Substitution of a traditional dietary pattern rich in carbohydrates and fiber, fruits, vegetables, legumes, nuts and seeds, and low in fat and sugar, with a Western diet high in energy, saturated fat, sodium, sugar and low in fiber increases the risk of obesity and other NCDs [7]. A traditional Ugandan diet comprises a starchy staple, which could be plantain or grains like millet or sorghum; and sauce, which could comprise a mixture of vegetables, legumes or nuts, and meat or fish eaten occasionally [38].
There are probable reasons for the association between AFH eating and unhealthy dietary patterns. It is possible that AFH food establishments offer food items which are characteristic components of unhealthy dietary patterns. However, our study cannot confirm the menu items provided by AFH food establishments since we did not assess the specific foods consumed away from home. Studies from other countries reported that majority of the menu developers considered increasing sales and profits as primary considerations while offering menus. Only 21% considered health and nutrition as important aspects in their menus. In addition, healthy menu items have a low shelf life, increased preparation time, low sales and high labor demands [39]. Notably, street-foods offer foods made from cheap ingredients such as refined flour, maize and hydrogenated oils [2]. This type of AFH eating is very popular in low-income countries [26, 36, 40] suggesting that consumers in low-income countries may be at a high risk eating low quality AFH food. Nevertheless, consumer attitudes might also influence the choice of foods bought AFH. Only a few consumers considered health as an important determinant of the choice of AFH foods [41, 42]. Thus, interconnected consumer and supplier-related factors seem to mediate the relationship between AFH and poor diet quality and these factors will require thorough investigation if AFH eating is to be targeted for health promotion.
To unravel the motivators to AFH eating and design effective solutions that target AFH eating in Uganda, socio-demographic characteristics associated with AFH also deserve special attention. Frequent AFH eating was dominant among men [26, 43], the young [26, 31, 33], urban dwellers [44] and the food insecure. Thus, interventions such as nutritional education aimed at fostering health AFH food choices should target the young, men, the food insecure and urban dwellers.
Several limitations should be considered while interpreting these findings. First, the sampling technique used in this study and the small sample size make it difficult to generalize these findings to the entire Ugandan urban/peri-urban population. However, our sample was relatively close to the composition of semi-urban and urban Uganda, although there are no recent census reports for comparison with national statistics. The urban Ugandan population is 53% women [45], which is similar to the female proportion in our study. We sampled 54% of the employed, slightly above the proportion of urban dwellers in paid employment reported in 2016 (51.3%) and below the employment to population ratio of 58.2% [46]. But it is also important to note that our sample comprised a significant number of students, who could possibly occupy some form of employment but were not counted as employed. Second, the use of an online-based survey might have led to selection bias where young people who own computers and smart phones were more likely to participate. Nevertheless, the median age in our study was 25 years, consistent with the general urban population which is dominated by the 20-39-year-old as of 2019. In addition, those with at least an undergraduate degree were more likely to participate in the study since they have social media access and adequate internet navigation skills. Thus, the educational level in our study might not represent that of the general urban population. Census data estimated the proportion of the employed population in urban Uganda who attained post-secondary education or above to be at only 25.1% in 2016 [46]. Consequently, our findings are not generalizable to the less educated urban dwellers. Third, this was a cross-sectional study which precludes causal inference. Fourth, dietary data was collected using a food frequency questionnaire (FFQ), which relies on memory. Therefore, the study may not have captured dietary intake accurately. Moreover, the qualitative FFQ could not capture the portion sizes of food consumed by participants. This might have affected the derived dietary patterns in our study. Lastly, AFH eating was assessed using a self-reported questionnaire that was not validated for this population. This could have led to inaccurate reporting of dietary intake. In addition, there are different definitions of AFH eating between studies. We did not consider the place where food was prepared making comparison with other studies difficult. The place of food preparation rather than the place of consumption appears to influence the nutritional quality of AFH foods [36].
Nevertheless, this is a novel study, the first to examine the determinants of AFH eating and its influence on overall dietary quality defined by empirical dietary patterns in Uganda. Dietary patterns differ according to culture and ethnicity. This underscores the need to study population specific dietary patterns. In addition, the dietary pattern approach offers a broad picture of eating habits beyond single nutrients, and offers a practical way of giving dietary advice to the population [37]. Thus, we were able to capture a population specific overall eating pattern. We also adjusted for potential covariates to capture the independent relationship between AFH eating and dietary patterns.
Conclusions
Understanding the influence of away-from-home eating on the overall diet quality in Uganda is necessary for early interventions since the influence of this behavior on obesity and other NCDs is known in developed countries. The prevalence of AFH is appalling, and frequent AFH eating is associated with unhealthy dietary patterns. Future studies should investigate the motivating factors of AFH to inform nutritional interventions such as nutritional education aimed to foster healthy AFH choices, especially among the young, men, urban dwellers and the food insecure.
Notes
Conflict of Interest:There are no financial or other issues that might lead to conflict of interest.
Acknowledgments
We thank study participants for investing their time and resources to attempt the survey questionnaire.
References
-
UN-Habitat. Annual Progress report 2019 [Internet]. UN-Habitata; 2020 [cited 2021 Apr 7].Available from: https://unhabitat.org/annual-
report- 2019 .
-
-
Steyn NP, Mchiza ZJ. Obesity and the nutrition transition in Sub-Saharan Africa. Ann NY Acad Sci 2014;1311(1):88–101.
-
-
NCD Risk Factor Collaboration (NCD-RisC). Trends in adult body-mass index in 200 countries from 1975 to 2014: A pooled analysis of 1698 population-based measurement studies with 19.2 million participants. Lancet 2016;387(10026):1377–1396.
-
-
Abarca-Gómez L, Abdeen ZA, Hamid ZA, Abu-Rmeileh NM, Acosta-Cazares B, Acuin C, et al. Worldwide trends in body-mass index, underweight, overweight, and obesity from 1975 to 2016: A pooled analysis of 2416 population-based measurement studies in 128·9 million children, adolescents, and adults. Lancet 2017;390(10113):2627–2642.
-
-
FAO. Agriculture food and nutrition for Africa - A resource book for teachers of agriculture. Rome: Publishing Management Group, FAO Information Division; 1997.
-
-
Van’t Riet H, den Hartog AP, van Staveren WA. Non-home prepared foods: Contribution to energy and nutrient intake of consumers living in two low-income areas in Nairobi. Public Health Nutr 2002;5(4):515–522.
-
-
Uganda Ministry of Health. Non-Communicable Disease Risk Factor Baseline Survey [Internet]. Kampala: Uganda Ministry of Health; 2014 [cited 2021 Apr 7].Available from: https://www.health.go.ug/cause/non-
communicable- disease- risk- factor- baseline- survey/ .
-
-
Seguin RA, Aggarwal A, Vermeylen F, Drewnowski A. Consumption frequency of foods away from home linked with higher body mass index and lower fruit and vegetable intake among adults: A cross-sectional study. J Environ Public Health 2016;2016:1–12.
-
-
Ziauddeen N, Almiron-Roig E, Penney TL, Nicholson S, Kirk SFL, Page P. Eating at food outlets and “on the go” is associated with less healthy food choices in adults: Cross-sectional data from the UK National Diet and Nutrition Survey Rolling Programme (2008–2014). Nutrients 2017;9(12):1315–1332.
-
-
Mueller MP, Blondin SA, Korn AR, Bakun PJ, Tucker KL, Economos CD. Behavioral correlates of empirically-derived dietary patterns among university students. Nutrients 2018;10(6):716–732.
-
-
Andrade GC, Louzada ML da C, Azeredo CM, Ricardo CZ, Martins APB, Levy RB. Out-of-home food consumers in Brazil: What do they eat? Nutrients 2018;10(2):218–230.
-
-
Schröder H, Fito M, Covas MI. Association of fast food consumption with energy intake, diet quality, body mass index and the risk of obesity in a representative Mediterranean population. Br J Nutr 2007;98(6):1274–1280.
-
-
Kowalkowska J, Wadolowska L, Czarnocinska J, Czlapka-Matyasik M, Galinski G, Jezewska-Zychowicz M, et al. Reproducibility of a questionnaire for dietary habits, lifestyle and nutrition knowledge assessment (KomPAN) in Polish adolescents and adults. Nutrients 2018;10(12):1845–1864.
-
-
Auma CI, Pradeilles R, Blake MK, Holdsworth M. What can dietary patterns tell us about the nutrition transition and environmental sustainability of diets in Uganda? Nutrients 2019;11(2):342–353.
-
-
Willett W. In: Food-Frequency Methods. In: Nutritional epidemiology. 2nd ed. New York: Oxford University Press; 1998. pp. 83-90.
-
-
Adams J, Goffe L, Brown T, Lake AA, Summerbell C, White M, et al. Frequency and socio-demographic correlates of eating meals out and take-away meals at home: Cross-sectional analysis of the UK national diet and nutrition survey, waves 1-4 (2008-12). Int J Behav Nutr Phys Act 2015;12(1):51–60.
-
-
Ayo AS, Sserunkuuma D, Bonabana-Wabbi J. Determinants of fast-food consumption in Kampala, Uganda. African J Food Agric Nutr Dev 2012;12(5):6567–6581.
-
-
World Bank. Uganda economic update, 16th edition: Investing in Uganda’s youth [Internet]. World Bank; 2020 [cited 2021 Apr 7].Available from: www.worldbank.org/uganda .
-
-
United Nations Population Division. World urbanization prospects [Internet]. United Nations Population Division; 2018 [cited 2021 Apr 7].Available from: https://population.un.org/wup/Publications/ .
-
-
Goode PM. In: Edible plants of Uganda: The value of wild and cultivated plants as food. Rome: Food and Agriculture Organization; 1989. pp. 15-24.
-
-
Van’t Riet H, Den Hartog AP, Hooftman DAP, Foeken DWJ, Mwangi AM, Van Staveren WA. Determinants of non-home-prepared food consumption in two low-income areas in Nairobi. Nutrition 2003;19(11-12):1006–1012.
-
-
O’Dougherty M, Harnack LJ, French SA, Story M, Oakes JM, Jeffery RW. Nutrition labeling and value size pricing at fast-food restaurants: A consumer perspective. Am J Heal Promot 2006;20(4):247–250.
-
-
Van’T Riet H, Den Hartog AP, Mwangi AM, Mwadime RKN, Foeken DWJ, Van Staveren WA. The role of street foods in the dietary pattern, of two low-income groups in Nairobi. Eur J Clin Nutr 2001;55(7):562–570.
-
-
Kampala Capital City Authority. Statistical abstract for Kampala city 2019 [Internet]. Kampala: 2019 [cited 2021 Nov 8].Available from: https://kcca.go.ug/media/docs/Statistical-
Abstract- 2019.pdf .
-
-
Uganda Bureau of Statistics. 2020 Statistical abstract [Internet]. 2020 [cited 2021 Nov 8].Available from: http://library.health.go.ug/sites/default/files/resources/UBOS%20Statistical%20Abstract%202020.pdf .
-
 Cite
Cite

