
Articles
- Page Path
- HOME > Korean J Community Nutr > Volume 22(1); 2017 > Article
-
Research Article
- Metabolic Syndrome Status of Chinese Workers and Their Physical Profiles, Lifestyle Scores, and Nutrient Intakes
-
Chao Wang, Hokyung Ryu

-
Korean Journal of Community Nutrition 2017;22(1):63-73.
DOI: https://doi.org/10.5720/kjcn.2017.22.1.63
Published online: February 28, 2017
Department of Food Science and Nutrition, Pusan National University, Busan, Korea.
- Corresponding author: Hokyung Ryu. Department of Food Science and Nutrition, Pusan National University, 2, Busandaehak-ro 63beon-gil, Geumjeong-gu, Busan 46241, Korea. Tel: (051) 510-7397, Fax: (051) 583-3648, hokryu@pusan.ac.kr
• Received: January 17, 2017 • Revised: February 27, 2017 • Accepted: February 28, 2017
Copyright © 2017 The Korean Society of Community Nutrition
This is an Open-Access article distributed under the terms of the Creative Commons Attribution Non-Commercial License (http://creativecommons.org/licenses/by-nc/3.0/) which permits unrestricted non-commercial use, distribution, and reproduction in any medium, provided the original work is properly cited.
- 1,444 Views
- 1 Download
- 1 Crossref
Abstract
-
Objectives
- This study was conducted to survey the related factors of metabolic syndrome of Chinese workers aged 20 years and above.
-
Methods
- The study was conducted at three locations in Shandong, China, currently working and took the physical examination (PE) within one year in the area as target participants. Personal characteristics, physical and biochemical results based on the PE, lifestyle habits, and food intake of the participants were used to analyze the relationship with metabolic syndrome.
-
Results
- Results showed that overall, thirty-one subjects (22.5%) had metabolic syndrome, twenty males (32.7%) and eleven females (14.2%). Metabolic syndrome was related to age, gender, educational level and occupational type with more risk in male (P < 0.05), people of older age (P < 0.001), low educational level (P < 0.05) and nonoffice workers (P < 0.01). According to the life style scores, lifestyle evaluation showed specifically alcohol consumption and smoking (P < 0.001) and stress management (P < 0.05) as important factors that were associated with the metabolic syndrome. High calorie (P < 0.01) and carbohydrate (P < 0.01) intakes were observed on male participants with metabolic syndrome in comparison to the non-metabolic syndrome but no significant difference on female participants.
-
Conclusions
- This results of this study can be used as significant supporting data to prevent and control metabolic syndrome in Chinese workers.
- 1. Yoo JS, Jeong JI, Park CG, Kang SW, Ahn JA. Impact of life style characteristics on prevalence risk of metabolic syndrome. J Korean Acad Nurs 2009; 39(4): 594-601.ArticlePubMed
- 2. Go DS, Park BY, Seok GH. The effects of metabolic syndrome ofhealth promotion behavior in workers. J Korea Inst Electron Commun Sci 2013; 7(2): 254-259.
- 3. Alberti KG, Zimmet PZ. Definition, diagnosis and classification of diabetes mellitus and its complications, part 1: diagnosis and classification of diabetes mellitus provisional report of a WHO consultation. Diabet Med 1998; 15(7): 539-553.ArticlePubMed
- 4. Jang HS. The relationship between metabolic syndrome, its components, and cancer incidence in Korean [dissertation]. Ulsan University; 2012.
- 5. Chinese Center for Disease Control and Prevention. Report on Chronic Disease in China [internet]. Chinese Center for Disease Control and Prevention; 2006; cited 2016 Jun 5]. Available from: http://www.chinacdc.cn/jdydc/200605/P0200605123217538575667461530.pdf.
- 6. Chinese Center for Disease Control and Prevention. Report on nutrition health condition in China [internet]. Chinese Center for Disease Control and Prevention; 2015; cited 2017 Feb 17]. Available from: http://www.nhfpc.gov.cn/xcs/s3574/201506/6b4c0f873c174ace9f57f11fd4f6f8d9.shtml.
- 7. Dong-feng GU, Reynolds K, Wen-jie YANG. The prevalence of metabolic syndrome in the general adult population aged 35-74 years in China. Chin J Diabetes 2005; 13(3): 181-186.
- 8. Sun SY. Metabolic syndrome in Chinese medicine study. Asia Pac Tradit Med 2014; 10(5): 3-4.
- 9. Yanli LUO. Distinctions between Chinese and American food cultures: A mirror of the two countries' different core values. J Guangxi Youth Lead Coll 2007; 17(2): 69-70.
- 10. Teng YJ, Wang Y. A cross-cultural constrastive study between the national culture psychology and the convention in food and drink. J Weifang Univ 2005; 5(5): 117-120.
- 11. Kang SH, Hwang SY. Influence of occupational type and lifestyle risk factors on prevalence of metabolic syndrome among male workers: A retrospective cohort study. Korean J Adult Nurs 2016; 28(2): 180-190.ArticleLink
- 12. Park HS, Park J. The relationship between metabolic syndrome and quality of life in Korean adult women. J Korea Inst Electron Commun Sci 2013; 8(4): 639-648.Article
- 13. Meng XD, Wang X. Causes of enterprise staff working overtime and characteristics of labor time. Res Econ Manag 2015; 12(1): 1-2.
- 14. Lu YH, Lu JM, Wang SY, Li CL, Liu LS, Zhang RP, et al. Comparison of the diagnostic criteria of metabolic syndrome by international diabetes federation and that by Chinese medical association diabetes branch. Natl Med J China 2006; 86(6): 386-389.
- 15. Kang SW. The validity and reliability of a lifestyle evaluation tool for patients with metabolic syndrome. J Korean Acad Fundam Nurs 2010; 17(4): 487-497.
- 16. Kang JS, Kang HS, Yun EK, Choi HR. Factors influencing health Behavior compliance of patients with metabolic syndrome. Korean J Adult Nurs 2012; 24(2): 191-199.Article
- 17. National Health and Family Planning Commission of the People's Republic of China. Diagram: Nutritional and chronic diseases in China [Internet]. 2015; cited 2017 Feb 17]. Available from: http://www.nhfpc.gov.cn/jkj/s5879/201506/4505528e65f3460fb88685081ff158a2.shtml.
- 18. Song FY, Lee K, Yu P, Lin XK, Yang HL, Zhang YQ, et al. Development of a semi quantitative food frequency questionnaire for inhabitants in Chaoshan region China. South China J Prev Med 2005; 10(3): 5.
- 19. Lee GN, Choi HY, Yang SJ. Effects of dietary and physical activity interventions on metabolic syndrome. J Korean Acad Nurs 2015; 45(2): 483-494.ArticlePubMedLink
- 20. Korea centers for disease control and prevention. 2014 Korea Health Statistics: Korea National Health and Nutrition Examination Survey (KNHANESVI-2) [internet]. Korea centers for disease control and prevention; 2014; cited 2017 Jan 9]. Available from: http://www.knhanes.cdc.go.krhttp://www.knhanes.cdc.go.kr.
- 21. Choi MK, Jun YS, Bae YJ, Sung CJ. A study on nutrient intakes and blood parameters of adult men and women with metabolic syndrome. J Korean Soc Food Sci Nutr 2007; 36(3): 311-317.Article
- 22. Lee EH, Cho S, Kwon EJ, Hyun SM, Park JY, Kim M. Prevalence and related factors of metabolic syndrome among Korean older adults. J Korean Soc Health Educ Promot 2009; 26(4): 129-143.
- 23. Lee MS, Kang HJ, Oh HS, Paek YM, Choue RW, Park YK, et al. Effects of worksite nutrition counseling for health promotion: twelve-weeks of nutrition counseling has positive effect on metabolic syndrome risk factors in male workers. Korean J Community Nutr 2008; 13(1): 46-61.
- 24. Yoo H, Kim YH. A study on the characteristics of nutrient intake in metabolic syndrome subjects. Korean J Nutr 2008; 41(6): 510-517.
- 25. Kang JS, Kang HS, Yun EK, Choi HR. Factors influencing health Behavior compliance of patients with metabolic syndrome. Korean J Adult Nurs 2012; 24(2): 191-199.Article
- 26. Lee EH, Kim HY, Lee YH, Moon YH, Kwon EJ, Jee SH. Effectiveness of lifestyle intervention on the management of metabolic syndrome. Korean J Health Educ Promot 2007; 24(3): 1-19.
- 27. Shin KA. Worker's exercise frequency, smoking, metabolic syndrome, and relationship with inflammatory indices. Korean Alliance Health Phys Educ 2009; 117-117.
- 28. Yeo DH, Woo JM. Stress and metabolic syndrome. Korean J Stress Res 2007; 15(2): 93-98.
- 29. Fang H. An analysis of the work pressure intensity and differences of faculty and staff in universities. J Heihe Univ 2016; 5: 1-2.
- 30. Kim BS. Hypertension and stress. Korean J Stress Res 2006; 14(2): 69-76.
- 31. Kim MO, Lee HJ, Park EJ, Lee KH. Nutrient intake and risk of metabolic Syndrome in male smokers. Korean J Community Nutr 2010; 15(6): 783-795.
- 32. Moon HK, Kong JE. Assessment of nutrient intake for middle aged with and without metabolic syndrome using 2005 and 2007 Korean National Health and Nutrition Survey. Korean J Nutr 2010; 43(1): 69-78.Article
- 33. Mao XY, Zhang AZ. Dietary fat, insulin resistance and metabolic syndrome. J Environ Hyg 2006; 33(2): 1.
- 34. Chung CE. Association of total sugar intakes and metabolic syndrome from Korean National Health and Nutrition Examination Survey 2001-2002. Korean J Nutr 2007; 40(9): 29-38.
- 35. Han MR, Lim JH, Song YJ. The effect of high-carbohydrate diet and low-fat diet for the risk factors of metabolic syndrome in Korean adolescents: Using the Korean National Health and Nutrition Examination Surveys (KNHANES) 1998-2009. J Nutr Health 2014; 47(3): 186-192.Article
- 36. Grundy SM, Abate N, Chandalia M. Diet composition and the metabolic syndrome: What is the optimal fat intake? Am J Med 2002; 113: Suppl 9B. 25S-29S.Article
- 37. Jenkins DJ, Kendall CW, Augustin LS, Vuksan V. High complex carbohydrate or lente carbohydrate foods. Am J Med 2002; 113(9): 30-37.ArticlePubMed
REFERENCES
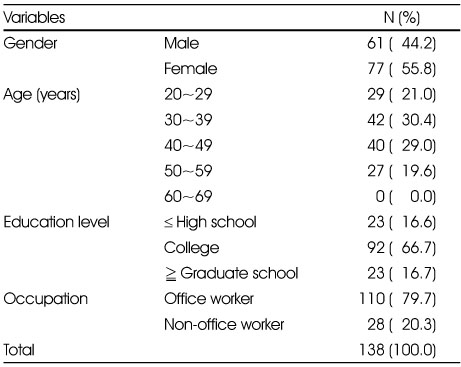
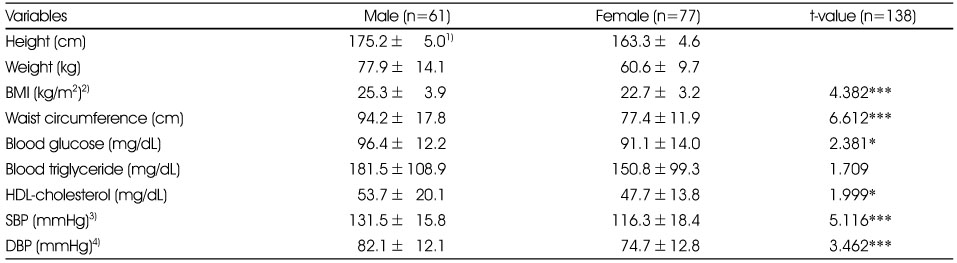
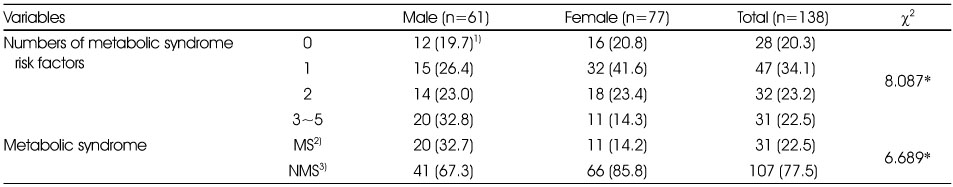
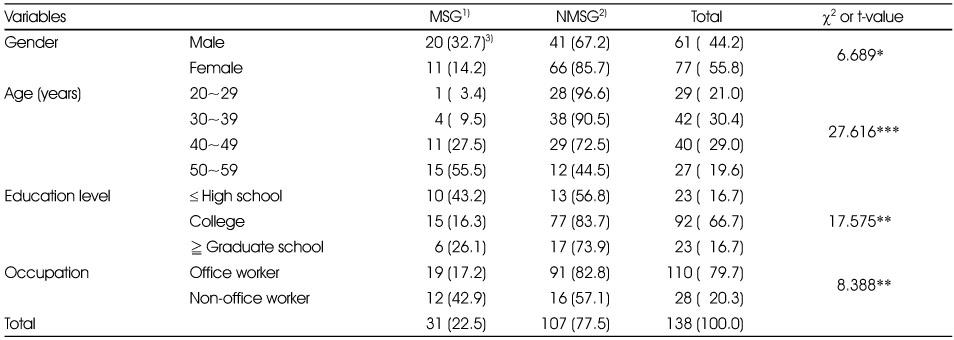
Table 5
Comparison of anthropometric and serum profile and blood pressure of the study subjects between MSG and NMSG
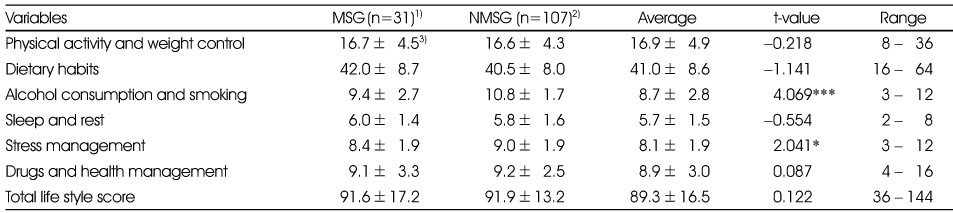
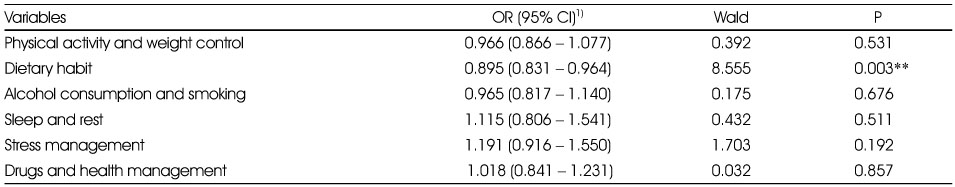
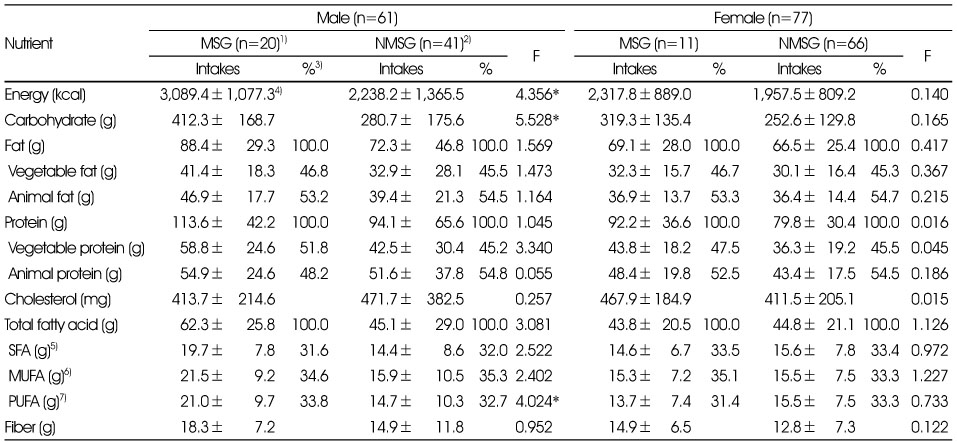
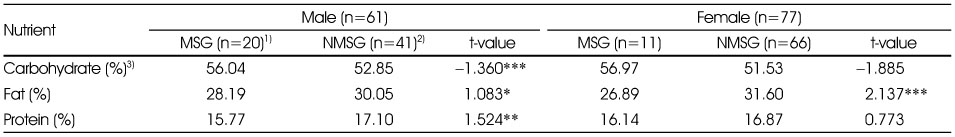
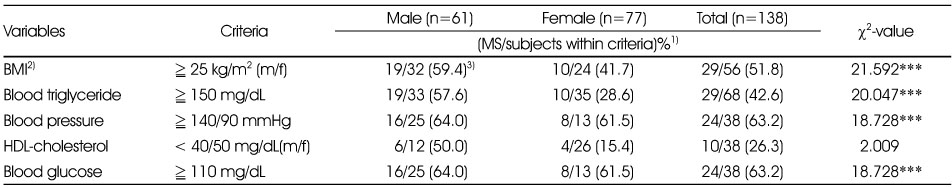
Figure & Data
REFERENCES
Citations
Citations to this article as recorded by 
- Psychometric Properties of the Short-Form Revised Lifestyle Evaluation Scale for Metabolic Syndrome–Korean
Shinae Seo, Chun-Ja Kim, Se-Won Kang, Dae Jung Kim, Elizabeth A. Schlenk
The Science of Diabetes Self-Management and Care.2025; 51(6): 578. CrossRef
 Cite
CiteMetabolic Syndrome Status of Chinese Workers and Their Physical Profiles, Lifestyle Scores, and Nutrient Intakes
Metabolic Syndrome Status of Chinese Workers and Their Physical Profiles, Lifestyle Scores, and Nutrient Intakes
General characteristics of the study subjects
Comparison of anthropometric and biochemical data of the study subjects
1) Mean±SD
2) BMI: body mass index
3) SBP: systolic blood pressure
4) DBP: diastolic blood pressure
*: p < 0.05, ***: p < 0.001
The numbers of metabolic syndrome risk factors of the study subjects
1) N (%)
2) MS: metabolic syndrome
3) NMS: non-metabolic syndrome
*: p < 0.05
Comparison of the general characteristics between MSG and NMSG
1) MSG: metabolic syndrome group
2) NMSG: non-metabolic syndrome group
3) N (%)
**: p < 0.01, ***: p < 0.001
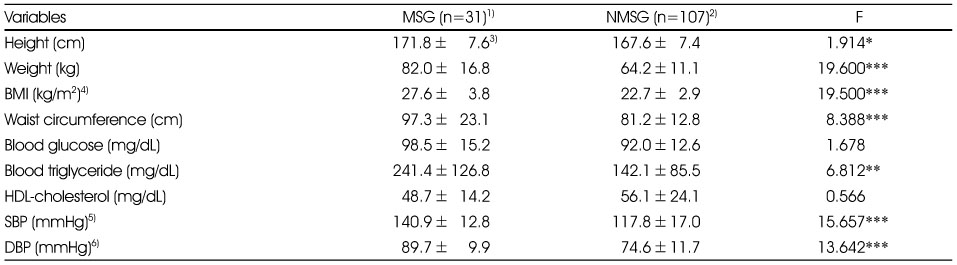
Comparison of anthropometric and serum profile and blood pressure of the study subjects between MSG and NMSG
1) MSG: metabolic syndrome group
2) NMSG: non-metabolic syndrome group
3) Values are Mean±SD
4) BMI: body mass index
5) SBP: systolic blood pressure
6) DBP: diastolic blood pressure
*: p < 0.05, ***: p < 0.001
Comparison of the lifestyle scores between MSG and NMSG
1) MSG: metabolic syndrome group
2) NMSG: non-metabolic syndrome group
3) Values are Mean±SD
*: p < 0.05, ***: p < 0.001
Odds ratios of binary model of metabolic syndrome
1) OR:odds ratio CI: confidence interval
**: p < 0.01
Comparisons of the nutrient intakes between MSG and NMSG
1) MSG: metabolic syndrome group
2) NMSG: non-metabolic syndrome group
3) %: % of total amount of each nutrient
4) Values are Mean±SD
5) SFA: saturated fatty acid
6) MUFA: monounsaturated fatty acids
7) PUFA: polyunsaturated fatty acids
*: p < 0.05
The percentage of three major nutrients contributing to energy between MSG and NMSG
1) MSG: metabolic syndrome group
2) NMSG: non-metabolic syndrome group
3) %: % of total amount of each nutrient
*: p < 0.05, **: p < 0.01, ***: p < 0.001
Percentage of metabolic syndrome occurrence affected by various factors
1) MS: metabolic syndrome
2) BMI: body mass index
3) N (%)
***: p < 0.001
Table 1
General characteristics of the study subjects
Table 2
Comparison of anthropometric and biochemical data of the study subjects
1) Mean±SD 2) BMI: body mass index 3) SBP: systolic blood pressure 4) DBP: diastolic blood pressure *: p < 0.05, ***: p < 0.001
Table 3
The numbers of metabolic syndrome risk factors of the study subjects
1) N (%) 2) MS: metabolic syndrome 3) NMS: non-metabolic syndrome *: p < 0.05
Table 4
Comparison of the general characteristics between MSG and NMSG
1) MSG: metabolic syndrome group 2) NMSG: non-metabolic syndrome group 3) N (%) **: p < 0.01, ***: p < 0.001
Table 5
Comparison of anthropometric and serum profile and blood pressure of the study subjects between MSG and NMSG
1) MSG: metabolic syndrome group 2) NMSG: non-metabolic syndrome group 3) Values are Mean±SD 4) BMI: body mass index 5) SBP: systolic blood pressure 6) DBP: diastolic blood pressure *: p < 0.05, ***: p < 0.001
Table 6
Comparison of the lifestyle scores between MSG and NMSG
1) MSG: metabolic syndrome group 2) NMSG: non-metabolic syndrome group 3) Values are Mean±SD *: p < 0.05, ***: p < 0.001
Table 7
Odds ratios of binary model of metabolic syndrome
1) OR:odds ratio CI: confidence interval **: p < 0.01
Table 8
Comparisons of the nutrient intakes between MSG and NMSG
1) MSG: metabolic syndrome group 2) NMSG: non-metabolic syndrome group 3) %: % of total amount of each nutrient 4) Values are Mean±SD 5) SFA: saturated fatty acid 6) MUFA: monounsaturated fatty acids 7) PUFA: polyunsaturated fatty acids *: p < 0.05
Table 9
The percentage of three major nutrients contributing to energy between MSG and NMSG
1) MSG: metabolic syndrome group 2) NMSG: non-metabolic syndrome group 3) %: % of total amount of each nutrient *: p < 0.05, **: p < 0.01, ***: p < 0.001
Table 10
Percentage of metabolic syndrome occurrence affected by various factors
1) MS: metabolic syndrome 2) BMI: body mass index 3) N (%) ***: p < 0.001


