
Articles
- Page Path
- HOME > Korean J Community Nutr > Volume 23(4); 2018 > Article
-
Research Article
- Salinity of Representative Korean Foods High in Sodium from Home Meals, Foodservices, and Restaurants
-
Lin Jiang, Damin Shin, Yeon-Kyung Lee

-
Korean Journal of Community Nutrition 2018;23(4):333-340.
DOI: https://doi.org/10.5720/kjcn.2018.23.4.333
Published online: August 31, 2018
Department of Food Science and Nutrition, Kyungpook National University, Daegu 41566, Korea.
- Corresponding author: Yeon-Kyung Lee. Department of Food Science and Nutrition, Kyungpook National University, Daegu 41566, Korea. Tel: (053) 950-6234, Fax: (053) 950-6229, yklee@knu.ac.kr
• Received: July 5, 2018 • Revised: August 24, 2018 • Accepted: August 24, 2018
Copyright © 2018 The Korean Society of Community Nutrition
This is an Open-Access article distributed under the terms of the Creative Commons Attribution Non-Commercial License (http://creativecommons.org/licenses/by-nc/3.0/) which permits unrestricted non-commercial use, distribution, and reproduction in any medium, provided the original work is properly cited.
- 3,528 Views
- 10 Download
- 6 Crossref
Abstract
-
Objectives
- This study was conducted to analyze the salinity of representative Korean foods high in sodium to generate data for use as a fundamental resource for setting salinity standards in foods.
-
Methods
- A total of 480 foods from 16 representative Korean foods high in sodium were collected from 10 households, 10 industry foodservice establishments, and 10 Korean restaurants in four regions (Capital area, Chungcheong Province, Gyeongsang Province, and Jeolla Province) and analyzed for salinity.
-
Results
- Among the foods, stir-fried anchovies (4.07~4.45%) showed the highest salinity, followed by pickled onion (1.86~2.62%), cabbage kimchi (1.83~2.2%), braised burdock and lotus root (1.79~2.17%), and sliced radish kimchi (1.78~1.89%) (p<0.001). The salinity of kimchi from home meals (2.2%) was significantly higher than that of foodservice (1.83%) and restaurant (1.93%) kimchi (p<0.05). Salinity in each group of food was highest in kimchi (1.83~2.04%), followed by braised dishes (1.54~1.78%), steamed dishes (1.0~1.22%), stir-fried dishes (1.02~1.18%), and soup or stew (0.74~1.02%) (p<0.001). The salinity of soup and stew from restaurants (1.02%) was significantly higher than that of home meal (0.84%) and foodservice (0.74%) soup and stew.
-
Conclusions
- Determination of the salinity of representative Korean foods known to be high in sodium by eating place is expected to be useful to establishing guidelines for reduction of salinity.
Acknowledgments
Acknowledgments
- 1. Pietinen P. Estimating sodium intake from food consumption data. Ann Nutr Metab 1982; 26(2): 90-99.ArticlePubMed
- 2. Fregly MJ. Estimates of sodium and potassium intake. Ann Intern Med 1983; 98(5 part 2): 792-799.ArticlePubMed
- 3. Meneton P, Jeunemaitre X, Wardener HE, Mac Gregor GA. Links between dietary salt intake, renal salt handling, blood pressure, and cardiovascular diseases. Physiol Rev 2005; 85(2): 679-715.ArticlePubMed
- 4. Cook NR, Cutler JA, Obarzanek E, Buring JE, Rexrode KM, Kumanyika SK. Long term effects of dietary sodium reduction on cardiovascular disease outcomes: observational follow-up of the trials of hypertension prevention (TOHP). BMJ 2007; 334(7599): 885-893.ArticlePubMedPMC
- 5. Chobanian AV, Hill M. National heart, lung, and blood institute workshop on sodium and blood pressure: A critical review of current scientific evidence. Hypertension 2000; 35(4): 858-863.ArticlePubMed
- 6. de Wardner HE, MacGregor GA. Harmful effects of dietary salt in addition to hypertension. J Human Hypertens 2002; 16(4): 213-223.ArticlePDF
- 7. Tsugane S. Salt, salted food intake, and risk of gastric cancer: epidemiologic evidence. Cancer Sci 2005; 96(1): 1-6.ArticlePubMedPMC
- 8. Ministry of Health and Welfare, Korea Centers for Disease Control and Prevention. Korea Health Statistics 2016: Korea National Health and Nutrition Examination Survey (KNHANES VII-1). Sejong: Ministry of Health and Welfare; 2017.
- 9. Ministry of Health and Welfare, Korea Centers for Disease Control and Prevention. Korea Health Statistics 2012: Korea National Health and Nutrition Examination Survey (KNHANES VII-1). Sejong: Ministry of Health and Welfare; 2013.
- 10. Ministry of Food and Drug Safety. Only 8% of respondents knows recommended intake of sodium [Internet]. Ministry of Food and Drug Safety; 2010; cited 2016 Oct 22]. Available from: http://www.mfds.go.kr/brd/m_99/view.do?seq=13292.
- 11. Shin EK, Lee YK. Comparison of sodium content of workplace and homemade meals through chemical analysis and salinity measurements. Nutr Res Pract 2014; 8(5): 558-563.ArticlePubMedPMC
- 12. Kim JA, Kim YH, Ann MY, Lee YK. Measurements of salinity and salt content by menu types served at industry foodservice operations in Daegu. Korean J Community Nutr 2012; 17(5): 637-651.Article
- 13. Park S, Min SH. A study on eating out behavior and recognition of salinity in restaurant food in Jecheon area. J Korean Soc Food Culture 2015; 30(1): 20-28.Article
- 14. Lim HS, Ko YS, Shin D, Heo YR, Chung HJ, Chae IS. Sodium and potassium content of school meals for elementary and junior high school students in Daegu, Masan, Gwangju, and Jeju. Korean Soc Food Sci Nutr 2013; 42(8): 1303-1317.Article
- 15. Lee HJ, Lee CH, Lee KS, Jung YJ, Ha SH, Jung YY. Survey on sodium contents in meals of school foodservice and sodium intakes of students in Busan and Gyeongsangbuk-do. Korean Soc Food Sci Nutr 2010; 39(1): 85-91.Article
- 16. Park HR, Jeong GO, Lee SL, Kim JY, Kang SA, Park KY. Workers intake too much salt from dishes of eating out and food service cafeterias; direct chemical analysis of sodium content. Nutr Res Pract 2009; 3(4): 328-333.ArticlePubMedPMC
- 17. Jang MR, Hong MS, Choi BC, Han SH, Lee KA, Kim LL. Contents of sodium and potassium for restaurant dishes in Seoul. J Food Hyg Saf 2015; 30(2): 189-195.Article
- 18. Jiang L, Lee YK. Analysis of sodium content of representative Korean foods high in sodium from home meal, foodservice, and restaurants. J Nutr Health 2017; 50(6): 655-663.ArticleLink
- 19. Korea Centers for Disease Control and Prevention. Salt intake is still high in Korea [Internet]. Korea Centers for Disease Control and Prevention 2012. cited 2016 Oct 22]. Available from: http://www.cdc.go.kr/CDC/notice/CdcKrIntro0201.jsp?menuIds=HOME006-MNU2804-MNU2937&cid=19415.
- 20. Lee KJ, Song MR. Salinity of Kimchi and soups/stews, and the acceptability and attitudes of restaurant owners toward salt in the Jeonju area. J Soc Food Culture 2009; 24(3): 279-285.
- 21. Song MR, Lee KJ. Salinity and consumption patterns of Kimchi and soup·stew in Jeonju area. J Food Cookery Sci 2008; 24(1): 84-91.
- 22. Han X. Evaluation on the effects of the education for sodium reduction of restaurants in Daegu and analysis of sodium content in target menus. [master's thersis]. Kyungpook National University; 2017.
- 23. Lee HS. Studies on salt intake through eat-out foods in Andong area. Korean J Soc Food Sci 1997; 13(3): 314-318.
- 24. Park SY, Lee KA. Study on the salt and sodium content of middle school lunch meals in Gyeongsangbuk-do area: focus on application of ‘SamSam Foodservice’. J Korean Soc Food Sci Nutr 2016; 45(5): 757-764.Article
- 25. Son SM, Park YS, Lim HJ, Kim SB, Jeong YS. Sodium intakes of Korean adults with 24-hour urine analysis and dish frequency questionnaire and comparison of sodium intakes according to the regional area and dish group. Korean J Community Nutr 2007; 12(5): 545-558.
- 26. Moon GS, Son YS, Jeon YS. A study of famous traditional Kimchi in Pusan and near Pusan area. Korean J Soc Food Sci 1996; 12(1): 74-81.
- 27. Song DY, Park JE, Shim JE, Lee JE. Trends in the major dish groups and food groups contributing to sodium intake in the Korea National Health and Nutrition Examination Survey 1998- 2010. Korean J Nutr 2013; 46(1): 72-85.Article
- 28. Ministry of Food and Drug Safety. Choose the sodium reduced foods in restaurant and foodservice [Internet]. Ministry of Food and Drug Safety. 2014; cited 2016 Dec 26]. Available from: http://www.mfds.go.kr/index.do?mid=675&seq=26007&cmd=v.
REFERENCES
Table 1
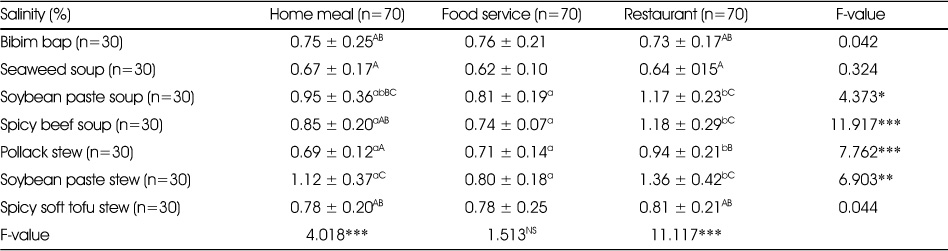
Salinity of representative Korean one-dish meal and soup?stew high in sodium by eating place
Mean ± SD.
*: p<0.05, **: p<0.01, ***: P<0.001 by ANOVA
abc: Values with the different small letter superscript are significantly different among row by Duncan's multiple range test at p<0.05.
ABC: Values with the different capital letter superscript are significantly different among column by Duncan's multiple range test at p<0.05.
Table 2
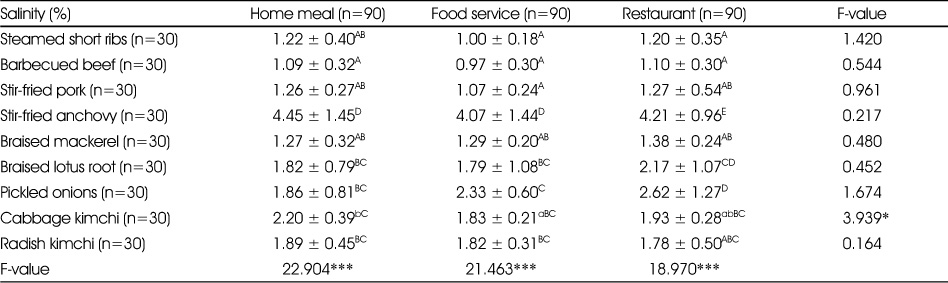
Salinity of representative Korean side dishes high in sodium by eating place
Mean ± SD.
*: p<0.05, **: p<0.01, ***: P<0.001 by ANOVA
abc: Values with the different small letter superscript are significantly different among row by Duncan's multiple range test at p<0.05.
ABC: Values with the different capital letter superscript are significantly different among column by Duncan's multiple range test at p<0.05.
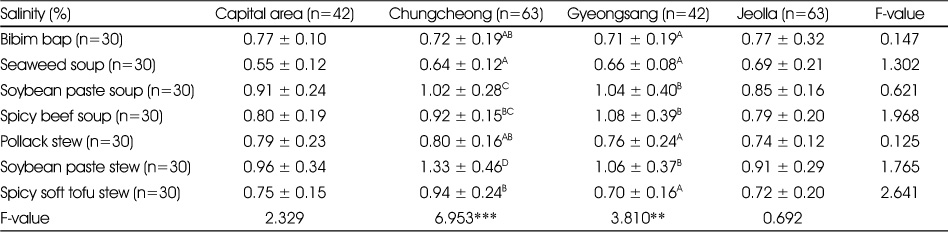
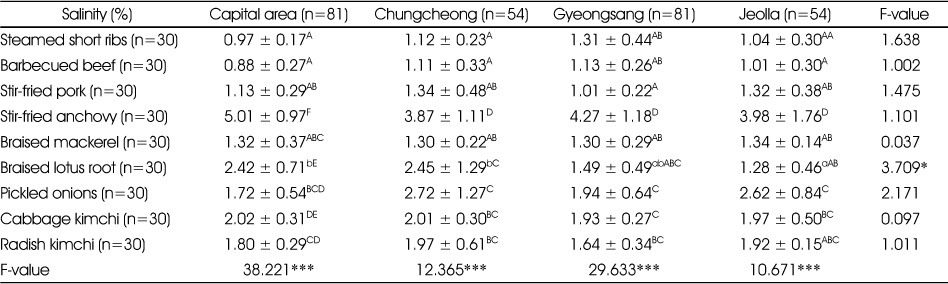
Table 5
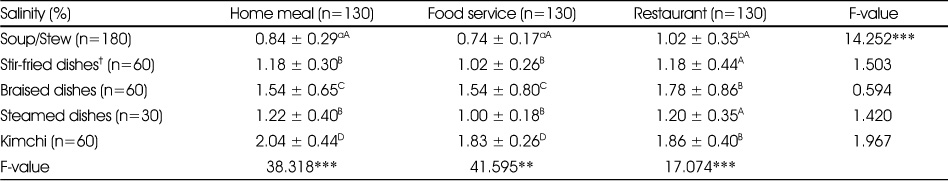
Salinity of dish groups by eating place
Mean ± SD.
*: p<0.05, ***: P<0.001 by ANOVA
abc: Values with the different small letter superscript are significantly different among row by Duncan's multiple range test at p<0.05.
ABC: Values with the different capital letter superscript are significantly different among column by Duncan's multiple range test at p<0.05.
†: Stir-fried anchovy is not included in stir-fired dishes.
Table 6
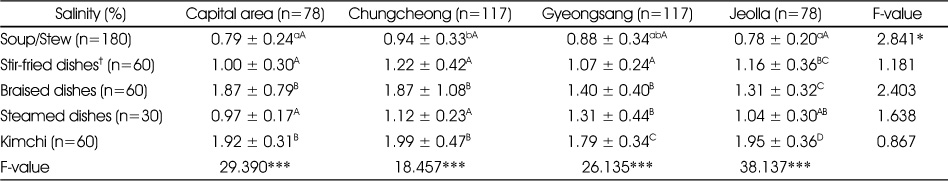
Salinity of dish groups by region
Mean ± SD.
*: p<0.05, **: p<0.01, ***: P<0.001 by ANOVA
abc: Values with the different superscript are significantly different among row by Duncan's multiple range test at p<0.05.
ABC: Values with the different superscript are significantly different among column by Duncan's multiple range test at p<0.05.
†: Stir-fried anchovy is not included in stir-fired dishes
Figure & Data
REFERENCES
Citations
Citations to this article as recorded by 
- Co-occurrence network and pattern of school lunch using big data and text-mining using data from the 2021–2023 school meal menu information on the NEIS open educational information portal: an exploratory study
Hyeyun Kang, Jimi Kim
Korean Journal of Community Nutrition.2024; 29(6): 514. CrossRef - A Literature Review Study on Chronic Changes in Yukgaejang
Soon-Ah Choi, Bokyung Ryu, Lana Chung
Journal of the East Asian Society of Dietary Life.2020; 30(1): 1. CrossRef - Sodium Reduction Practice and Importance-Performance Analysis of Sodium Reduction Methods in School Foodservice in Daegu
Su-Hyeon Kim, Eun-Kyung Shin, Yeon-Kyung Lee
Korean Journal of Community Nutrition.2020; 25(5): 386. CrossRef - Comparison of the portion sizes of Korean adults across eating places: Korea National Health and Nutrition Examination Survey (2012–2016)
Hye-Sook Hong, Seon-Joo Park, Do-Kyung Lee, Hae-Jeung Lee
Journal of Nutrition and Health.2020; 53(6): 676. CrossRef - Development of standards for reducing the sodium content and salinity of Korean fermented soybean sauces and representative Korean foods high in sodium
Lin Jiang, Eun-Kyung Shin, Jung-Sook Seo, Yeon-Kyung Lee
Journal of Nutrition and Health.2019; 52(2): 185. CrossRef - Current status, perception and practicability of restaurant staffs related to reducing sodium use in Seongnam, Korea
So-Hyun Ahn, Jong Sook Kwon, Kyungmin Kim, Yoonna Lee, Hye-Kyeong Kim
Journal of Nutrition and Health.2019; 52(5): 475. CrossRef
 Cite
CiteSalinity of Representative Korean Foods High in Sodium from Home Meals, Foodservices, and Restaurants
Salinity of Representative Korean Foods High in Sodium from Home Meals, Foodservices, and Restaurants
Salinity of representative Korean one-dish meal and soup?stew high in sodium by eating place
Mean ± SD.
*: p<0.05, **: p<0.01, ***: P<0.001 by ANOVA
abc: Values with the different small letter superscript are significantly different among row by Duncan's multiple range test at p<0.05.
ABC: Values with the different capital letter superscript are significantly different among column by Duncan's multiple range test at p<0.05.
Salinity of representative Korean side dishes high in sodium by eating place
Mean ± SD.
*: p<0.05, **: p<0.01, ***: P<0.001 by ANOVA
abc: Values with the different small letter superscript are significantly different among row by Duncan's multiple range test at p<0.05.
ABC: Values with the different capital letter superscript are significantly different among column by Duncan's multiple range test at p<0.05.
Salinity of one-dish meal and soup/stew by region
Mean ± SD.
*: p<0.05, ***: P<0.001 by ANOVA
abc: Values with the different superscript are significantly different among row by Duncan's multiple range test at p<0.05.
ABC: Values with the different superscript are significantly different among column by Duncan's multiple range test at p<0.05.
Salinity of salted foods by region
Mean ± SD.
*: p<0.05, ***: P<0.001 by ANOVA
abc: Values with the different superscript are significantly different among row by Duncan's multiple range test at p<0.05.
ABC: Values with the different superscript are significantly different among column by Duncan's multiple range test at p<0.05.
Salinity of dish groups by eating place
Mean ± SD.
*: p<0.05, ***: P<0.001 by ANOVA
abc: Values with the different small letter superscript are significantly different among row by Duncan's multiple range test at p<0.05.
ABC: Values with the different capital letter superscript are significantly different among column by Duncan's multiple range test at p<0.05.
†: Stir-fried anchovy is not included in stir-fired dishes.
Salinity of dish groups by region
Mean ± SD.
*: p<0.05, **: p<0.01, ***: P<0.001 by ANOVA
abc: Values with the different superscript are significantly different among row by Duncan's multiple range test at p<0.05.
ABC: Values with the different superscript are significantly different among column by Duncan's multiple range test at p<0.05.
†: Stir-fried anchovy is not included in stir-fired dishes
Table 1
Salinity of representative Korean one-dish meal and soup?stew high in sodium by eating place
Mean ± SD. *: p<0.05, **: p<0.01, ***: P<0.001 by ANOVA abc: Values with the different small letter superscript are significantly different among row by Duncan's multiple range test at p<0.05. ABC: Values with the different capital letter superscript are significantly different among column by Duncan's multiple range test at p<0.05.
Table 2
Salinity of representative Korean side dishes high in sodium by eating place
Mean ± SD. *: p<0.05, **: p<0.01, ***: P<0.001 by ANOVA abc: Values with the different small letter superscript are significantly different among row by Duncan's multiple range test at p<0.05. ABC: Values with the different capital letter superscript are significantly different among column by Duncan's multiple range test at p<0.05.
Table 3
Salinity of one-dish meal and soup/stew by region
Mean ± SD. *: p<0.05, ***: P<0.001 by ANOVA abc: Values with the different superscript are significantly different among row by Duncan's multiple range test at p<0.05. ABC: Values with the different superscript are significantly different among column by Duncan's multiple range test at p<0.05.
Table 4
Salinity of salted foods by region
Mean ± SD. *: p<0.05, ***: P<0.001 by ANOVA abc: Values with the different superscript are significantly different among row by Duncan's multiple range test at p<0.05. ABC: Values with the different superscript are significantly different among column by Duncan's multiple range test at p<0.05.
Table 5
Salinity of dish groups by eating place
Mean ± SD. *: p<0.05, ***: P<0.001 by ANOVA abc: Values with the different small letter superscript are significantly different among row by Duncan's multiple range test at p<0.05. ABC: Values with the different capital letter superscript are significantly different among column by Duncan's multiple range test at p<0.05. †: Stir-fried anchovy is not included in stir-fired dishes.
Table 6
Salinity of dish groups by region
Mean ± SD. *: p<0.05, **: p<0.01, ***: P<0.001 by ANOVA abc: Values with the different superscript are significantly different among row by Duncan's multiple range test at p<0.05. ABC: Values with the different superscript are significantly different among column by Duncan's multiple range test at p<0.05. †: Stir-fried anchovy is not included in stir-fired dishes


