
Articles
- Page Path
- HOME > Korean J Community Nutr > Volume 16(6); 2011 > Article
-
Original Article
- Diet Quality and Food Patterns of Obese Adult Women from Low Income Classes: Based on 2005 KNHANES
- Jin-Sook Yoon, Heekyung Jang
-
Korean Journal of Community Nutrition 2011;16(6):706-715.
DOI: https://doi.org/10.5720/kjcn.2011.16.6.706
Published online: December 31, 2011
Department of Food and Nutrition, Keimyung University, Daegu, Korea.
- Corresponding author: Jin-Sook Yoon, Department of Food and Nutrition, Keimyung University, 1000 Sindang-dong, Dalseo-gu, Daegu 704-701, Korea. Tel: (053) 580-5873, Fax: (053) 580-5885, jsook@kmu.ac.kr
• Received: October 22, 2011 • Revised: October 26, 2011 • Accepted: October 28, 2011
Copyright © 2011 The Korean Society of Community Nutrition
- 467 Views
- 1 Download
- 11 Crossref
Abstract
- This study aims to identify the dietary patterns relevant to obesity of Korean women among low income classes. Adults 20-64 years were used as study subjects from the data of 2005 Korea National Health and Nutrition Examination Survey. We compared obese and normal-weight women in terms of their nutrients intake, diet quality and food patterns. Diet quality was assessed by using the Nutritional Adequacy Ratio (NAR) and Index of Nutritional Quality (INQ). Our results showed higher prevalence of obesity among lower socioeconomic status women. In men, there were no significant associations with socioeconomic status and prevalence of obesity. Higher risk of nutritional inadequacy was observed among obese women compared to normal weight women. Obese women showed significantly lower INQ for nutrients such as Ca, Fe, Vitamin A, Thiamin, Riboflavin and Vitamin C compared to other women. They consumed significantly higher amount of rice (p < 0.05) and lower amount of vegetables (p < 0.01). By contrast, obese men from low income classes showed higher intake of those nutrients. Obese men also consumed significantly higher amount of meats than normal weight men. Therefore, this study suggests that genderspecific approaches based on economic situation should be considered in developing the intervention program for managing obesity for low income classes.
-
This research was supported by 2007 research grant of Korea Research Foundation (KRF-2007-531-C00065)
NOTES
- 1. Bandini LG, Schoeller DA, Cyr HN, Dietz WH. Validity of reported energy intake in obese and nonobese adolescents. Am J Clin Nutr. 1990; 52: 421-425.ArticlePubMed
- 2. Chang MW, Baumann LC, Nitzke S, Brown RL. Predictors of fat intake behavior differ between normal-weight and obese WIC mothers. Am J Health Promot. 2005; 19(4): 269-277.ArticlePubMedPDF
- 3. Darmon N, Briend A, Drewnowski A. Energy-dense diets are associated with lower diet costs: a community study of French adults. Public Health Nutr. 2004; 7(1): 21-27.ArticlePubMed
- 4. Drewnowski A, Specter SE. Poverty and obesity : the role of energy density and energy cost. Am J Clin Nutr. 2004; 79(1): 6-16.PubMed
- 5. Drewnowski A, Darmon N. Food choices and diet costs : an economic analysis. J Nutr. 2005; 135(4): 900-904.ArticlePubMed
- 6. Epstein LH, Dearing KK, Paluch RA, Roemmich JN, Cho D. Price and maternal obesity influence purchasing of low- and high-energy-dense foods. Am J Clin Nutr. 2007; 86(4): 914-922.ArticlePubMed
- 7. Kim BR, Han YB, Chang UJ. A study on the attitude toward control, diet behavior and food habits of college students. Korean J Community Nutr. 1997; 2(4): 530-538.
- 8. Kim EK, Lee JS, Hong HO, Yu CH. Association between Glycemic Index, Glycemic Load, Dietary Carbohydrates and Diabetes from Korean National Health and Nutrition Examination Survey 2005. Korean J Nutr. 2009; 42(7): 622-630.Article
- 9. Kinsey JD. Food and families socioeconomic status. J Nutr. 1994; 124(9 Suppl): 1878S-1885S.ArticlePubMed
- 10. Korea Centers for Disease Control and Prevention. Korea Health Industry Development Institute. In-depth analysis on the 3rd Korea Health and Nutrition Examination Survey: Nutrition Survey. 2007.
- 11. Ledikwe JH, Blanck HM, Khan LK, Serdula MK, Seymour JD, Tohill BC, Rolls BJ. Low-energy-density diets are associated with high diet quality in adults in the United States. J Am Diet Assoc. 2006; 106(8): 1172-1180.ArticlePubMed
- 12. Lee SM. Association of whole grain consumption with sociodemographic and eating behavior factors in a Korean population: Based on 2007-2008 Korea National Health and Nutrition Examination Survey. Korean J Community Nutr. 2011; 16(3): 353-363.Article
- 13. Lee Y, Lee HS, Jang YA, Lee HJ, Kim BH, Kim CI. Dietary intake pattern of Korean adult population by weight status - 2001 National Health and Nutrition Survey. Korean J Community Nutr. 2006; 11(3): 317-326.
- 14. Marín-Guerrero AC, Gutiérrez-Fisac JL, Guallar-Castillón P, Banegas JR, Rodríguez-Artalejo F. Eating behaviours and obesity in the adult population of Spain. Br J Nutr. 2008; 100(5): 1142-1148.ArticlePubMed
- 15. Moon HK, Kong JE. Assessment of nutrient intake for middle aged with and without metabolic syndrome using 2005 and 2007 Korean National Health and Nutrition Survey. Korean J Nutr. 2010; 43(1): 69-78.Article
- 16. Park JA, Yoon JS. Dietary behaviors and status of nutrient intakes by the obesity levels of housewives in Daegu. Korean J Community Nutr. 2005; 10: 623-632.
- 17. Phillips SM, Bandini LG, Naumova EN, Cyr H, Colclough S, Dietz WH, Must A. Energy-dense snack food intake in adolescence: longitudinal relationship to weight and fatness. Obes Res. 2004; 12(3): 461-472.ArticlePubMed
- 18. Robinson WR, Gordon-Larsen P, Kaufman JS, Suchindran CM, Stevens J. The female-male disparity in obesity prevalence among black American young adults: contributions of sociodemographic characteristics of the childhood family. Am J Clin Nutr. 2009; 89(4): 1204-1212.ArticlePubMedPMC
- 19. Song YJ, Paik HY, Joung HJ. A comparison of cluster and factor analysis to derive dietary patterns in Korean adults using data from the 2005 Korea National Health and Nutrition Examination Survey. Korean J Community Nutr. 2009; 14(6): 722-733.
- 20. St Jeor ST, Perumean-Chaney S, Sigman-Grant M, Williams C, Foreyt J. Family-based interventions for the treatment of childhood obesity. J Am Diet Assoc. 2002; 102(5): 640-644.ArticlePubMed
- 21. Stolley MR, Fitzgibbon ML. Effects of an obesity prevention program on the eating behavior of African American mothers and daughters. Health Educ Behav. 1997; 24(2): 152-164.ArticlePubMedPDF
- 22. Townsend MS, Aaron GJ, Monsivais P, Keim NL, Drewnowski A. Less-energy-dense diets of low-income women in California are associated with higher energy-adjusted diet costs. Am J Clin Nutr. 2009; 89(4): 1220-1226.ArticlePubMed
- 23. Wamala SP, Wolk A, Schenck-Gustafsson K, Orth-Gomer K. Lipid profile and socioeconomic status in healthy middle aged women in Sweden. J Epidemiol Community Health. 1997; 51(4): 400-407.ArticlePubMedPMC
- 24. WHO. Obesity. Report of WHO Consultation of obesity. 1997.
- 25. Won HR. A study of the relationship between the eating attitude influenced by eating Disorder and body shape, nutritional knowledge among female college students in Won Ju province. Korean J Community Nutr. 1998; 3(2): 308-316.
- 26. Woo J, Cheung B, Ho S, Sham A, Lam TH. Influence of dietary pattern on the development of overweight in a Chinese population. Eur J Clin Nutr. 2008; 62(4): 480-487.ArticlePubMedPDF
REFERENCES


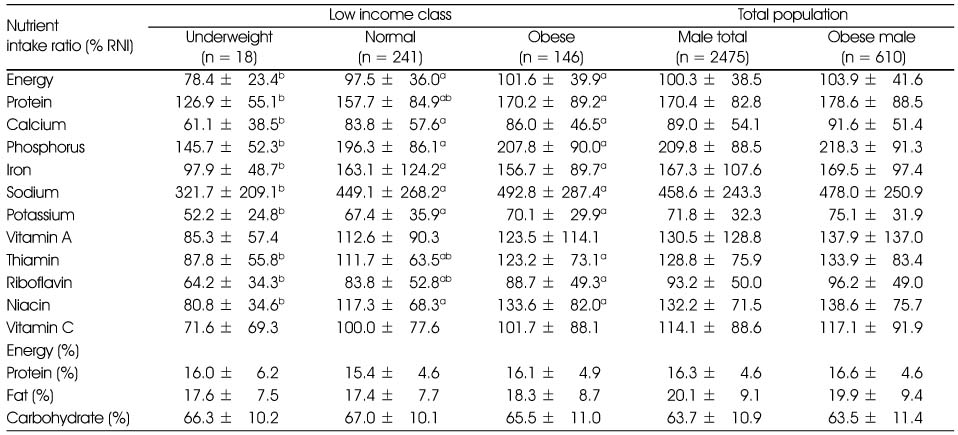


Figure & Data
REFERENCES
Citations
Citations to this article as recorded by 
- Food insecurity and adult weight abnormality risk: a systematic review and meta-analysis
Sajjad Moradi, Atieh Mirzababaei, Alireza Dadfarma, Shahabeddin Rezaei, Hamed Mohammadi, Behrooz Jannat, Khadijeh Mirzaei
European Journal of Nutrition.2019; 58(1): 45. CrossRef - Effects of a Self-Care Reinforcement Program for Socially Vulnerable Elderly Women with Metabolic Syndrome in Korea
Mikyung Park, Kiwol Sung
Journal of Korean Academy of Community Health Nursing.2019; 30(3): 271. CrossRef - Eating frequency is inversely associated with BMI, waist circumference and the proportion of body fat in Korean adults when diet quality is high, but not when it is low: analysis of the Fourth Korea National Health and Nutrition Examination Survey (KNHANE
Sunmi Kim, Jeong Hee Yang, Gyeong-Hun Park
British Journal of Nutrition.2018; 119(8): 918. CrossRef - A Comparative Study of Taste Preference, Food Consumption Frequency, and Nutrition Intake between the Elderly in Their 80's Living in Long Life Regions in Jeollanam-do and a Part of Seoul
Soon-Sil Chun, Eunju Yoon
The Korean Journal of Food And Nutrition.2016; 29(1): 115. CrossRef - Evaluation of Obesity and Nutritional Status by Age among Low-income Women aged over 20 -Using Data from the Fourth Korea National Health and Nutrition Examination Survey-
Hee-Kyung Jang
Journal of the East Asian Society of Dietary Life.2015; 25(2): 246. CrossRef - A study on nutritional intakes in middle income adults based on data from the 5thKorean National Health and Nutrition Examination Survey
Ji-Myung Kim, Hye Sook Kim, Ki Nam Kim
Journal of Nutrition and Health.2015; 48(4): 364. CrossRef - Major Foods and Nutrient Intake Quality According to Body Image Perception among Korean Women: Based on the 2010 Korea National Health and Nutrition Examination Survey Data
Young Suk Lim, Soo Bin Jeon, Hee Mang Kim, So Yeon Jeong, Jae Young Ahn, Hae Ryun Park
Journal of the Korean Dietetic Association.2015; 21(2): 154. CrossRef - Associations between food insecurity and healthy behaviors among Korean adults
In-Ae Chun, So-Yeon Ryu, Jong Park, Hee-Kyung Ro, Mi-Ah Han
Nutrition Research and Practice.2015; 9(4): 425. CrossRef - An Evaluation of Dietary Habit and Nutritional Status by Household Income in Female Adults over the Age of 20 - Using Data from the Fourth Korea National Health and Nutrition Examination Survey -
Hee-Kyung Jang
The Korean Journal of Food And Nutrition.2014; 27(4): 660. CrossRef - Calcium Status and Bone Mineral Density by the Level of Sodium Intake in Young Women
Jin-Sook Yoon, Mi Jung Lee
Korean Journal of Community Nutrition.2013; 18(2): 125. CrossRef - A Study on the Health and Nutritional Characteristics according to Household Income and Obesity in Korean Adults Aged over 50 -Based on 2005 KNHANES-
So Hyun Ahn, Sook Mee Son, Hye Kyeong Kim
Korean Journal of Community Nutrition.2012; 17(4): 463. CrossRef
 PubReader
 Cite
CiteDiet Quality and Food Patterns of Obese Adult Women from Low Income Classes: Based on 2005 KNHANES

Fig. 1
Obesity prevalence by gender and socio-economic status.
Fig. 1
Diet Quality and Food Patterns of Obese Adult Women from Low Income Classes: Based on 2005 KNHANES
Comparison of obesity prevalence among Low income classes by age and gender
n (%)
Nutrients intake of female subjects from low income classes
RNI : Recommended Nutrient Intake
Values are Mean ± SD
Values with different superscripts in the same row are significantly different by Duncan test
Nutrients intake of male subjects from low income classes
RNI : Recommended Nutrient Intake
Values are Mean ± SD
Values with different superscripts in the same row are significantly different by Duncan test
Comparison of Nutrient Adequacy Ratio and Mean Adequacy Ratio by gender and obesity
Values are Mean ± SD, 1) NAR : Nutrient Adequacy Ratio, 2) MAR: Mean Adequacy Ratio
Values with different superscripts in the same row are significantly different by Duncan test
Comparison of Index of Nutrition Quality by gender and obesity
Values are Mean ± SD, INQ : Index of Nutrition Quality
Values with different superscripts in the same row are significantly different by Duncan test
Food intake patterns of female subjects from low income classes
Values are Mean ± SD
Food intake patterns of male subjects from low income classes
Values are Mean ± SD
Food intake of 16 food groups in female subjects
Values are Mean ± SD
Food intake of 16 food groups in male subjects
Values are Mean ± SD
Table 1
Comparison of obesity prevalence among Low income classes by age and gender
n (%)
Table 2
Nutrients intake of female subjects from low income classes
RNI : Recommended Nutrient Intake Values are Mean ± SD Values with different superscripts in the same row are significantly different by Duncan test
Table 3
Nutrients intake of male subjects from low income classes
RNI : Recommended Nutrient Intake Values are Mean ± SD Values with different superscripts in the same row are significantly different by Duncan test
Table 4
Comparison of Nutrient Adequacy Ratio and Mean Adequacy Ratio by gender and obesity
Values are Mean ± SD, 1) NAR : Nutrient Adequacy Ratio, 2) MAR: Mean Adequacy Ratio Values with different superscripts in the same row are significantly different by Duncan test
Table 5
Comparison of Index of Nutrition Quality by gender and obesity
Values are Mean ± SD, INQ : Index of Nutrition Quality Values with different superscripts in the same row are significantly different by Duncan test
Table 6
Food intake patterns of female subjects from low income classes
Values are Mean ± SD
Table 7
Food intake patterns of male subjects from low income classes
Values are Mean ± SD
Table 8
Food intake of 16 food groups in female subjects
Values are Mean ± SD
Table 9
Food intake of 16 food groups in male subjects
Values are Mean ± SD


