
Articles
- Page Path
- HOME > Korean J Community Nutr > Volume 16(6); 2011 > Article
-
Original Article
- Diet Quality and Food Patterns of Obese Adult Women from Low Income Classes: Based on 2005 KNHANES
- Jin-Sook Yoon, Heekyung Jang
-
Korean Journal of Community Nutrition 2011;16(6):706-715.
DOI: https://doi.org/10.5720/kjcn.2011.16.6.706
Published online: December 31, 2011
Department of Food and Nutrition, Keimyung University, Daegu, Korea.
- Corresponding author: Jin-Sook Yoon, Department of Food and Nutrition, Keimyung University, 1000 Sindang-dong, Dalseo-gu, Daegu 704-701, Korea. Tel: (053) 580-5873, Fax: (053) 580-5885, jsook@kmu.ac.kr
• Received: October 22, 2011 • Revised: October 26, 2011 • Accepted: October 28, 2011
Copyright © 2011 The Korean Society of Community Nutrition
- 1,793 Views
- 4 Download
- 12 Crossref


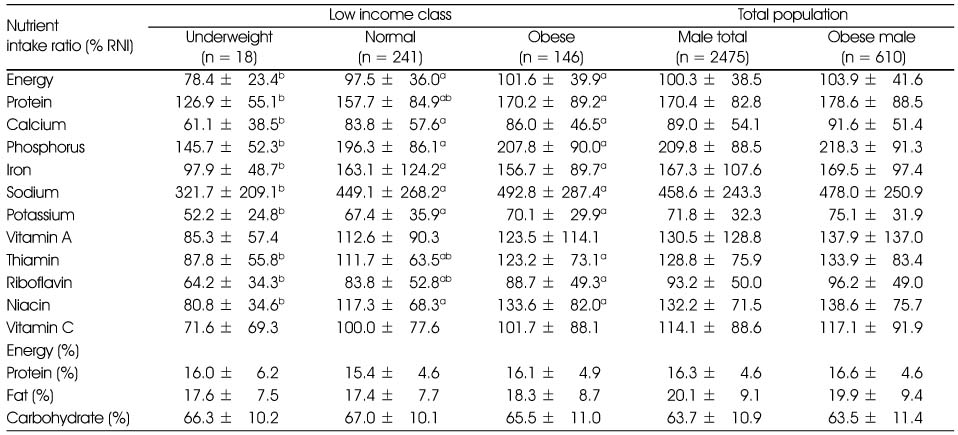


Figure & Data
REFERENCES
Citations
Citations to this article as recorded by 
- Evaluation of a health promotion program based on Community-based Participatory Research for older adults at risk for metabolic syndrome: a mixed methods study
Juhyeon Yang, Bohyun Park
BMC Public Health.2025;[Epub] CrossRef - Food insecurity and adult weight abnormality risk: a systematic review and meta-analysis
Sajjad Moradi, Atieh Mirzababaei, Alireza Dadfarma, Shahabeddin Rezaei, Hamed Mohammadi, Behrooz Jannat, Khadijeh Mirzaei
European Journal of Nutrition.2019; 58(1): 45. CrossRef - Effects of a Self-Care Reinforcement Program for Socially Vulnerable Elderly Women with Metabolic Syndrome in Korea
Mikyung Park, Kiwol Sung
Journal of Korean Academy of Community Health Nursing.2019; 30(3): 271. CrossRef - Eating frequency is inversely associated with BMI, waist circumference and the proportion of body fat in Korean adults when diet quality is high, but not when it is low: analysis of the Fourth Korea National Health and Nutrition Examination Survey (KNHANE
Sunmi Kim, Jeong Hee Yang, Gyeong-Hun Park
British Journal of Nutrition.2018; 119(8): 918. CrossRef - A Comparative Study of Taste Preference, Food Consumption Frequency, and Nutrition Intake between the Elderly in Their 80's Living in Long Life Regions in Jeollanam-do and a Part of Seoul
Soon-Sil Chun, Eunju Yoon
The Korean Journal of Food And Nutrition.2016; 29(1): 115. CrossRef - Evaluation of Obesity and Nutritional Status by Age among Low-income Women aged over 20 -Using Data from the Fourth Korea National Health and Nutrition Examination Survey-
Hee-Kyung Jang
Journal of the East Asian Society of Dietary Life.2015; 25(2): 246. CrossRef - A study on nutritional intakes in middle income adults based on data from the 5thKorean National Health and Nutrition Examination Survey
Ji-Myung Kim, Hye Sook Kim, Ki Nam Kim
Journal of Nutrition and Health.2015; 48(4): 364. CrossRef - Major Foods and Nutrient Intake Quality According to Body Image Perception among Korean Women: Based on the 2010 Korea National Health and Nutrition Examination Survey Data
Young Suk Lim, Soo Bin Jeon, Hee Mang Kim, So Yeon Jeong, Jae Young Ahn, Hae Ryun Park
Journal of the Korean Dietetic Association.2015; 21(2): 154. CrossRef - Associations between food insecurity and healthy behaviors among Korean adults
In-Ae Chun, So-Yeon Ryu, Jong Park, Hee-Kyung Ro, Mi-Ah Han
Nutrition Research and Practice.2015; 9(4): 425. CrossRef - An Evaluation of Dietary Habit and Nutritional Status by Household Income in Female Adults over the Age of 20 - Using Data from the Fourth Korea National Health and Nutrition Examination Survey -
Hee-Kyung Jang
The Korean Journal of Food And Nutrition.2014; 27(4): 660. CrossRef - Calcium Status and Bone Mineral Density by the Level of Sodium Intake in Young Women
Jin-Sook Yoon, Mi Jung Lee
Korean Journal of Community Nutrition.2013; 18(2): 125. CrossRef - A Study on the Health and Nutritional Characteristics according to Household Income and Obesity in Korean Adults Aged over 50 -Based on 2005 KNHANES-
So Hyun Ahn, Sook Mee Son, Hye Kyeong Kim
Korean Journal of Community Nutrition.2012; 17(4): 463. CrossRef
 Cite
CiteDiet Quality and Food Patterns of Obese Adult Women from Low Income Classes: Based on 2005 KNHANES

Fig. 1
Obesity prevalence by gender and socio-economic status.
Fig. 1
Diet Quality and Food Patterns of Obese Adult Women from Low Income Classes: Based on 2005 KNHANES
Comparison of obesity prevalence among Low income classes by age and gender
n (%)
Nutrients intake of female subjects from low income classes
RNI : Recommended Nutrient Intake
Values are Mean ± SD
Values with different superscripts in the same row are significantly different by Duncan test
Nutrients intake of male subjects from low income classes
RNI : Recommended Nutrient Intake
Values are Mean ± SD
Values with different superscripts in the same row are significantly different by Duncan test
Comparison of Nutrient Adequacy Ratio and Mean Adequacy Ratio by gender and obesity
Values are Mean ± SD, 1) NAR : Nutrient Adequacy Ratio, 2) MAR: Mean Adequacy Ratio
Values with different superscripts in the same row are significantly different by Duncan test
Comparison of Index of Nutrition Quality by gender and obesity
Values are Mean ± SD, INQ : Index of Nutrition Quality
Values with different superscripts in the same row are significantly different by Duncan test
Food intake patterns of female subjects from low income classes
Values are Mean ± SD
Food intake patterns of male subjects from low income classes
Values are Mean ± SD
Food intake of 16 food groups in female subjects
Values are Mean ± SD
Food intake of 16 food groups in male subjects
Values are Mean ± SD
Table 1
Comparison of obesity prevalence among Low income classes by age and gender
n (%)
Table 2
Nutrients intake of female subjects from low income classes
RNI : Recommended Nutrient Intake Values are Mean ± SD Values with different superscripts in the same row are significantly different by Duncan test
Table 3
Nutrients intake of male subjects from low income classes
RNI : Recommended Nutrient Intake Values are Mean ± SD Values with different superscripts in the same row are significantly different by Duncan test
Table 4
Comparison of Nutrient Adequacy Ratio and Mean Adequacy Ratio by gender and obesity
Values are Mean ± SD, 1) NAR : Nutrient Adequacy Ratio, 2) MAR: Mean Adequacy Ratio Values with different superscripts in the same row are significantly different by Duncan test
Table 5
Comparison of Index of Nutrition Quality by gender and obesity
Values are Mean ± SD, INQ : Index of Nutrition Quality Values with different superscripts in the same row are significantly different by Duncan test
Table 6
Food intake patterns of female subjects from low income classes
Values are Mean ± SD
Table 7
Food intake patterns of male subjects from low income classes
Values are Mean ± SD
Table 8
Food intake of 16 food groups in female subjects
Values are Mean ± SD
Table 9
Food intake of 16 food groups in male subjects
Values are Mean ± SD


