
Search
- Page Path
- HOME > Search
Research Articles
- [English]
- Understanding the drivers of continuance intention in online grocery shopping using technology continuance theory: a cross-national comparison
- Binglin Liu, Min A Lee
- Korean J Community Nutr 2026;31(1):50-63. Published online February 28, 2026
- DOI: https://doi.org/10.5720/kjcn.2026.00017
-
 Abstract
 PDF
PDF - Objectives
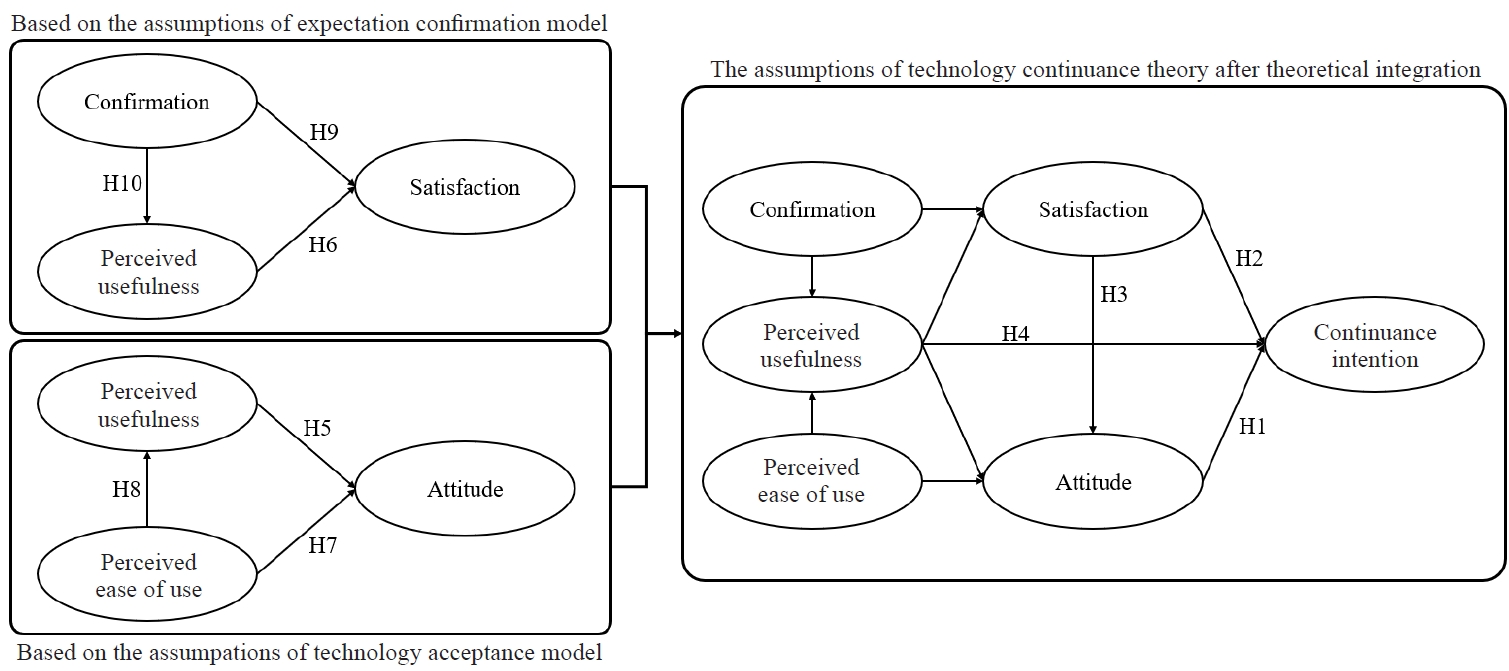
This study examined the determinants of consumers’ continuance intention (CI) toward online grocery shopping (OGS) across different country markets. Drawing on technology continuance theory (TCT), this study compared key drivers of CI in a different countries market.
Methods
Data were collected via online surveys from 638 OGS users in China (n = 338) and South Korea (n = 300) between November and December 2023. A TCT-based model incorporating satisfaction, attitude, perceived usefulness (PU), perceived ease of use, confirmation, and CI was tested using partial least squares structural equation modeling. Partial measurement invariance testing was conducted to ensure valid cross-national comparison.
Results
In South Korea, both satisfaction and attitude significantly predicted CI, with satisfaction exerting a particularly strong effect. In China, attitude was the primary determinant of CI, whereas satisfaction had minimal impact. Across both countries, PU consistently and positively influenced satisfaction and attitude, thereby indirectly enhancing CI. Partial measurement invariance was confirmed, validating comparisons of the model across contexts.
Conclusion
The findings suggest that the drivers of online grocery continuance differ by cross-national market. In Korean markets, strategies must enhance customer satisfaction (and its influence on attitude) to sustain OGS usage. In Chinese markets, fostering favorable consumer attitudes toward OGS is essential for promoting continued use. This cross-national analysis advances the theoretical understanding of continuance behavior while providing practical guidance for designing market-specific strategies to sustain online grocery engagement.
- 973 View
- 32 Download

- [Korean]
- [Republished study] Assessing Nutritional Status in Outpatients after Gastric Cancer Surgery: A Comparative Study of Five Nutritional Screening Tools
- Jae Won Cho, Jiyoung Youn, Min-Gew Choi, Mi Young Rha, Jung Eun Lee
- Korean J Community Nutr 2022;27(3):205-222. Published online June 30, 2022
- DOI: https://doi.org/10.5720/kjcn.2022.27.3.205
-
Abstract
PDF
- Objectives
This study examined the characteristics of patients according to nutritional status assessed by five nutritional screening tools: Patient-Generated Subjective Global Assessment (PG-SGA), NUTRISCORE, Nutritional Risk Index (NRI), Prognostic Nutritional Index (PNI), and Controlling Nutritional Status (CONUT) and to compare the agreement, sensitivity, and specificity of these tools.
Methods
A total of 952 gastric cancer patients who underwent gastrectomy and chemotherapy from January 2009 to December 2012 were included. The patients were categorized into malnutrition and normal status according to five nutritional screening tools one month after surgery. The Spearman partial correlation, Cohen’s Kappa coefficient, the area under the curve (AUC), sensitivity, and specificity of each two screening tools were calculated.
Results
Malnutrition was observed in 86.24% of patients based on the PG-SGA and 85.82% based on the NUTRISCORE. When NRI or CONUT were applied, the proportions of malnutrition were < 30%. Patients with malnutrition had lower intakes of energy and protein than normal patients when assessed using the PG-SGA, NUTRISCORE, or NRI. Lower levels of albumin, hemoglobin, total lymphocyte count, and total cholesterol and longer postoperative hospital stays were observed among patients with malnutrition compared to normal patients when NRI, PNI, or CONUT were applied. Relatively high agreement for NUTRISCORE relative to PG-SGA was found; the sensitivity was 90.86%, and the AUC was 0.78. When NRI, PNI, and CONUT were compared, the sensitivities were 23.72% for PNI relative to NRI, 44.53% for CONUT relative to NRI, and 90.91% for CONUT relative to PNI. The AUCs were 0.95 for NRI relative to PNI and 0.91 for CONUT relative to PNI.
Conclusions
NUTRISCORE had a high sensitivity compared to PG-SGA, and CONUT had a high sensitivity compared to PNI. NRI had a high specificity compared to PNI. This relatively high sensitivity and specificity resulted in 77.00% agreement between PNI and CONUT and 77.94% agreement between NRI and PNI. Further cohort studies will be needed to determine if the nutritional status assessed by PG-SGA, NUTRISCORE, NRI, PNI, and CONUT predicts the gastric cancer prognosis. -
Citations
Citations to this article as recorded by
- Report on the Current Trend of Commercial Enteral/Parenteral Nutrition in Outpatient
Hyun Ji Lee, Hyo Jung Park, Seon Young Chung, Myung Sook Min, Ok Soon Jeong, Ja Kyung Min
Journal of Korean Society of Health-System Pharmacists.2023; 40(2): 211. CrossRef
- Report on the Current Trend of Commercial Enteral/Parenteral Nutrition in Outpatient
- 1,938 View
- 36 Download
- 1 Crossref
- [Korean]
- Assessing Nutritional Status in Outpatients after Gastric Cancer Surgery : A Comparative Study of Five Nutritional Screening Tools
- Jae Won Cho, Jiyoung Youn, Min-Gew Choi, Mi Young Rha, Jung Eun Lee
- Korean J Community Nutr 2021;26(4):280-295. Published online August 31, 2021
- DOI: https://doi.org/10.5720/kjcn.2021.26.4.280
-
Abstract
PDF
- Objectives
This study aimed to examine the characteristics of patients according to their nutritional status as assessed by five nutritional screening tools: Patient-Generated Subjective Global Assessment (PG-SGA), NUTRISCORE, Nutritional Risk Index (NRI), Prognostic Nutritional Index (PNI), and Controlling Nutritional Status (CONUT) and to compare the agreement, sensitivity, and specificity of these tools. Methods: A total of 952 gastric cancer patients who underwent gastrectomy and chemotherapy from January 2009 to December 2012 at the Samsung Medical Center were included. We categorized patients into malnourished and normal according to the five nutritional screening tools 1 month after surgery and compared their characteristics. We also calculated the Spearman partial correlation, Cohen’s Kappa coefficient, the area under the curve (AUC), sensitivity, and specificity of each pair of screening tools. Results: We observed 86.24% malnutrition based on the PG-SGA and 85.82% based on the NUTRISCORE among gastric cancer patients in our study. When we applied NRI or CONUT, however, the malnutrition levels were less than 30%. Patients with malnutrition as assessed by the PG-SGA, NUTRISCORE, or NRI had lower intakes of energy and protein compared to normal patients. When NRI, PNI, or CONUT were used to identify malnutrition, lower levels of albumin, hemoglobin, total lymphocyte count, total cholesterol, and longer postoperative hospital stays were observed among patients with malnutrition compared to those without malnutrition. We found relatively high agreement between PG-SGA and NUTRISCORE; sensitivity was 90.86% and AUC was 0.78. When we compared NRI and PNI, sensitivity was 99.64% and AUC was 0.97. AUC ranged from 0.50 to 0.67 for comparisons between CONUT and each of the other nutritional screening tools. Conclusions: Our study suggests that PG-SGA and NRI have a relatively high agreement with the NUTRISCORE and PNI, respectively. Further cohort studies are needed to examine whether the nutritional status assessed by PG-SGA, NUTRISCORE, NRI, PNI, and CONUT predicts the gastric cancer prognosis. -
Citations
Citations to this article as recorded by- The Use of a Nutritional Risk Index to Predict Severe Postoperative Complications After Major Gastrointestinal Surgery: A Prospective Observational Study
Praveen K N, Bharath Kumar Bhat, Shailendra Lalwani, Samiran Nundy
Indian Journal of Surgery.2026;[Epub] CrossRef - Effects of Continuous Nutrition Care on Nutritional Status and Dietary Habits of Patients With Colorectal Cancer Receiving Adjuvant Chemotherapy After Surgery
Jina Son, Ha I Kang, Eun young Jung, Hae won Ryu, Kyung-Ha Lee
Clinical Nutrition Research.2023; 12(2): 99. CrossRef
- The Use of a Nutritional Risk Index to Predict Severe Postoperative Complications After Major Gastrointestinal Surgery: A Prospective Observational Study
- 2,026 View
- 23 Download
- 2 Crossref
Original Articles
- [English]
- Comparison of 24-hour Recalls with a Food Frequency Questionnaire in Assessing Coffee Consumption: The Health Examinees (HEXA) Study
- An Na Kim, Jiyoung Youn, Hyun Jeong Cho, Taiyue Jin, Sangah Shin, Jung Eun Lee
- Korean J Community Nutr 2020;25(1):48-60. Published online February 29, 2020
- DOI: https://doi.org/10.5720/kjcn.2020.25.1.48
-
Abstract
PDF
- OBJECTIVES
Most cohort studies used food frequency questionnaires (FFQ) to evaluate coffee consumption as it assesses habitual dietary patterns, whereas some studies have used the 24-hour recalls (24HR) as it elicits in-depth description of foods and the amount eaten. The aim of this study was to compare FFQs and 24HR to assess the consumption of various types of coffee.
METHODS
We included 25,904 participants aged 40 years or older from the Health Examinees (HEXA) Study of the Korean Genome and Epidemiologic Study (KoGES). Each participant completed one FFQ and one-day (n=11,280) or two-day 24HR (n=14,624). We classified coffee types into: black coffee, coffee with sugar and cream, and coffee with sugar alone or cream alone. We compared the proportions of nondrinkers, black coffee, and coffee with sugar and cream through FFQ and 24HR.
RESULTS
Among those who completed one FFQ and one-day 24HR, 39.4% of “nondrinkers†on one-day 24HR reported that they did not drink coffee on their FFQs. Whereas among those who complete two-day 24HR, 71.2% of “nondrinkers†on two-day 24HR said that they did not drink coffee on their FFQs. Among those who completed one FFQ and oneday 24HR, 58.3% marked “black coffee†on one-day 24HR said that they drank black coffee on their FFQs. Among those who complete two-day 24HR, 58.8% marked “black coffee†on two-day 24HR said that they drank black coffee on their FFQs. The kappa coefficients and percent agreements were 0.4 and 59.6%, respectively, for the comparison of coffee intake between FFQ and one-day 24HR, and 0.6 and 72.8%, respectively, for the comparison of coffee intake between FFQ and two-day 24HR.
CONCLUSIONS
We found discrepancies between FFQs and 24HR in the types of coffee consumed. Such limitations should be considered when using the 24HR data to examine the effect of coffee consumption on disease development. -
Citations
Citations to this article as recorded by- Genetic and Environmental Influences on Caffeine Intake in Korean Twins
Minsu Cho, Jiyoung Youn, Moonil Kang, Kyunga Kim, Joohon Sung, Jung Eun Lee
Behavior Genetics.2026;[Epub] CrossRef - Research Trends and Future Perspectives on Epigenetic Regulation of Food-derived Components for the Prevention of Chronic Diseases
Seon Kyeong Park, Jin-Taek Hwang
Journal of the Korean Society of Food Science and Nutrition.2025; 54(4): 301. CrossRef - Fraction of cancer incidence and mortality attributable to dietary factors in Korea from 2015 to 2030
Hyun Jeong Cho, Jin Young Yoo, Ga-Eun Yie, An Na Kim, Soseul Sung, Sungji Moon, Youjin Hong, Sangjun Lee, Inah Kim, Kwang-Pil Ko, Sun-Seog Kweon, Jung Eun Lee, Sue K. Park
Epidemiology and Health.2025; 47: e2025065. CrossRef - Association Between Instant Coffee Consumption and the Development of Chronic Obstructive Pulmonary Disease: Results From a Community-Based Prospective Cohort
Moon-Kyung Shin, Kyoung-Nam Kim
Journal of Korean Medical Science.2024;[Epub] CrossRef - Genetic variation rs1121980 in the fat mass and obesity-associated gene (FTO) is associated with dietary intake in Koreans
Young Goh, Jeong-Hwa Choi
Food & Nutrition Research.2022;[Epub] CrossRef - Coffee Consumption and the Risk of All-Cause and Cause-Specific Mortality in the Korean Population
Seong-Ah Kim, Li-Juan Tan, Sangah Shin
Journal of the Academy of Nutrition and Dietetics.2021; 121(11): 2221. CrossRef
- Genetic and Environmental Influences on Caffeine Intake in Korean Twins
- 3,114 View
- 58 Download
- 6 Crossref
- [English]
- Comparisons of Consumption Attitude toward Vegetables and Fragrance Vegetables Preference among Primary School to University Students in Gyeongbuk Area
- Yun Kyeong Lee, Youngnam Kim
- Korean J Community Nutr 2014;19(3):223-230. Published online June 30, 2014
- DOI: https://doi.org/10.5720/kjcn.2014.19.3.223
-
Abstract
PDF
- OBJECTIVES
The purpose of this study was to provide the preliminary data for dietary education to increase students' vegetables intake.
METHODS
The attitude of vegetables consumption (5-Likert scale), preference score (7-Likert scale) and eating frequency (5-Likert scale) of 9 fragrance vegetables were investigated by survey questionnaire. A total of 370 students enrolled in primary, middle, high schools, and university participated in the study and data were analyzed by the SPSS WIN (ver 12.0).
RESULTS
About 40% of those surveyed answered that they do not eat some kinds of foods and 16% of students do not eat vegetables, the most unfavorable foods. The students in all groups (primary 2nd and 5th, middle and high school, university students) answered that they liked vegetables with the highest score in university students, and they did not often eat fragrance vegetables. Lower age student group, especially primary school 2nd showed more positive attitudes of eating challenge toward no experience, bad taste, and dislike but nutritious vegetable foods. The most important factor of vegetable preference was taste, the biggest reason of both like and dislike. Only 4 students designated nutrition as for vegetable dislike reason, means that all students knew about the nutritional importance of vegetables. It was shown that the color and flavor of the vegetables act as dislikable reason rather than likable reason. The significant correlations between preference score and intake frequency of fragrance vegetables were confirmed, and the younger the students the greater the correlation coefficient.
CONCLUSIONS
Thus providing more chance to experience vegetables, such as fragrance vegetables and education about the importance of balanced diet will be an effective way of increasing vegetables intake, and the younger the students the greater the education effect. -
Citations
Citations to this article as recorded by- Analysis of socio-demographic and dietary factors associated with fruit and vegetable consumption among Korean adolescents: use of data from the 7th and 8th Korea National Health and Nutrition Examination Survey (2016–2019)
Bokyeong Yun, Seunghee Kye
Journal of Nutrition and Health.2024; 57(3): 292. CrossRef - Factors affecting preference of vegetable in elementary school students: based on social cognitive theory
Su Hyeon Cha, Ho Kyung Ryu
Journal of Nutrition and Health.2019; 52(3): 285. CrossRef - Relative Importance of Selection Attributes in Garlic-Based Health Functional Food Using Conjoint Analysis
Jisun Lee
Journal of the East Asian Society of Dietary Life.2019; 29(4): 336. CrossRef - Estimation of Usual Intake and Assessment of Nutrient Intake for Korean Adolescents: Analysis of the 2010-2012 Korea National Health and Nutrition Examination Survey
Meeyoung Kim, Jihyun Yoon
Family and Environment Research.2017; 55(4): 385. CrossRef - The Differences in Preference for Vegetables among Primary School to University Students in Gyeongbuk Area
Yun Kyeong Lee, Youngnam Kim
Korean Journal of Community Nutrition.2014; 19(5): 415. CrossRef
- Analysis of socio-demographic and dietary factors associated with fruit and vegetable consumption among Korean adolescents: use of data from the 7th and 8th Korea National Health and Nutrition Examination Survey (2016–2019)
- 1,989 View
- 1 Download
- 5 Crossref
 First
First Prev
Prev


