
Search
- Page Path
- HOME > Search
Research Note
- [Korean]
- Sugar intake from processed foods among Koreans and levy on excessive sugar use: a cross-sectional study
- Sung Ok Kwon, Cho-il Kim
- Korean J Community Nutr 2026;31(3):287-296. Published online June 30, 2026
- DOI: https://doi.org/10.5720/kjcn.2026.00199
-
 Abstract
 PDF
PDF - Objectives
Although reduced mean sugar intakes have been reported recently, proportion changes in the Korean population with a sugar intake higher than the World Health Organization (WHO) sugar intake recommendation (WSIR) remain unknown. Therefore, in this study, we analyzed the sugar intake of Koreans to identify trends and prioritize target groups for relevant policy interventions.
Methods
We used dietary intake data from the 8th and 9th Korea National Health and Nutrition Examination Surveys (KNHANES VIII and IX) to derive sugar intake from processed foods (SIPF) in the Korean population. We classified, aggregated and calculated sugar intake from individual foods at the tertiary-level food codes, and assessed SIPF adequacy based on whether it met the WSIR of less than 10% of the total energy intake.
Results
The proportion of the Korean population with an SIPF exceeding the WSIR was 22.7% and 22.4% in KNHANES VIII and IX, respectively. Nevertheless, more than one-third of children, adolescents, and young adults (34.6%–39.1%) showed SIPF higher than the WSIR with the highest proportion of 41.4% registered among school-age girls in KNHANES IX.
Conclusion
While the mean sugar intake of Koreans has decreased slightly since 2019, the proportion of people with SIPF exceeding WSIR is on the rise in school-age children, adolescents, and young adults, implying the necessity of proactive policy responses. As the Korean government discusses fiscal policy design and implementation to moderate the sugar intake of the population in order to promote public health and prevent chronic diseases, it should bear in mind the point emphasized in the WHO guideline as follows: “Changes in health-related outcomes as a result of a fiscal policy are likely to occur in the long term and should therefore be evaluated over a longer term than outcomes such as purchasing and consumption of foods and beverages.”
- 306 View
- 14 Download

Research Articles
- [English]
- Ultra-processed food intake and dietary behaviors in Korean adolescents: a cross-sectional study based on the 2019–2023 Korea National Health and Nutrition Examination Survey
- Jin-A Kim, Sim-Yeol Lee
- Korean J Community Nutr 2025;30(6):410-418. Published online December 31, 2025
- DOI: https://doi.org/10.5720/kjcn.2025.00297
-
Abstract
PDF
- Objectives
This study aimed to investigate the intake of ultra-processed foods (UPF) and dietary behaviors in Korean adolescents.
Methods
This study used 24-hour dietary recall data from the Korea National Health and Nutrition Examination Survey (2019–2023). In total, 1,720 adolescents aged 12–18 years were included in this study and categorized into quartiles based on the percentage of energy intake from the UPF. Nutritional status, contributing subgroups of UPF intake, and healthy dietary practices were examined using Health Plan 2030 indicators across quartiles of UPF intake.
Results
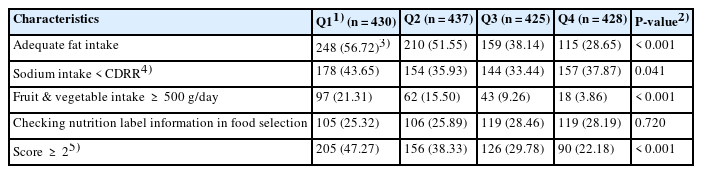
The nutrient intake of protein, vitamins (A, B1, B2, niacin), and minerals (iron, potassium) was the lowest in the fourth quartile of UPF intake compared with the first quartile (P for trend < 0.001), whereas calcium intake increased across quartiles, from 47.68% in the first quartile to 58.51% in the fourth quartile (P for trend < 0.001). The main contributing subgroups to UPF intake differed across quartiles of UPF intake, and the highest contributing subgroups were ‘instant noodles and dumplings,’ ‘desserts, cakes, and ice cream,’ and ‘sauces and seasonings.’ Healthy dietary practices were the lowest in the fourth quartile (22.18%, P < 0.001), and the proportions of appropriate fat and fruit/vegetable intake were significantly lower in the higher quartiles of UPF intake (P < 0.001).
Conclusion
This study suggests that a lower UPF intake was associated with better nutritional status and healthy dietary practices in Korean adolescents. These findings provide fundamental evidence for promoting healthier food choices and balanced dietary practices.
- 2,585 View
- 75 Download
- [English]
- Total sugar intake and its contributed foods by age groups in Koreans using the 8th (2019–2021) Korea National Health and Nutrition Examination Survey: a cross-sectional study
- Hyejin Yu, Sang-Jin Chung
- Korean J Community Nutr 2024;29(3):222-233. Published online June 30, 2024
- DOI: https://doi.org/10.5720/kjcn.2024.29.3.222
-
Abstract
PDF
- Objectives
This study was conducted to investigate the status of total sugar intake and contributing foods in Korea according to age groups.
Methods
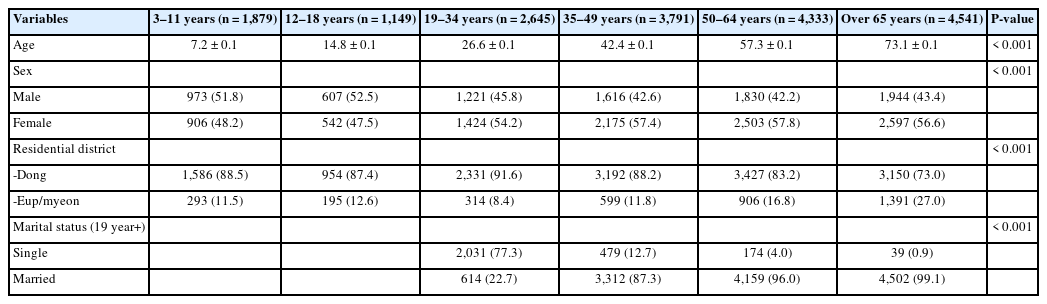
This study used 24-hour dietary recall data from the 8th Korea National Health and Nutrition Examination Survey (2019–2021) to investigate the nutritional and total sugar intake status among Koreans. A total of 18,338 research participants (≥3 years old) were included in this study. To analyze the types of foods contributing to total sugar intake, these foods were categorized into 15 types. Moreover, we examined the total sugar intake and ranked the most consumed foods by age groups (3–11 years, 12–18 years, 19–34 years, 35–49 years, 50–64 years, over 65 years). A survey procedure was employed for statistical analysis.
Results
The energy intake ratio from total sugars was approximately 12%–15%, which was within the recommended range. However, the proportion of individuals consuming total sugar exceeding 20% of their total caloric intake is nearly 20%, raising concerns about excessive sugar consumption. Furthermore, the percentage of participants whose intake of sugar from processed foods exceeded 10% of their total calories was highest in the 12–18 age group at 37.1%, followed by the 3–11 age group at 35.2%, and the 19–34 age group at 34.0%. Carbonated drinks, cola, and cider were the primary foods consumed by children and adolescents (3–18 years old) and young adults (19–34 years old). For middle-aged and older adults, mixed coffee with sugar and cream was a prominent contributor to sugar intake.
Conclusions
This study investigated sugar consumption patterns among Koreans, finding the principal foods contributing to this intake. Identifying these contributors is pivotal, given their potential impact on public health. -
Citations
Citations to this article as recorded by
- Psychosocial factors related to the stages of change in reducing sugar intake among adults in Seoul, Korea: a cross-sectional study
Ju Young Lee, Kyung Won Kim
Korean Journal of Community Nutrition.2026; 31(1): 21. CrossRef
- Psychosocial factors related to the stages of change in reducing sugar intake among adults in Seoul, Korea: a cross-sectional study
- 18,147 View
- 178 Download
- 1 Crossref
- [Korean]
- Development of Korean NOVA Food Classification and Estimation of Ultra-Processed Food Intake Among Adults: Using 2018 Korea National Health and Nutrition Examination Survey
- Hae Jin Park, Sohyun Park, Jee Young Kim
- Korean J Community Nutr 2022;27(6):455-467. Published online December 31, 2022
- DOI: https://doi.org/10.5720/kjcn.2022.27.6.455
-
Abstract
PDF
- Objectives
In this study, we suggest a Korean NOVA food classification that can be applied to food consumption among Korean. Based on this suggestion, the nutritional intake of Korean adults from ultra-processed foods (UPFs) was estimated.
Methods
Korean commercial food was categorized based on the NOVA food classification criteria through the Korea Food Code and expert meetings. Then, the nutrient intake status of 6,991 participants in the 2018 National Health and Nutrition Examination Survey was analyzed according to the food processing level. Then, 4,152 adult participants (age 19-65) were divided into quartiles on the basis of their intake of UPFs, and the nutrient intakes from UPFs were compared.
Results
Korean NOVA Food Classification defines with priority Group I (Unprocessed/ Minimally processed foods) and Group II (Processed culinary ingredients) foods based on the food cooking or consumption. Then, Group III (Processed foods) and Group IV (UPFs) are classified according to whether the characteristics of the raw materials used are maintained or whether the food was consumed before the 1970s. Our analysis results showed that most of the calories in the diet were consumed by Group I (52.7%), followed by Group IV (29.3%). After categorization of the adult participants into four groups according to their energy consumption from UPFs, we found that the highest consumption group (Q4) was younger and had higher percentage of men than women. The comparative analysis of the consumption of ultra-processed foods by Korean adults revealed that participants of a younger age and men consumed higher energy from UPFs than older participants and women, respectively (P < 0.01). Furthermore, the larger intake of UPFs was associated with an increasing trend for a higher intake of energy, sugar, saturated fat (P for trend < 0.001), total fat (P for trend = 0.021), and sodium (P for trend = 0.005), whereas the intake of carbohydrate, protein, and dietary fiber had a decreasing trend (P for trend < 0.001).
Conclusions
With the current increase in the consumption of processed and ultra-processed foods, it is important to carefully consider not only nutrient intake but also the level of food processing. -
Citations
Citations to this article as recorded by- Comparison of nutrients and ultra-processed food consumption between different phenotypes defined by abdominal obesity and sarcopenia
Eunjin Jang, Sarang Jeong, Jinhyun Kim, Sukyoung Jung, Jee Young Kim, Jung Eun Lee, Sohyun Park, Jang Won Son
Frontiers in Nutrition.2026;[Epub] CrossRef - Ultra-Processed Food Consumption and Domain-Specific Quality of Life in Postmenopausal Women: Associations with Mobility and Mental Health
Byung Soo Kwan, Jung-Hwan Cho, Jun Young Kim, Hye In Kim, Nak Gyeong Ko, Ji Eun Park
Healthcare.2026; 14(6): 791. CrossRef - Trends in Ultraprocessed Food Consumption Among Korean Children and Adolescents, 2007 to 2024
Sukyoung Jung, Eunice Hong Lim Lee, Jee Young Kim, Sohyun Park, Jung Eun Lee
JAMA Network Open.2026; 9(4): e265528. CrossRef - Ultra-Processed Food and Diabetes
Ji Yun Han
The Journal of Korean Diabetes.2026; 27(1): 37. CrossRef - Development of a simplified NOVA-based scoring tool for assessing ultra-processed food consumption among Korean young adults: a cross-sectional study
Jinhyun Kim, Eunjin Jang, Sarang Jeong, Sukyoung Jung, Jee Young Kim, Jung Eun Lee, Dahye Han, Eunseo Lee, Junhyeok Jang, Sohyun Park
Korean Journal of Community Nutrition.2026; 31(2): 140. CrossRef - Consumption of ultra-processed foods and major contributing foods according to the age group in Korean adults and older adults: using data from the Korean National Health and Nutrition Examination Survey (2016–2019)
Seulgi Lee, Jee Young Kim, Kirang Kim
Journal of Nutrition and Health.2025; 58(1): 59. CrossRef - Potential misclassification of ultra-processed foods across studies and the need for a unified classification system: a scoping review
Sukyoung Jung, Jee Young Kim, Sohyun Park, Jung Eun Lee
Nutrition Research and Practice.2025; 19(3): 331. CrossRef - Gender Differences in Ultra-Processed Food Consumption and Its Association with Obesity Among Korean Adults
Seung Jae Lee, Kyung Won Lee
Nutrients.2025; 17(12): 2027. CrossRef - Interaction between chronotype and ultra-processed food intake on triglyceride-glucose index in Korean adults
Sarang Jeong, Eunjin Jang, Sukyoung Jung, Jinhyun Kim, Minjeong Jeong, Dahye Han, Sohyun Park
Nutrition Research and Practice.2025; 19(4): 591. CrossRef - Ultra-processed food intake and risk of type 2 diabetes: a pooled analysis of three prospective cohorts of Korean adults and an updated meta-analysis
Yujin Kim, Yoonkyoung Cho, Bonjae Koo, Zhangling Chen, Qi Sun, Hannah Oh
European Journal of Epidemiology.2025; 40(11): 1293. CrossRef - Sex Differences in the Association Between Ultra-Processed Food Consumption and NAFLD: An Analysis of KNHANES 2013–2021 Data
Byung Soo Kwan, Nak Gyeong Ko, Ji Eun Park
Journal of Clinical Medicine.2025; 14(22): 7930. CrossRef - Ultra-processed food intake and dietary behaviors in Korean adolescents: a cross-sectional study based on the 2019–2023 Korea National Health and Nutrition Examination Survey
Jin-A Kim, Sim-Yeol Lee
Korean Journal of Community Nutrition.2025; 30(6): 410. CrossRef - Associations of Ultra-Processed Food Intake with Body Fat and Skeletal Muscle Mass by Sociodemographic Factors
Sukyoung Jung, Jaehee Seo, Jee Young Kim, Sohyun Park
Diabetes & Metabolism Journal.2024; 48(4): 780. CrossRef - Navigating Ultra-Processed Foods with Insight
Ji A Seo
Diabetes & Metabolism Journal.2024; 48(4): 713. CrossRef - Association of ultra-processed food with diabetes and impaired fasting glucose in elderly populations (urban and rural): a cross-sectional study
Seung Jae Lee, Mi Sook Cho
Korean Journal of Community Nutrition.2024; 29(1): 51. CrossRef - Sustainable diets: a scoping review and descriptive study of concept, measurement, and suggested methods for the development of Korean version
Sukyoung Jung
Korean Journal of Community Nutrition.2024; 29(1): 34. CrossRef - Eating patterns in Korean adults, 1998–2018: increased energy contribution of ultra-processed foods in main meals and snacks
Sukyoung Jung, Jee Young Kim, Sohyun Park
European Journal of Nutrition.2024; 63(1): 279. CrossRef - Association Between Ultraprocessed Food Consumption and Metabolic Disorders in Children and Adolescents with Obesity
Gyeong-yoon Lee, Joo Hyun Lim, Hyojee Joung, Dankyu Yoon
Nutrients.2024; 16(20): 3524. CrossRef - Changes in Ultra-Processed Food Consumption among Adolescents before and after the COVID-19 Pandemic : Using Data from the 7th (2018~2019) and 8th (2020~2021) Korea National Health and Nutrition Examination Survey
Hyun-Jin Hwang, Yoo Kyeong Kim
Korean Journal of Human Ecology.2024; 33(6): 981. CrossRef - Higher consumption of ultra-processed food is associated with cardiovascular risk in Korean adults: KNHANES 2016–2018
Sukyoung Jung, Eunjin Jang, Hyeongyeong Lee, Jee Young Kim, Sohyun Park
Frontiers in Nutrition.2023;[Epub] CrossRef
- Comparison of nutrients and ultra-processed food consumption between different phenotypes defined by abdominal obesity and sarcopenia
- 7,927 View
- 274 Download
- 20 Crossref
Original Articles
- [English]
- Prevalence of Nutrition Labeling and Claims on Processed, and Packaged Foods
- Kwang Il Kwon, So Hyun Park, Jun Hyung Lee, Jee Young Kim, Kwang Soo Yoo, Jee Sun Lee, Seo Young Kim, Hyuni Sung, Hye Seon Nam, Jong Wook Kim, Hye Young Lee, Hye Kyung Park, Myung Chul Kim
- Korean J Community Nutr 2007;12(2):206-213. Published online April 30, 2007
-
Abstract
PDF
- This study investigated the prevalence of nutrition labeling and claims on processed and packaged foods. The final database consists of 1,287 foods, which were collected in two supermarkets in the Seoul area from September to November, 2006. An estimated 78% of KFDA-regulated processed, and packaged foods have nutrition labels. Nutrient content claims on food labels were identified in 21% of the foods which have nutrition labels. The prevalence of nutrition labels in this study is much higher than in previous studies due to the current expansion of the mandatory labeling regulation. However, false labeling and misleading contents claims were also identified. The food label is an important tool for enhancing the public's understanding of healthy choices of processed foods. Therefore, to maximize the benefits of the nutrition labeling regulation, industries, government agencies and health professionals should work together to help consumers make healthy dietary choices and improve their health.
- 530 View
- 2 Download
- [English]
- A Study on the Current Nutrition Labelling Practices for Processed Foods
- Hyun Jung Lee, Hae Rang Chung, Young Ai Jang
- Korean J Community Nutr 2002;7(4):585-594. Published online August 31, 2002
-
Abstract
PDF
- This study examined the status of current nutrition labelling and claims for the processed foods that were purchased in the supermarket. They were assessed in the aspects of frequency and content of nutrition labelling and claims. The results are summarized as follows; The percentage of products contain the nutrition labelling or claims of processed foods of investigation were 18.7% and 18.8% respectively. In the nutrition labelling method, the format separated by expression contents with 'only liability indication nutrient' or 'liability indication nutrients plus discretion indication nutrients' were 44.7% and 43.4% respectively. In the case of type and title, 'table' and 'nutrition composition' were used most frequently, 83.9% and 83.2% respectively. And in the case of expression unit, 'per 100 g or 100 ml' was higher (56.8%) than others. Nutrition claims were divided into 'nutrition content claim' and 'comparative claim', in the former the most claim was 'containing' and in the other 'more or plus' used most frequently. 'Nutrient function claim' was 13.4% and 'Implied nutrient claim' was 7.3% of all the claims. Results of the evaluation of current nutrition labeling system, nutrition labelling was less advanced and variable in content and format and also the information was not easy for consumers to understand and use them. To support achievement of the nutrition label, there must be program and initiatives for better understanding and communication and guidances on food labelling and nutrition for food manufactures.
- 531 View
- 1 Download
 First
First Prev
Prev


