
Articles
- Page Path
- HOME > Korean J Community Nutr > Volume 27(6); 2022 > Article
- Research Article 한국형 NOVA 식품분류체계의 개발 및 한국 성인의 초가공식품 섭취량 추정: 2018년 국민건강영양조사 자료를 활용하여
-
박혜진
 , 박소현
, 김지영
, 박소현
, 김지영
- Development of Korean NOVA Food Classification and Estimation of Ultra-Processed Food Intake Among Adults: Using 2018 Korea National Health and Nutrition Examination Survey
-
Hae Jin Park
, Sohyun Park
, Jee Young Kim
-
Korean Journal of Community Nutrition 2022;27(6):455-467.
DOI: https://doi.org/10.5720/kjcn.2022.27.6.455
Published online: December 31, 2022
1식품안전정보원, 연구원
2한림대학교 식품영양학과 및 한국영양연구소, 교수
3식품안전정보원, 책임연구원
1Researcher, National Food Safety Information Service, Seoul, Korea
2Professor, Department of Food Science and Nutrition & The Korean Institute of Nutrition, Hallym University, Chuncheon, Korea
3Principal researcher, National Food Safety Information Service, Seoul, Korea
-
Corresponding author:
Jee Young Kim, Tel: +82-2-744-8106, Fax: +82-2-6020-8203,
Email: kimjee@foodinfo.or.kr
Received: 29 September 2022 • Revised: 30 October 2022 • Accepted: 4 November 2022
- 7,975 Views
- 278 Download
- 20 Crossref
- 0 Scopus
Abstract
Objectives
In this study, we suggest a Korean NOVA food classification that can be applied to food consumption among Korean. Based on this suggestion, the nutritional intake of Korean adults from ultra-processed foods (UPFs) was estimated.
Methods
Korean commercial food was categorized based on the NOVA food classification criteria through the Korea Food Code and expert meetings. Then, the nutrient intake status of 6,991 participants in the 2018 National Health and Nutrition Examination Survey was analyzed according to the food processing level. Then, 4,152 adult participants (age 19-65) were divided into quartiles on the basis of their intake of UPFs, and the nutrient intakes from UPFs were compared.
Results
Korean NOVA Food Classification defines with priority Group I (Unprocessed/ Minimally processed foods) and Group II (Processed culinary ingredients) foods based on the food cooking or consumption. Then, Group III (Processed foods) and Group IV (UPFs) are classified according to whether the characteristics of the raw materials used are maintained or whether the food was consumed before the 1970s. Our analysis results showed that most of the calories in the diet were consumed by Group I (52.7%), followed by Group IV (29.3%). After categorization of the adult participants into four groups according to their energy consumption from UPFs, we found that the highest consumption group (Q4) was younger and had higher percentage of men than women. The comparative analysis of the consumption of ultra-processed foods by Korean adults revealed that participants of a younger age and men consumed higher energy from UPFs than older participants and women, respectively (P < 0.01). Furthermore, the larger intake of UPFs was associated with an increasing trend for a higher intake of energy, sugar, saturated fat (P for trend < 0.001), total fat (P for trend = 0.021), and sodium (P for trend = 0.005), whereas the intake of carbohydrate, protein, and dietary fiber had a decreasing trend (P for trend < 0.001).
Conclusions
With the current increase in the consumption of processed and ultra-processed foods, it is important to carefully consider not only nutrient intake but also the level of food processing.
Korean J Community Nutr. 2022 Dec;27(6):455-467. Korean.
Published online Dec 31, 2022.
https://doi.org/10.5720/kjcn.2022.27.6.455
Published online Dec 31, 2022.
https://doi.org/10.5720/kjcn.2022.27.6.455
Copyright © 2022 The Korean Society of Community Nutrition
Original Article
한국형 NOVA 식품분류체계의 개발 및 한국 성인의 초가공식품 섭취량 추정: 2018년 국민건강영양조사 자료를 활용하여
Development of Korean NOVA Food Classification and Estimation of Ultra-Processed Food Intake Among Adults: Using 2018 Korea National Health and Nutrition Examination Survey
Abstract
Objectives
In this study, we suggest a Korean NOVA food classification that can be applied to food consumption among Korean. Based on this suggestion, the nutritional intake of Korean adults from ultra-processed foods (UPFs) was estimated.
Methods
Korean commercial food was categorized based on the NOVA food classification criteria through the Korea Food Code and expert meetings. Then, the nutrient intake status of 6,991 participants in the 2018 National Health and Nutrition Examination Survey was analyzed according to the food processing level. Then, 4,152 adult participants (age 19-65) were divided into quartiles on the basis of their intake of UPFs, and the nutrient intakes from UPFs were compared.
Results
Korean NOVA Food Classification defines with priority Group I (Unprocessed/Minimally processed foods) and Group II (Processed culinary ingredients) foods based on the food cooking or consumption. Then, Group III (Processed foods) and Group IV (UPFs) are classified according to whether the characteristics of the raw materials used are maintained or whether the food was consumed before the 1970s. Our analysis results showed that most of the calories in the diet were consumed by Group I (52.7%), followed by Group IV (29.3%). After categorization of the adult participants into four groups according to their energy consumption from UPFs, we found that the highest consumption group (Q4) was younger and had higher percentage of men than women. The comparative analysis of the consumption of ultra-processed foods by Korean adults revealed that participants of a younger age and men consumed higher energy from UPFs than older participants and women, respectively (P < 0.01). Furthermore, the larger intake of UPFs was associated with an increasing trend for a higher intake of energy, sugar, saturated fat (P for trend < 0.001), total fat (P for trend = 0.021), and sodium (P for trend=0.005), whereas the intake of carbohydrate, protein, and dietary fiber had a decreasing trend (P for trend < 0.001).
Conclusions
With the current increase in the consumption of processed and ultra-processed foods, it is important to carefully consider not only nutrient intake but also the level of food processing.
Keywords
NOVA food classification; ultra-processed foods; Korean
서론
지난 20여 년 동안 전 세계적으로 주요 사망 요인이 감염성질환에서 비감염성질환으로 전환됨에 따라 고혈압, 비만, 심혈관계질환 등 식생활과 연관된 비감염성질환에 대한 관심이 높아지고 있다. 세계보건기구(World Health Organization, WHO)가 2022년에 발표한 보고서에 따르면 전 세계적으로 10대 사망원인 중 7개가 비감염성질환이며, 2000년 전체 사망자 중 60.8%에서 2019년 73.6%로 증가하였다[1]. 2003년 WHO와 세계식량농업기구(Food and Agriculture Organization of the United Nations, FAO)가 비감염성질환 예방을 위한 식이 지침을 마련하였고[2], 많은 국가에서 가공식품의 나트륨, 당류 함량 감소 및 소비자 대상 교육·홍보 등 영양 관련 비감염성질환의 예방과 통제에 많은 노력을 기울이고 있지만 그럼에도 불구하고 전 세계적으로 비만율은 여전히 증가하는 추세를 보이고 있다[3].
공중보건 상 식생활이 미치는 영향은 영양소 함량에 의해 판단하는 것이 일반적이나 10년 전부터 비감염성질환 예방 및 관리를 위한 영양소 위주 접근방식과 더불어 식품 가공의 중요성에 대한 논의가 활발하게 이루어지고 있다. 식품가공 수준에 따라 식단을 평가하는데 가장 많이 사용되는 방법은 NOVA식품분류체계이며, 여러 국가에서 수행된 많은 연구에서 사용되었다[4, 5, 6, 7]. 또한 범미보건기구(Pan American Health Organization, PAHO), WHO 및 FAO 등의 국제기구가 인정하고 사용하도록 권고하고 있다[8, 9]. NOVA식품분류체계는 식품을 가공 정도에 따라 자연식품 및 최소가공식품, 가공식재료, 가공식품, 초가공식품 총 4개의 그룹으로 구분한다[9]. 초가공식품이란 향료, 착색제, 유화제 등 다양한 첨가물을 사용하여 산업용으로 제조된 식품으로 일반적으로 가공되지 않거나 최소한으로 가공된 식품에 비해 열량 밀도가 높고 지방, 당류 및 나트륨 함량이 더 높은 것으로 알려져 있다[9, 10, 11]. 초가공식품은 대부분 맛이 매우 좋고, 정교하며, 쉽게 이용 가능한 식품으로 이윤추구 목적을 가진 수익성이 높은 식품이다[6, 12, 13, 14, 15].
1950년대부터 고소득 국가를 중심으로 식품 생산과 소비패턴의 변화가 관찰되기 시작하면서 가공식품 특히 당류, 지방, 나트륨 함량과 열량 밀도가 높은 식품의 섭취가 증가하였으며, 1970년대 이후에는 글로벌한 규모로 소비가 늘었다[5, 9, 16]. 전 세계적으로 가공식품은 가정에서 조리된 식사와 신선한 과일 및 채소 소비를 점차 대체하고 있다. 세계화된 식품공급 시스템은 현재 대부분의 국가에서 식품공급을 크게 촉진하고 있으며, 간편하게 섭취할 수 있는 빠르고 편리한 가공식품이 꾸준히 증가하는 추세이다[17, 18]. 이처럼 가공식품과 초가공식품의 접근성과 섭취량 증가는 비만, 비감염성질환 증가의 주요 원인으로 보건학적 문제가 되고 있다[3, 4, 8, 19, 20, 21].
본 연구에서는 서구권에서 개발된 NOVA분류체계의 기준이 우리의 식품 섭취 행태에 적용 가능한지를 검토하고 적절한 분류 기준을 제안하고자 한다. 또한 이 기준을 바탕으로 2018년 국민건강영양조사 자료를 활용하여 국민들의 초가공식품 섭취 실태를 분석하였다.
연구대상 및 방법
1. 연구대상
본 연구에서는 우리나라 국민의 건강과 영양섭취를 대표하는 자료인 국민건강영양조사의 2018년 원시 자료를 사용하였다. 2018년 국민건강영양조사의 식이섭취조사에 참여한 국민은 총 7,064명이었으며, 이 중 영양소 섭취량 분석 결측치가 있거나 열량을 300 kcal/day 이하, 5,000 kcal/day 이상 섭취하는 자(n = 73명)를 제외하고 총 6,991명을 대상으로 진행하였다. 그 다음 성인의 초가공식품 섭취행태를 알아보기 위해 19세 미만, 65세 이상(2,839명)을 제외한 4,152명을 대상으로 분석을 진행하였다.
2. 연구내용 및 방법
1) NOVA분류체계에 따른 한국인 상용식품의 분류
NOVA분류체계는 모든 식품을 처리하는 산업 공정의 특성, 범위, 목적에 따라 다음과 같은 4가지 그룹으로 식품을 분류한다. 첫 번째 그룹I은 자연식품 및 최소가공식품(Minimally processed food, MPF)으로 자연식품을 보존하고 저장에 적합하게 만들거나 식품을 안전하게 먹을 수 있도록 최소한의 가공을 거친 식품이고, 두 번째 그룹II는 가공식재료(Processed Culinary ingredients, PCI)로 그룹I(MPF)에서 압착, 정제, 제분 등과 같은 공정을 통해 얻어지는 소금, 설탕, 꿀 등의 식품을 말한다. 세 번째인 그룹III은 가공식품(Processed Food, PF)으로 최소가공식품의 저장성 및 관능적 특성을 향상시키기 위해 그룹I에 그룹II 성분을 첨가하여 제조한 식품이다. 마지막으로 그룹IV는 초가공식품(Ultra Processed Food, UPF)으로 보존제 및 향료 등의 식품첨가물 등을 사용하여 산업적 공정에 의해 생산된 식품이다[9].
위 분류체계에 대한 우리나라 섭취식품에 적용 가능성을 검토하기 위해 한국인 주요 섭취식품을 식품공전에 따른 식품유형으로 분류하였고, 식품유형 내 제품별 특징과 품목제조보고서의 원재료 명을 찾아 첨가물 사용 유무, 원재료 상태 등을 확인하였다.
식품유형의 분류 기준 및 흐름도는 Fig. 1과 같다. 국민건강영양조사 자료의 섭취 식품에 NOVA분류체계를 적용하기 위해 우선 섭취 식품을 식품공전의 식품유형으로 구분하였다. 식품유형은 식품의약품안전처에서 식품안전을 위한 기준·규격 관리를 효율적으로 수행하기 위해 사용하는 식품 분류이다[22, 23]. 식품공전 해설서의 식품유형 분류 순서를 참고하여 국민건강영양조사의 섭취 음식을 식품공전의 식품유형으로 전환하였다. 먼저 자연산물의 여부 및 관리 법령, 특정 섭취·대사를 고려한 우선 분류 유형을 고려하였으며, 다음으로 자연산물의 특성 유지 수준 및 단일 원료로부터 채취·분리·정제 등 제품 원료, 제조방법, 제품형태 등을 고려한 일반유형에 따른 구분 등의 기준을 사용하였다. 또한 식품공전상의 식품유형을 NOVA분류체계와 매칭을 위해 식품유형, 식품유형 내 제품의 특성, 품목제조보고서의 원재료명 정보를 활용하였다.
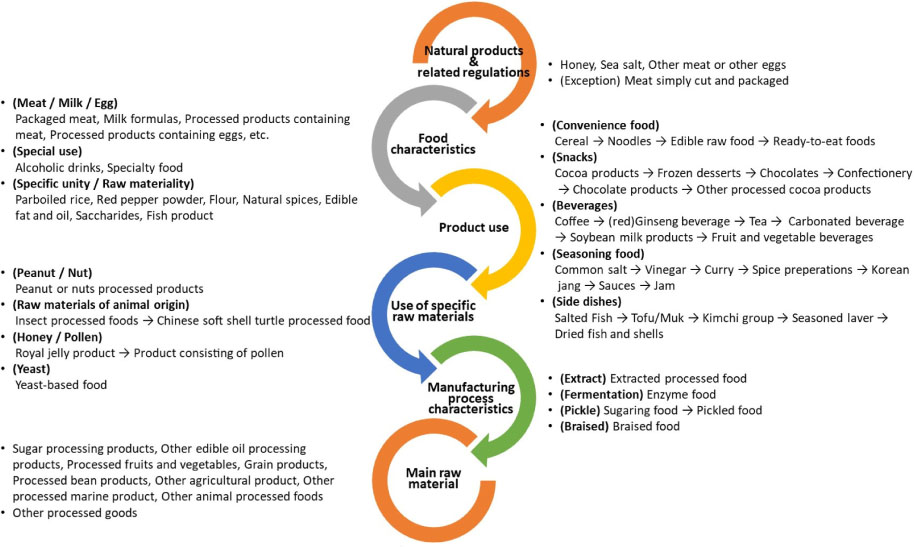
Fig. 1
Classification criteria and flowchart of the food types
이와 더불어 영양역학 전문가, 식품정책 전문가, 식품공학 전문가, 식품학 전문가 총 4명으로 구성된 전문가 원탁회의를 지속적으로 개최하였다. 전문가 원탁회의는 총 5회 진행되었으며 이를 통해 한국형 NOVA 분류체계에 대한 기준과 원칙을 모두 동의할 때까지 논의하고 결정하였다.
2) 식품가공수준에 따른 한국인 영양섭취 현황
개발된 한국형 NOVA분류체계에 따라 국민건강영양조사 자료를 이용하여 식품가공 수준에 따른 열량, 탄수화물, 당류, 지방, 포화지방, 식이섬유, 나트륨의 섭취를 분석하였다. 초가공식품의 섭취가 비감염성질환으로 이어질 수 있는 성인들의 섭취현황을 자세히 보기 위해 성인 4,152명의 전체 섭취 열량 대비 초가공식품에서 기인하는 열량을 비율로 구한 뒤, 초가공식품 열량 섭취에 따라 대상자를 사분위로 나누어 연령, 성별, 초가공식품에 기인한 영양소 섭취비율을 비교·분석하였다. 그룹 별 열량, 탄수화물, 당류, 지방, 포화지방, 식이섬유, 나트륨 섭취 수준은 성별과 연령, 가구소득을 보정하여 비교하였다.
3) 통계분석
국민건강영양조사의 자료는 STATA 17.0 (Stata Corporation, College Station, TX, USA)을 이용하여 분석하였다. 기술통계분석을 이용하여 연령대별 식품가공 수준에 따른 열량, 당류, 지방, 포화지방, 식이섬유, 나트륨의 섭취 추이를 분석하였으며, 이 중 식이섬유와 나트륨은 열량을 보정하여 개인 당 1,000 kcal 당 섭취 밀도를 분석하였다. 초가공식품 섭취량에 따라 사분위 그룹으로 나누고, 기술통계분석과 교차분석을 통해 그룹별 평균연령과 성별 비율을 알아보았다. 성별과 가구소득을 보정 후 초가공식품 섭취량이 가장 적은 Q1을 기준으로 선형 회귀모델을 이용해 초가공식품 섭취량에 따른 영양소 섭취현황을 분석하였다. 유의성은 95% 신뢰구간(Confidence intervals, CI) 내에서 분석하였다.
결과
1. NOVA분류체계에 따른 한국인 상용식품의 분류
Fig. 2와 같이 소비자가 식품을 조리 또는 섭취하는 단계에서 그룹I과 그룹II 식품을 우선적으로 구분·분류한 후 사용된 원재료의 특성 유지 및 이전부터 섭취해오던 식품인지 여부를 기준으로 그룹III(가공식품)과 그룹IV(초가공식품)으로 구분하였다.
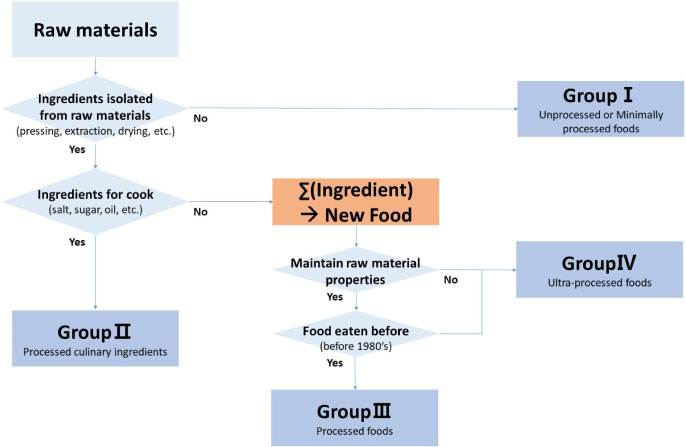
Fig. 2
Food classification flowchart by the Korean NOVA classification system
첫째, NOVA분류체계 개발의 기본 개념인 식품 매트릭스의 보존 및 파괴를 기초로 최종 제품에서 다량으로 사용되는 원재료를 확인한다. 즉, 자연식품의 특성이 유지되는 점을 우선적으로 검토하였다. 둘째, 우리 국민이 예전부터 섭취하던 식품인지 여부를 기준으로 하여 구분한다. 여기에서 예전부터란 영양전환의 개념을 활용하여 한국의 산업화가 활발해진 1970-1980년을 기준으로 하였다. 최근 새롭게 섭취하는 식품은 대부분이 산업화된 제품의 형태로 섭취하므로 그룹IV, 즉 초가공식품일 가능성이 높은 편이다. 초가공식품의 사례로 많이 언급되는 즉석섭취, 간단편의식품 등의 개념보다 자연식품으로의 원료 식품의 특성 유지 여부를 가장 중요한 분류기준으로 선택한 것이다. 예를 들어 맛땅콩, 가정대용식(Home Meal Replacement, HMR) 중 닭발, 덮밥과 같이 식품 매트릭스가 살아있는 제품은 그룹III(가공식품)으로 분류되며, 시판용 동그랑땡, 땅콩버터, 과일음료 및 주스 등 다져지거나 원물을 알 수 없는 형태로 맛과 향을 제외 시 구별이 되지 않는 제품, 산업적 원료 비율이 원물 원료보다 높은 식품은 그룹IV(초가공식품)으로 분류된다.
개발된 한국형 NOVA 분류체계를 제품특성에 적용한 결과는 Table 1과 같다. 빙과류, 코코아가공품류 또는 초콜릿류, 면류, 음료류 등은 식품유형 별로 NOVA분류체계와 매칭이 가능하였으며, 장류의 경우는 청국장, 한식된장, 한식간장 등 전통적인 원료를 사용한 경우는 그룹III인 가공식품으로 구분하였다. 반면 탈지대두와 같은 원료를 사용하거나 산분해 등의 생산공정을 거치는 등 초가공식품 특성을 가지고 있는 경우는 그룹IV로 구분하였다. 치즈류의 경우 자연치즈는 그룹III, 슬라이스 체다치즈와 같은 가공치즈는 그룹IV로 구분하였다.
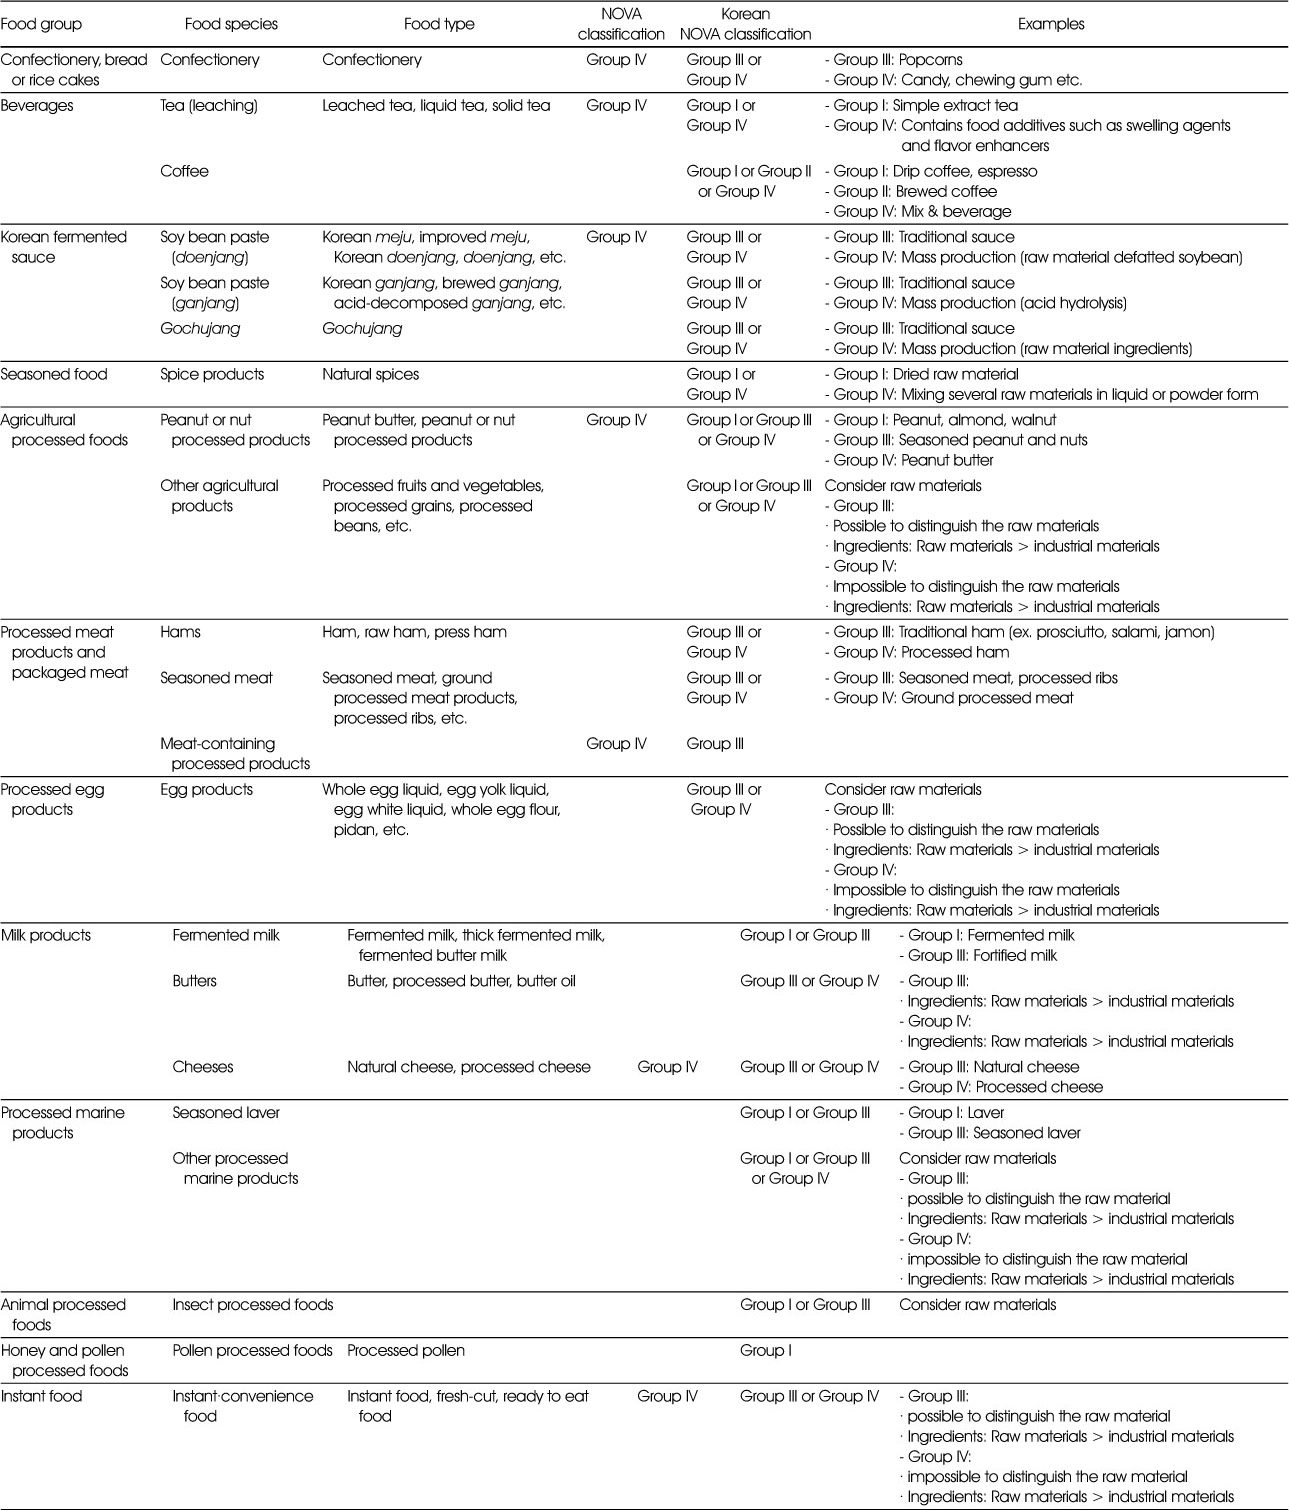
Table 1
Korean NOVA classification system based on product characteristics
섭취 식품의 식품유형 분류가 명확하게 이루어지지 않는 경우는 제품명과 제조사 정보를 이용하여 해당 제품의 원재료 확인을 통해 가공식품 및 초가공식품을 구분하였다. 음료류 중 다류의 경우 제품명만 보면 단순 추출물로 그룹I에 속한다고 볼 수 있으나 품목제조보고서의 원재료명을 확인한 후 농축액 또는 추출액, 글리신, 탄산수소나트륨, 합성향료 등을 사용한 경우는 초가공식품인 그룹 IV로 분류하였다.
2. 한국형 NOVA 분류체계에 따른 한국인 영양섭취 현황
1) 식품가공수준에 따른 연령별 영양소 섭취 현황
영양소 섭취 현황은 Table 2와 같다. 전체 식품에서 섭취하는 열량은 20-30대가 2,082 kcal로 가장 높은 것으로 나타났고 40-50대, 1-19세, 60세 이상 순으로 뒤를 이었다. 본 논문에서 소개한 한국형 NOVA 분류체계에 따른 열량 섭취량을 보면 모든 연령대에서 그룹I에서 기인한 열량이 가장 많았다. 초가공식품인 그룹IV로부터 섭취하는 열량 비율은 20-30대가 36.2%로 가장 높았으며, 그 뒤를 이어 1-19세(33.1%), 40-50대(28.8%), 60세 이상(19.7%) 순이었다.
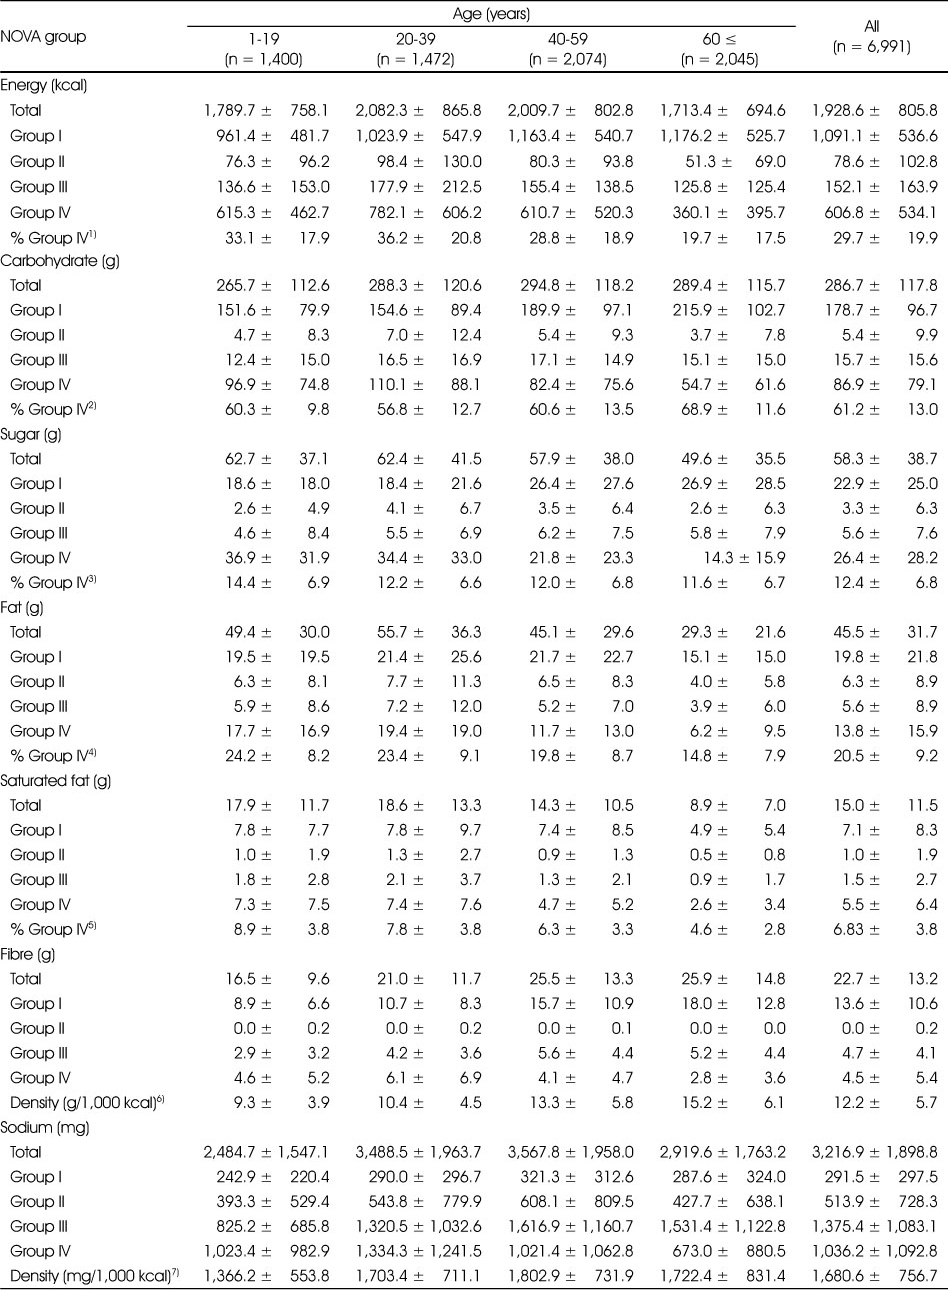
Table 2
Nutrient intake status of Koreans according to the Korea NOVA classification system (2018 Korea National Health and Nutrition Examination Survey)
전체 식품에서의 당류 섭취량은 1-19세와 20-30대가 하루 약 62 g정도로 많이 섭취하였으며, 40-50대, 60세 이상 순이었다. 1-19세, 20-30대는 그룹IV로부터 기인한 당류 섭취량이 가장 높았고, 40-50대, 60세 이상은 그룹I에서 기인한 당류섭취량이 가장 높았다. 초가공식품인 그룹IV로부터 섭취하는 당류의 섭취 열량 비율은 1-19세가 가장 높아 14.4%였으며, 20-30대(12.2%), 40-50대(12.0%), 60세 이상(11.6%) 순으로 조사되었다.
전체 식품에서의 지방 섭취량은 20-30대가 55.7 g으로 가장 높았고, 1-19세, 40-50대, 60세 이상 순이었다. 모든 연령대에서 그룹I에서 기인한 지방 섭취량이 가장 많았고, 초가공식품인 그룹IV로부터 섭취하는 지방의 섭취 열량 비율은 1-19세(24.2%), 20-30대(23.4%), 40-50대(19.8%), 60세 이상(14.8%) 순으로 조사되었다.
전체 식품에서의 포화지방 섭취량의 경우 지방과 동일하게 20-30대가 18.6 g으로 가장 많이 섭취했고, 1-19세 그룹도 17.9 g으로 포화지방 섭취량이 높았다. 모든 연령대에서 그룹I에서 기인한 포화지방 섭취량이 가장 많았지만, 1-19세, 20-30대의 경우 그룹IV에 기인한 포화지방 섭취량과 큰 차이가 나지 않았다. 초가공식품인 그룹IV로부터 섭취하는 포화지방의 열량 비율은 1-19세(8.9%), 20-30대(7.8%), 40-50대(6.3%), 60세 이상(4.6%) 순이었다.
식이섬유와 나트륨은 열량을 보정한 밀도를 이용하여 분석하였다. 먼저 식이섬유는 1,000 kcal 열량 섭취 당 60세 이상이 25.9 g, 40-50대가 25.5 g으로 높은 섭취량을 보였고 20-30대, 1-19세가 상대적으로 낮은 섭취량이었다. 모든 연령대에서 그룹I에서 기인한 식이섬유 섭취량이 높게 나타났다. 나트륨은 1,000 kcal 열량 섭취 당 40-50대가 하루 평균 약 3,567.8 mg, 20-30대가 약 3,488.5 mg으로 많이 섭취하는 것으로 조사되었으며, 1-19세, 20-30대는 그룹IV로부터 기인한 나트륨 섭취량이 가장 높았고, 40-50대, 60세 이상은 그룹III에서 기인한 나트륨 섭취량이 가장 높았다.
2) 한국 성인의 초가공식품 섭취량에 따른 그룹 별 영양소 섭취 현황
2018년 국민건강영양조사 자료에서 19세 미만, 65세 이상을 제외한 성인 총 4,152명을 그룹IV 초가공식품 섭취량에 따라 사분위 그룹으로 나누어 비교한 결과는 Table 3, 4와 같다. 초가공식품을 가장 적게 섭취하는 Q1의 초가공식품으로 부터 섭취하는 열량 비율이 7.1%인 반면 가장 많이 섭취하는 Q4는 58.3%로 Q1보다 약 8배가량 높았다. 또한 초가공식품의 섭취량이 가장 높은 Q4의 평균연령이 38.2세로 Q1보다 평균연령이 8.6세 낮다. 남성의 경우 Q1에서 Q4로 갈수록 비율이 높아졌고, 여성의 경우 반대로 Q1에서 Q4로 갈수록 비율이 낮아졌다. 즉 연령이 낮을수록, 여성보다는 남성이 초가공식품을 더 많이 섭취하는 것으로 나타났다(P = 0.003). 성별에 따른 급원 식품 확인 결과 남성은 주류(6.4%), 비-유탕면(4.0%), 빵류(3.4%), 유탕면(2.9%) 순으로 조사되었으며, 여성은 비-유탕면(4.3%), 빵류(4.2%), 떡류(2.4%), 주류(2.3%)로 조사되었다.
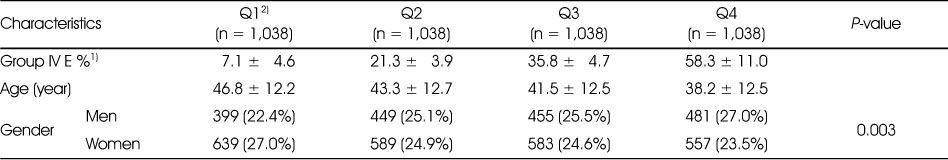
Table 3
Dietary and demographic characteristics by the percentage of energy intake from ultra-processed foods in Korean adults (n = 4,152)
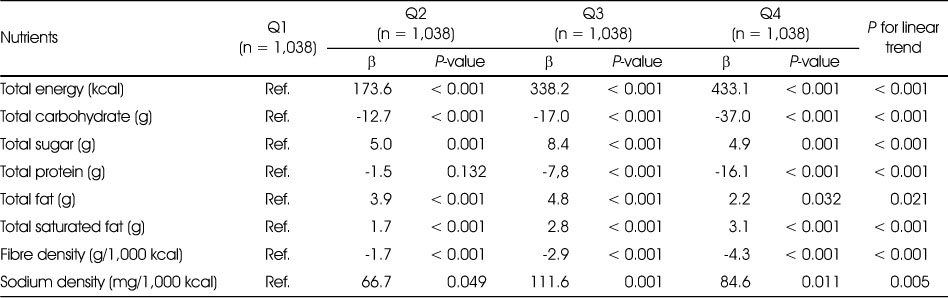
Table 4
Nutrient intake of Korean adults according to ultra-processed food intake (n = 4,152)
열량 보정 후 군집별 영양소 섭취량을 분석한 결과 초가공식품을 많이 먹을수록 열량과 포화지방의 섭취량이 증가하였고(P < 0.001), 탄수화물과 단백질, 식이섬유의 섭취량은 감소하였다(P < 0.001). 당류와 지방, 나트륨의 경우 Q3가 가장 많이 섭취하는 것으로 나타났지만, Q1과 비교하였을 때 Q4에서 더 많이 섭취하는 것으로 조사되었다(P < 0.001, P = 0.021, P = 0.005). 선형회귀분석 결과 초가공식품을 많이 먹을수록 열량, 당류, 포화지방(P for trend < 0.001), 지방(P for trend = 0.021), 나트륨(P for trend = 0.005) 섭취가 증가하는 추세를 보였고, 탄수화물, 단백질, 식이섬유의 섭취량은 감소하는 추세를 보였다(P for trend < 0.001).
고찰
식품가공 수준에 따라 식생활을 평가하기 위해 가장 많이 사용되는 방법은 NOVA분류체계이며[5], 이는 개발된 지 10여년 정도로 연구자 및 연구시기에 따라 초가공식품에 대한 정의가 계속적으로 진화하고 있다. 많은 연구에서 제시하고 있는 가공식품과 초가공식품의 구분 기준은 사용한 원료 성분의 특성 및 수, 식품첨가물의 사용목적 등이 있으며[14, 24, 25], 가장 최근에 제시된 기준에 따르면 초가공식품은 산업적 성분을 원재료로 갖고 그룹I(자연식품/최소가공식품)의 모방 및 품질향상을 위해 식품첨가물을 사용한다는 특징을 가지고 있다. 우리나라의 경우 섭취하는 대부분의 식품이 이미 산업화되어 생산되고 있어 원재료 수와 첨가물의 사용 목적 등으로 구분하는 것에 한계가 있으므로 본 연구에서는 우리나라의 식품에 적용할 수 있는 초가공식품의 분류 기준을 원식품의 고유 특성 보유 여부와 전통적 섭취 경험을 기준으로 한국형 NOVA분류체계를 정립하였고 개발된 한국형 NOVA분류체계를 활용하여 2018년 한국인 초가공식품 섭취현황을 분석하였다.
개발한 한국형 NOVA분류체계를 활용하여 한국의 열량 섭취 현황을 미국과 비교하여 보았을 때 Steele 등[26]은 미국의 영양조사인 NHANES 2009-2010의 자료를 분석한 결과 그룹I에서 586 kcal, 그룹II 64 kcal, 그룹III 210 kcal, 그룹IV 1,210 kcal가 기인하는 것으로 추정하였다. 이는 전체 평균 열량 섭취량 2,070 kcal 기준으로 볼 때 그룹I과 그룹IV의 비율은 각각 28.3%, 58.5%로 우리나라는 그룹I(1,091 kcal, 52.7%)이 그룹IV(606 kcal, 29.3%)의 약 2배가량 많은 반면에 미국은 그룹IV가 그룹I에 비해 2배 많은 수준이다. 이는 한국인의 주식인 밥의 영향을 받은 것으로 보이며, 이러한 결과를 미루어보아 우리의 식생활이 서구화 되었다고 하지만 아직까지는 상대적으로 초가공식품의 섭취가 서구식문화에 비해 적은 것으로 여겨진다.
당류섭취의 경우 1일 평균 섭취량이 58.26 g, 1-19세 62.67 g, 20-30대 62.40 g으로 WHO 1일 권장섭취량 25 g보다 많이 섭취하는 것을 알 수 있었다.「2020 한국인 영양소 섭취기준」(보건복지부, 2020)은 가공식품을 통한 당류 섭취량을 1일 열량의 10% 이내로 관리해야한다고 제시하였지만, 본 조사 결과 초가공식품에 기인한 당류 섭취량이 모든 연령대에서 10% 이상인 것으로 나타났다. 나트륨 또한 19-64세 성인의 ‘나트륨 만성질환 위험감소 섭취량’을 2,300 mg/일로 제시하였으나 모든 연령에서 제시된 섭취량보다 100 mg 이상 높게 나타났다. 특히 1-19세, 20-30대에서 그룹IV로부터 기인한 당류와 나트륨 섭취량이 가장 높았고, 포화지방 섭취량 또한 가장 많이 기인한 그룹I과 큰 차이가 나지 않았다. Chang 등[27]이 9,025명의 어린이를 7세에서 24세까지 추적한 결과 그룹IV, 초가공식품을 가장 많이 소비한 그룹은 BMI, 몸무게, 허리둘레, 체지방이 청소년기와 초기 성인기로 더 빠르게 진행되었으며 24세까지 평균적으로 BMI수치와 체지방이 각각 1.2 kg/m2, 1.5%로 높게 나타났고, 몸무게는 3.7 kg 더 많이, 허리둘레는 3.1 cm 더 크게 나타났다. 어린 시절 확립된 식습관이 성인기로까지 확장되어 평생의 신체 및 정신 건강에 영향을 미칠 수 있으므로 초가공식품에 대한 어린이의 노출과 소비를 줄이고 최소가공식품에 대한 접근 장벽을 제거하는 보다 급진적이고 효과적인 공중 보건 조치가 필요할 것으로 사료된다.
우리나라 성인의 초가공식품 섭취량에 따라 사분위 그룹으로 나누어 비교해 본 결과 나이가 적을수록 초가공식품을 많이 섭취하는 것으로 나타났다. Ha & Kim[28], Lee & Ahn[29]의 연구에서도 나이가 적을수록 가공식품의 섭취량과 선호도가 높게 조사되었으며, 미국, 프랑스, 스페인, 벨기에 등의 연구에서도 나이가 적을수록 평균 초가공식품의 열량 기여도가 높았다[30, 31, 32, 33]. 일반적으로 젊은 사람들이 식품 마케팅과 광고에 민감하며, 새로운 식품에 대해 거부감이 덜하고, 이들의 바쁜 사회활동으로 인한 편의식, 인스턴트식품 등 초가공식품의 소비증가에 따른 현상에 기인한 것으로 보인다[34, 35]. 또한 이전 연구들과 동일하게 남자가 여자보다 초가공식품을 더 많이 섭취하는 것으로 나타났다(P < 0.01)[21, 35, 36, 37]. 이는 여성이 남성보다 건강한 영양과 체중조절에 더 많이 참여하고, 건강한 간식을 선호하는 반면 남성은 주로 취향에 따라 움직이고 소비의 쾌감이 우세하며, 맛이 강한 기름진 음식을 선호하는 등 남녀의 식습관과 건강에 대한 신념 차이에 따른 현상으로 보인다[38]
사분위 그룹 중 초가공식품을 가장 적게 섭취하는 Q1을 기준으로 가장 많이 섭취하는 Q4의 영양소 섭취량 비교 결과 열량(P < 0.001), 포화지방(P < 0.001), 당류(P < 0.001), 지방(P =0.032), 나트륨(P = 0.011)의 섭취량이 증가하였고, 탄수화물과 단백질, 식이섬유의 섭취량은 감소하였다(P < 0.001). 초가공식품의 섭취는 일반적으로 열량, 지방, 당류 및 나트륨의 높은 섭취와 미량 영양소 및 식이섬유의 낮은 섭취량을 동반해 식사의 질적 수준을 저하시키고, 낮은 식이 영양소 품질은 과체중 및 비만, 심혈관계질환, 고혈압, 대사증후군 등 여러 비감염성질환의 발병으로 이어진다[24, 25, 39, 40]. 특히 Steele 등[41]의 연구에서는 초가공식품의 소비가 10% 증가할 때마다 대사증후군 유병률이 4% 증가하였고, 과민성대장증후군이나 기능성 소화불량과 같은 위장관 질환, 우울증, 불안증세 등의 정신건강과도 연관이 있는 것으로 나타났다[31, 42]. 현재까지 초가공식품이 건강에 유익한 영향을 미친다는 결과는 없으며, 선행연구에서 관찰된 결과를 보충하는 생물학적 메커니즘에 대한 규명이 이어지고 있다.
NOVA분류체계의 개발 및 활용은 전 세계적으로 증가하는 비만과 비감염성질환의 예방 및 관리 차원에서 식품의 고유한 특성의 중요성을 강조하고 있다. 단순히 열량, 포화지방, 당류 등의 영양소 함량이 낮은 식품선택이 아닌 가공수준을 고려한 식품 선택을 중심으로 한 식생활 실천이 중요한 것이다. 초가공식품은 식품가공 자체가 문제의 본질이 아니며 이러한 식품을 일상적으로 자주, 많이 섭취하는 것이 문제이므로 이에 대해 적극적인 검토가 필요할 것으로 보인다. 식품은 영양소의 합 이상의 복잡한 구조를 가지고 있는 생리활성 화합물의 패키지 시스템으로 영양학과 식품공학, 그리고 인접 학문 등의 학제간 융합을 통한 다양한 접근으로 문제 해결 방안을 모색해야 할 것이다.
요약 및 결론
우리나라의 경우 그룹I과 그룹II를 사용하여 가공한 식품에도 산업적 성분 및 식품첨가물이 함유되어 기존 연구문헌에서 제시하고 있는 기준을 그대로 적용하는데 한계가 있었다. 이에 본 연구에서는 우리나라 식품에 적용할 수 있는 초가공식품의 분류 기준을 원식품의 특성 보유 여부 및 전통적 섭취 경험 등을 기준으로 한국형 NOVA분류체계를 정립하였다. 2018년 국민건강영양조사의 24시간 회상법 식품섭취자료를 활용하여 한국형 NOVA분류체계로 분류, 구분해 한국인 영양 섭취현황을 분석하였다.
한국인 영양 섭취현황을 분석한 결과 우리의 식생활에서 열량의 대부분은 그룹I(52.7%)에서 기인하였고 그룹IV인 초가공식품(29.3%)이 뒤를 이었다. 이는 그룹IV에서 기인하는 열량 비율이 높은 미국, 캐나다 등과는 대비되는 결과로 우리의 식생활이 아직은 서구 식단에 비해 초가공식품의 섭취가 적은 것으로 확인되었다. 그러나 젊은 연령층에서 점차 식습관이 서구화됨에 따라 주의할 필요가 있다. 나트륨과 당류의 경우 모든 연령에서「2020 한국인 영양소 섭취기준」(보건복지부, 2020)에서 제시한 적정량보다 많이 섭취하는 것으로 조사되었다. 특히 1-19세, 20-30대는 나트륨과 당류 모두 그룹IV로부터 기인한 섭취량이 가장 높았고, 40-50대, 60세 이상은 그룹III에서 기인한 나트륨섭취량이 가장 높았다.
초가공식품의 섭취가 비감염성질환으로 이어질 수 있는 성인들의 섭취현황을 자세히 보기 위해 초가공식품 섭취량에 따라 네 그룹으로 나누어 본 결과 연령이 낮을수록, 여성보다는 남성이 초가공식품을 더 많이 섭취하는 것을 알 수 있었다. 또한 초가공식품 섭취량이 많을수록 열량과 당류, 지방, 포화지방, 나트륨 섭취량은 증가 추세를, 탄수화물, 단백질, 식이섬유의 섭취량은 감소추세를 보였다.
현재 가공식품과 초가공식품의 섭취가 증가하고 이로 인한 식사의 질 저하, 비감염성질환 발병, 정신질환 등의 문제가 야기되고 있다. 또한 나트륨 및 당류의 섭취량 저감은 비감염성질환 예방 및 관리를 목적으로 하고 있으므로 이들 영양소의 섭취 저감화는 체중증가 및 비만예방을 감안한 보건정책의 큰 틀에서 이루어져야 한다. 따라서 단순히 영양소 함량이 낮은 식품 선택 이외에 가공수준을 고려한 식품 선택을 중심으로 한 식생활 실천을 고려해야 할 시점인 것으로 보여진다. 현재 우리의 식생활은 많은 변화가 있다고 여겨지지만 미국 등 서구에 비해서는 초가공식품 섭취 수준이 낮고 음식을 조리하여 섭취하는 식생활 행태가 아직까지 유지되고 있으므로 이를 계속적으로 유지하고 이를 활용한 식생활 관련 비감염성질환 예방·관리에 힘써야 할 것으로 사료된다. 또한, 음식을 조리하여 섭취하는 식생활 행태와 초가공식품의 사용 증가는 대체적 관계로 진행되고 있으므로 초가공식품에서 기인하는 나트륨 및 당류, 그리고 열량 섭취에 더욱 많은 관심이 필요한 것으로 사료된다.
Notes
Ethics Statement:The informed written consent was obtained from each participant. The study protocol was approved by the Institutional Review Board of Korea Disease Control and Prevention Agency (approval number: 2018-01-03-P-A) and was exempted from IRB review based on Bioethics and Safety Act in 2016 and 2017.
Conflict of Interest:There are no financial or other issues that might lead to conflict of interest.
Funding:This research was supported by a grant from the National Food Safety Information Service (2020).
References
-
World Health Organization (WHO). World health statistics 2022: Monitoring health for the SDGs, sustainable development goals. Geneva: World Health Organization; 2022. pp. 21-23.
-
-
World Health Organization (WHO). Diet, nutrition and the prevention of chronic diseases: Report of a joint WHO/FAO expert consultation. Geneva: World Health Organization; 2003. pp. 54-60.
-
-
Pan American Health Organization (PAHO). Noncommunicable diseases and mental health. Ultra-processed food and drink products in Latin America: Trends, impact on obesity, policy implications. Washington, D.C.: PAHO; 2015. pp. 1-10.
-
-
Monteiro CA, Moubarac JC, Cannon G, Ng SW, Popkin B. Ultra-processed products are becoming dominant in the global food system. Obes Rev 2013;14(2):21–28.
-
-
Monteiro CA, Cannon G, Levy R, Moubarac JC, Jaime P, Martins AP, et al. NOVA. The star shines bright: Food classification. Public health. World Nutr 2016;7(1-3):28–38.
-
-
Pan American Health Organization (PAHO). Ultra-processed food and drink products in Latin America: Sales, sources, nutrient profiles, and policy implications. Washington, D.C.: PAHO; 2019. pp. 1-4.
-
-
Monteiro CA, Cannon G, Lawrence M, Louzada ML, Machado P. In: Ultra-processed foods, diet quality, and health using the NOVA classification system. Rome: FAO; 2019. pp. 3-12.
-
-
Martins APB, Levy RB, Claro RM, Moubarac JC, Monteiro CA. Increased contribution of ultra-processed food products in the Brazilian diet (1987-2009). Revista Saude Publica 2013;47(4):656–665.
-
-
de Lacerda AT, do Carmo AS, Maia de Sousa T, dos Santos LC. NOVA food groups’ consumption associated with nutrient intake profile of school children aged 8–12 years. Public Health Nutr 2022;21:1–7.
-
-
Yun GS. A study on the development of fresh-cut foods by changing food culture. Food Preserv Process Ind 2014;13(1):26–31.
-
-
Ha AW, Kim WK. The food and nutrient intakes from daily processed food in Korean adults: Based on the 6th Korea National Health and Nutrition Examination Survey data (2013 ~ 2015). J Nutr Health 2019;52(5):422–434.
-
-
Aguayo-Patrón SV, Calderón de la Barca AM. Old fashioned vs. ultra-processed-based current diets: Possible implication in the increased susceptibility to type 1 diabetes and celiac disease in childhood. Foods 2017;6(11):100
-
-
Moubarac JC, Batal M, Louzada ML, Martinez Steele E, Monteiro CA. Consumption of ultra-processed foods predicts diet quality in Canada. Appetite 2017;1(108):512–520.
-
-
Park GJ. Determining of risk ranking for processed foods in Korea. J Food Hyg Saf 2009;24(3):200–203.
-
-
Lee DH, Park JS, Park SH. Policy information 2 – Korea Food Code explanation and food standards and measures advanced plan. Food Ind 2010;214:58–72.
-
-
Steele EM, Baraldi LG, Louzada ML, Moubarac JC, Mozaffarian D, Monteiro CA. Ultra-processed foods and added sugars in the US diet: Evidence from a nationally representative cross-sectional study. BMJ Open 2016;6(3):e009892
-
-
Ha AW, Kim WK. The food and nutrient intakes from daily processed food in Korean adults: Based on the 6th Korea National Health and Nutrition Examination Survey data (2013 ~ 2015). J Nutr Health 2019;52(5):422–434.
-
-
Lee HD, Ahn BI. Determinants of the consumption of private brand and convenience food. Korean J Agric Manage Policy 2016;43(2):260–286.
-
-
Min JH. In: Analysis on dietary related factors by sodium intake in adults - Using the data from 2007, 2008 Korean National Health and Nutrition Survey [master's thesis]. Cheonan: Dankook University; 2010.
-
-
Grzymisławska M, Puch EA, Zawada A, Grzymisławski M. Do nutritional behaviors depend on biological sex and cultural gender? Adv Clin Exp Med 2020;29(1):165–172.
-
-
Steele EM, Juul F, Neri D, Rauber F, Monteiro CA. Dietary share of ultra-processed foods and metabolic syndrome in the US adult population. Prev Med 2019;125:40–48.
-
 Cite
Cite- Related articles
-
- Ultra-processed food intake and dietary behaviors in Korean adolescents: a cross-sectional study based on the 2019–2023 Korea National Health and Nutrition Examination Survey
- The dietary factors associated with sleep duration in postmenopausal middle-aged women: a cross-sectional study using 2019–2023 Korea National Health and Nutrition Examination Survey data
- Analysis of the relationship between sugar intake and cancer prevalence: a cross-sectional study using the 8th Korea National Health and Nutrition Examination Survey
- Trends in growth and nutritional status of Korean toddlers and preschoolers: a cross-sectional study using 2010–2021 Korea National Health and Nutrition Examination Survey data


