
Articles
- Page Path
- HOME > Korean J Community Nutr > Volume 30(3); 2025 > Article
-
Research Article
- The dietary factors associated with sleep duration in postmenopausal middle-aged women: a cross-sectional study using 2019–2023 Korea National Health and Nutrition Examination Survey data
-
Eugene Shim†

-
Korean Journal of Community Nutrition 2025;30(3):197-213.
DOI: https://doi.org/10.5720/kjcn.2025.00052
Published online: June 30, 2025
Assistant Professor, Department of Food and Nutrition, Soongeui Women’s University, Seoul, Korea
- †Corresponding author: Eugene Shim Department of Food and Nutrition, Soongeui Women’s University, 10 Sopa-ro 2-gil, Jung-gu, Seoul 04628, Korea Tel: +82-2-3708-9263 Fax: +82-2-773-2625 Email: eugeneshim@sewu.ac.kr
• Received: February 24, 2025 • Revised: April 27, 2025 • Accepted: May 17, 2025
© 2025 The Korean Society of Community Nutrition
This is an Open-Access article distributed under the terms of the Creative Commons Attribution Non-Commercial License (http://creativecommons.org/licenses/by-nc/3.0) which permits unrestricted non-commercial use, distribution, and reproduction in any medium, provided the original work is properly cited.
- 4,760 Views
- 65 Download
Abstract
-
Objectives
- This study aimed to analyze dietary factors associated with sleep duration in postmenopausal middle-aged women using data from the Korea National Health and Nutrition Examination Survey (KNHANES), with particular emphasis on the postmenopausal period.
-
Methods
- A total of 3,040 postmenopausal women aged 40–64 years from the 2019–2023 KNHANES were included. Sleep duration was classified into four categories: “appropriate sleep duration” (ASD; 7–9 hours), “short sleep duration” (6–7 hours), “very short sleep duration” (VSSD; < 6 hours), and “long sleep duration” (LSD; > 9 hours). Nutrient and food intake were compared among groups using analysis of covariance. Multinomial logistic and polynomial regression models assessed associations, adjusting for demographic and health covariates.
-
Results
- The VSSD group had higher body mass index and waist circumference than the ASD group, despite lower total energy intake, and also consumed more snack energy and skipped breakfast and dinner more often. This group also had lower intakes of monounsaturated fatty acids and nuts and seeds. In the late menopausal group, greater consumption of cereal grains, fish and shellfish, and beverages was associated with elevated LSD risk. Conversely, higher folate intake in the early menopausal group was inversely associated with VSSD risk. Cholesterol intake was positively associated with LSD risk in both groups. A negative nonlinear association between sleep duration and dietary intake was observed in the early menopausal group when polyunsaturated fatty acid intake exceeded 19.86 g/day and riboflavin intake exceeded 1.76 mg/day. In the late menopausal group, riboflavin intake was strongly correlated with increased LSD risk (odds ratio = 4.776, P = 0.004). Sugar and beverage intake showed a positive linear relationship with sleep duration at average intake levels.
-
Conclusion
- Dietary factors associated with sleep duration differed by postmenopausal period, with specific nutrients and food groups exhibiting variable associations with sleep duration above mean intake levels.
INTRODUCTION
METHODS
RESULTS
DISCUSSION
-
CONFLICT OF INTEREST
There are no financial or other issues that might lead to conflict of interest.
-
FUNDING
This research was supported by a 2023 Academic Research Grant of Soongeui Women’s University.
-
DATA AVAILABILITY
Data supporting the findings of this study are openly available in the KNHANES at https://knhanes.kdca.go.kr/knhanes/main.do.
NOTES
Fig. 1.
Final study population derivation process.
1)Year 1 (2022) and 2 (2023).
2)Postmenopausal period data missing for two participants.
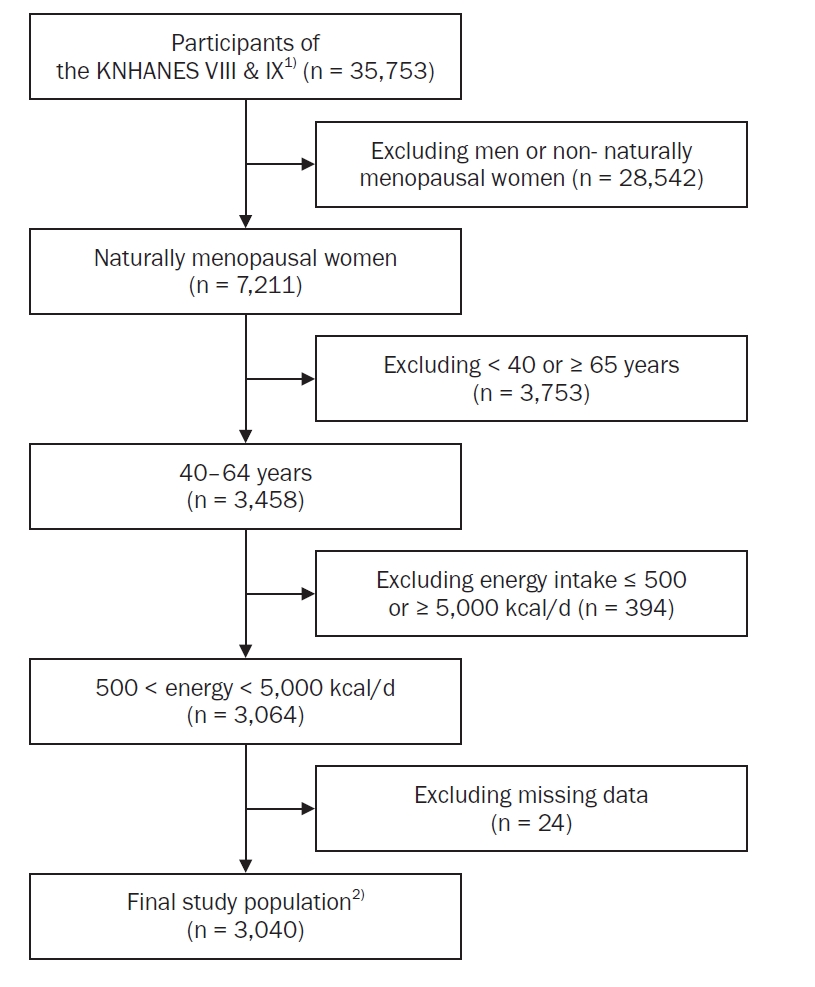
Table 1.General characteristics according to sleep duration categories
| Characteristics | Total (n = 3,040) | VSSD (n = 585) | SSD (n = 829) | ASD (n = 1,570) | LSD (n = 56) | P-value |
|---|---|---|---|---|---|---|
| Age group (year) | 0.533 | |||||
| 40–49 | 88 (2.9) | 15 (2.6) | 22 (2.7) | 50 (3.2) | 1 (1.8) | |
| 50–59 | 1,721 (56.6) | 322 (55.0) | 485 (58.5) | 887 (56.5) | 27 (48.2) | |
| 60–64 | 1,231 (40.5) | 248 (42.4) | 322 (38.8) | 633 (40.3) | 28 (50.0) | |
| Postmenopausal period | 0.071 | |||||
| Early postmenopause1) | 1,448 (47.7) | 250 (42.7) | 404 (48.7) | 767 (48.9) | 27 (48.2) | |
| Late postmenopause2) | 1,590 (52.3) | 335 (57.3) | 425 (51.3) | 801 (51.1) | 29 (51.8) | |
| Education level | < 0.001 | |||||
| Up to elementary school | 406 (13.4) | 108 (18.5) | 85 (10.3) | 200 (12.7) | 13 (23.2) | |
| Middle school graduate | 465 (15.3) | 106 (18.1) | 132 (15.9) | 215 (13.7) | 12 (21.4) | |
| High school graduate | 1,362 (44.8) | 253 (43.2) | 369 (44.5) | 719 (45.8) | 21 (37.5) | |
| College or above | 807 (26.5) | 118 (20.2) | 243 (29.3) | 436 (27.8) | 10 (17.9) | |
| Household income | 0.006 | |||||
| Low | 365 (12.0) | 85 (14.5) | 87 (10.5) | 181 (11.5) | 12 (21.4) | |
| Lower middle | 768 (25.3) | 158 (27.0) | 212 (25.6) | 383 (24.4) | 15 (26.8) | |
| Upper middle | 845 (27.8) | 171 (29.2) | 212 (25.6) | 447 (28.5) | 15 (26.8) | |
| High | 1,062 (34.9) | 171 (29.2) | 318 (38.4) | 559 (35.6) | 14 (25.0) | |
| Economic participation | 0.624 | |||||
| Employed | 1,740 (57.2) | 338 (57.8) | 483 (58.3) | 891 (56.8) | 28 (50.0) | |
| Unemployed or non- economically active | 1,300 (42.8) | 247 (42.2) | 346 (41.7) | 679 (43.2) | 28 (50.0) | |
| Current drinking status | 0.739 | |||||
| Non-drinker | 1,975 (65.0) | 379 (64.8) | 527 (63.6) | 1,031 (65.7) | 38 (67.9) | |
| Drinker | 1,065 (35.0) | 206 (35.2) | 302 (36.4) | 539 (34.3) | 18 (32.1) | |
| Current smoking status | 0.089 | |||||
| Non-smoker | 2,928 (96.3) | 555 (94.9) | 795 (95.9) | 1523 (97.0) | 55 (98.2) | |
| Smoker | 112 (3.7) | 30 (5.1) | 34 (4.1) | 47 (3.0) | 1 (1.8) | |
| Aerobic physical activity status | 0.274 | |||||
| Participation | 1,765 (58.0) | 328 (56.1) | 500 (60.3) | 898 (57.2) | 36 (64.3) | |
| Non-participation | 1,278 (42.0) | 257 (43.9) | 329 (39.7) | 672 (42.8) | 20 (35.7) |
Table 2.Health indicators according to sleep duration categories
| Characteristics | Total (n = 3,040) | VSSD (n = 585) | SSD (n = 829) | ASD (n = 1,570) | LSD (n = 56) | P-value |
|---|---|---|---|---|---|---|
| BMI (kg/m2) | 23.8 ± 0.08 | 24.2 ± 0.18a | 23.6 ± 0.12b | 23.7 ± 0.10b | 23.5 ± 0.65ab | 0.022 |
| WC (cm) | 81.4 ± 0.21 | 82.7 ± 0.49a | 81.1 ± 0.34b | 81.2 ± 0.28b | 80.6 ± 1.82ab | 0.040 |
| SBP (mmHg) | 118.8 ± 0.34 | 119.4 ± 0.73 | 118.5 ± 0.63 | 118.9 ± 0.48 | 117.2 ± 2.78 | 0.769 |
| DBP (mmHg) | 75.0 ± 0.20 | 75.6 ± 0.43 | 74.7 ± 0.36 | 74.9 ± 0.28 | 76.2 ± 1.56 | 0.353 |
| FBG (mg/dL) | 101.2 ± 0.47 | 102.3 ± 0.90 | 100.4 ± 0.65 | 101.0 ± 0.72 | 106.6 ± 5.23 | 0.237 |
| HbA1c (%) | 5.8 ± 0.02 | 5.9 ± 0.04a | 5.8 ± 0.02b | 5.8 ± 0.03b | 6.1 ± 0.23ab | 0.022 |
| Total cholesterol (mg/dL) | 202.1 ± 0.88 | 199.9 ± 1.91 | 203.4 ± 1.54 | 202.5 ± 1.17 | 189.2 ± 6.63 | 0.093 |
| HDL-chol (mg/dL) | 58.7 ± 0.31 | 59.7 ± 0.71a | 59.6 ± 0.56a | 57.9 ± 0.41b | 56.8 ± 2.00ab | 0.030 |
| LDL-chol (mg/dL) | 122.9 ± 1.20 | 117.3 ± 2.54b | 125.6 ± 2.22a | 124.0 ± 1.59a | 107.6 ± 7.62c | 0.014 |
| TG (mg/dL) | 116.7 ± 1.40 | 116.9 ± 3.31 | 113.6 ± 2.49 | 118.2 ± 1.96 | 117.0 ± 12.46 | 0.530 |
Mean ± SE.
Analysis of variance.
VSSD, very short sleep duration (< 6 hours); SSD, short sleep duration (6–7 hours); ASD, appropriate sleep duration (7–9 hours); LSD, long sleep duration (> 9 hours); BMI, body mass index; WC, waist circumference; SBP, systolic blood pressure; DBP, diastolic blood pressure; FBG, fasting blood glucose; HbA1c, glycated hemoglobin; HDL-chol, high-density lipoprotein-cholesterol; LDL-chol, low-density lipoprotein-cholesterol; TG, triglyceride.
a–cDifferent letters indicate statistically significant differences according to the Tukey test.
Table 3.Meal skipping according to sleep duration categories
Table 4.Energy intake by meal according to sleep duration categories
| Meal |
Model 1 |
P-value |
Model 2 |
P-value | ||||||
|---|---|---|---|---|---|---|---|---|---|---|
| VSSD (n = 585) | SSD (n = 829) | ASD (n = 1,570) | LSD (n = 56) | VSSD (n = 585) | SSD (n = 829) | ASD (n = 1,570) | LSD (n = 56) | |||
| Breakfast | 305.2 ± 9.66b | 320.0 ± 7.72ab | 330.8 ± 6.03a | 270.4 ± 30.57ab | 0.014 | 303.4 ± 17.09 | 315.6 ± 15.96 | 325.0 ± 16.21 | 259.8 ± 46.43 | 0.169 |
| Lunch | 452.2 ± 12.14 | 474.5 ± 11.05 | 481.1 ± 7.58 | 476.2 ± 41.71 | 0.145 | 446.8 ± 20.74 | 442.6 ± 19.79 | 449.4 ± 20.21 | 439.8 ± 49.28 | 0.957 |
| Dinner | 448.4 ± 12.71b | 477.1 ± 10.37a | 477.8 ± 7.35a | 462.0 ± 41.91ab | 0.046 | 494.5 ± 21.23 | 510.8 ± 20.03 | 512.1 ± 19.02 | 526.1 ± 49.59 | 0.612 |
| Snacks | 319.1 ± 14.03 | 317.8 ± 10.80 | 314.3 ± 7.53 | 354.7 ± 64.61 | 0.643 | 343.6 ± 20.52a | 319.2 ± 18.72ab | 301.7 ± 18.39b | 362.6 ± 46.71ab | 0.033 |
Model 1, mean ± SE, analysis of variance; Model 2, weighed mean ± SE, analysis of covariance adjusted for age, education level, household income, current drinking and smoking status, body mass index, systolic blood pressure, high-density lipoprotein-cholesterol, glycated hemoglobin, and total energy intake.
VSSD, very short sleep duration (< 6 hours); SSD, short sleep duration (6–7 hours); ASD, appropriate sleep duration (7–9 hours); LSD, long sleep duration (> 9 hours).
a,bDifferent letters indicate a significant difference.
Table 5.Energy and nutrient intake according to sleep duration categories
| Nutrients |
Model 1 |
P-value |
Model 2 |
P-value | ||||||
|---|---|---|---|---|---|---|---|---|---|---|
| VSSD (n = 585) | SSD (n = 829) | ASD (n = 1,570) | LSD (n = 56) | VSSD (n = 585) | SSD (n = 829) | ASD (n = 1,570) | LSD (n = 56) | |||
| Total energy intake (kcal/day)1) | 1,498.1 ± 29.08b | 1,588.5 ± 21.46a | 1,610.8 ± 16.22a | 1,588.5 ± 97.49ab | 0.008 | 1,497.1 ± 40.98b | 1,569.1 ± 38.85ab | 1,593.5 ± 36.28a | 1,587.7 ± 104.97ab | 0.037 |
| Carbohydrate (%) | 64.4 ± 0.51a | 62.5 ± 0.43b | 62.8 ± 0.30b | 64.7 ± 1.60ab | 0.005 | 64.0 ± 0.87 | 62.7 ± 0.82 | 62.8 ± 0.82 | 62.9 ± 1.94 | 0.135 |
| Protein (%) | 15.0 ± 0.19 | 15.3 ± 0.16 | 15.1 ± 0.11 | 14.7 ± 0.67 | 0.623 | 15.4 ± 0.32 | 15.5 ± 0.29 | 15.4 ± 0.28 | 15.2 ± 0.73 | 0.915 |
| Fat (%) | 20.6 ± 0.42b | 22.2 ± 0.34a | 22.0 ± 0.24a | 20.6 ± 1.37ab | 0.001 | 20.6 ± 0.67 | 21.7 ± 0.62 | 21.8 ± 0.62 | 21.9 ± 1.67 | 0.058 |
| Carbohydrate (g/day) | 237.9 ± 4.78 | 243.7 ± 3.75 | 247.7 ± 2.53 | 249.5 ± 16.43 | 0.289 | 238.7 ± 4.08 | 234.5 ± 3.81 | 233.4 ± 3.84 | 236.0 ± 8.92 | 0.191 |
| Dietary Fiber (g/day) | 25.2 ± 0.65 | 26.4 ± 0.52 | 26.8 ± 0.39 | 24.7 ± 1.85 | 0.125 | 23.9 ± 0.63 | 23.6 ± 0.60 | 23.6 ± 0.55 | 21.7 ± 1.73 | 0.617 |
| Sugars (g/day) | 56.3 ± 2.03 | 58.8 ± 1.80 | 61.8 ± 1.21 | 63.8 ± 6.27 | 0.067 | 54.7 ± 2.23 | 52.6 ± 2.13 | 54.8 ± 1.90 | 58.7 ± 6.19 | 0.520 |
| Protein (g/day) | 56.0 ± 1.26b | 60.0 ± 1.04a | 60.3 ± 0.77a | 56.3 ± 3.65ab | 0.017 | 57.9 ± 1.21 | 58.2 ± 1.19 | 57.8 ± 1.16 | 54.22 ± 2.57 | 0.453 |
| Fat (g/day) | 34.7 ± 1.09b | 39.8 ± 0.89a | 40.7 ± 0.73a | 39.2 ± 4.09ab | < 0.001 | 36.6 ± 1.18 | 38.0 ± 1.11 | 38.5 ± 1.10 | 38.8 ± 3.47 | 0.152 |
| SFA (g/day) | 10.6 ± 0.40b | 11.9 ± 0.31a | 12.4 ± 0.26a | 11.8 ± 1.46ab | 0.003 | 11.4 ± 0.50 | 11.6 ± 0.44 | 12.0 ± 0.46 | 12.0 ± 1.37 | 0.361 |
| MUFA (g/day) | 10.8 ± 0.36b | 12.7 ± 0.32a | 13.1 ± 0.28a | 13.3 ± 1.67ab | < 0.001 | 11.7 ± 0.46b | 12.3 ± 0.45ab | 12.7 ± 0.45a | 13.5 ± 1.53ab | 0.017 |
| PUFA (g/day) | 9.6 ± 0.36b | 11.0 ± 0.26a | 10.8 ± 0.20a | 9.8 ± 0.97ab | 0.015 | 9.5 ± 0.34 | 10.0 ± 0.29 | 9.6 ± 0.26 | 8.8 ± 0.83 | 0.312 |
| n-3 Fatty acids (g/day) | 1.7 ± 0.08 | 1.9 ± 0.07 | 1.8 ± 0.05 | 1.7 ± 0.24 | 0.182 | 1.6 ± 0.13 | 1.7 ± 0.13 | 1.6 ± 0.13 | 1.4 ± 0.29 | 0.314 |
| n-6 Fatty acids (g/day) | 7.9 ± 0.31b | 9.1 ± 0.22a | 8.9 ± 0.17a | 8.1 ± 0.81ab | 0.013 | 7.9 ± 0.30 | 8.2 ± 0.25 | 8.0 ± 0.23 | 7.4 ± 0.66 | 0.432 |
| Cholesterol (mg/day) | 209.8 ± 8.49 | 227.5 ± 6.58 | 225.4 ± 4.79 | 223.1 ± 31.66 | 0.359 | 219.4 ± 11.03 | 219.6 ± 10.61 | 218.1 ± 10.47 | 228.8 ± 29.58 | 0.982 |
| Calcium (mg/day) | 489.2 ± 14.93 | 491.9 ± 10.37 | 503.9 ± 8.04 | 481.1 ± 45.82 | 0.700 | 468.2 ± 16.25 | 439.6 ± 13.35 | 449.0 ± 12.80 | 442.4 ± 47.58 | 0.355 |
| Phosphorus (mg/day) | 928.1 ± 19.36 | 966.1 ± 14.36 | 975.0 ± 10.92 | 923.9 ± 54.40 | 0.163 | 936.0 ± 17.05 | 915.8 ± 16.06 | 914.5 ± 15.53 | 873.9 ± 47.52 | 0.238 |
| Sodium (mg/day) | 2,697.8 ± 76.80 | 2,809.0 ± 59.77 | 2,798.4 ± 44.59 | 2,655.3 ± 263.85 | 0.613 | 2,713.2 ± 76.14 | 2,676.8 ± 72.44 | 2,629.4 ± 63.32 | 2,514.9 ± 199.37 | 0.571 |
| Potassium (mg/day) | 2,713.8 ± 67.50 | 2,789.4 ± 46.64 | 2,787.0 ± 34.08 | 2,647.1 ± 162.43 | 0.642 | 2,644.0 ± 59.49a | 2,555.6 ± 55.24ab | 2,510.7 ± 51.18b | 2,409.4 ± 158.86ab | 0.045 |
| Iron (mg/day) | 9.3 ± 0.26 | 9.6 ± 0.22 | 9.7 ± 0.16 | 10.1 ± 1.07 | 0.547 | 9.1 ± 0.27 | 8.8 ± 0.27 | 8.8 ± 0.22 | 9.5 ± 1.08 | 0.674 |
| Vitamin A (μgRAE/day) | 394.7 ± 15.94 | 396.7 ± 12.08 | 409.8 ± 9.66 | 430.8 ± 95.55 | 0.780 | 378.9 ± 19.65 | 353.3 ± 18.02 | 361.3 ± 16.99 | 402.7 ± 103.71 | 0.617 |
| Thiamin (mg/day) | 1.0 ± 0.03 | 1.0 ± 0.02 | 1.1 ± 0.02 | 0.9 ± 0.06 | 0.118 | 1.0 ± 0.04 | 1.0 ± 0.04 | 1.0 ± 0.04 | 0.9 ± 0.07 | 0.190 |
| Riboflavin (mg/day) | 1.4 ± 0.04 | 1.4 ± 0.02 | 1.5 ± 0.02 | 1.5 ± 0.12 | 0.351 | 1.4 ± 0.05 | 1.3 ± 0.05 | 1.3 ± 0.05 | 1.5 ± 0.11 | 0.249 |
| Niacin (mg/day) | 10.3 ± 0.29 | 10.6 ± 0.21 | 10.9 ± 0.16 | 10.7 ± 0.79 | 0.374 | 10.9 ± 0.29 | 10.5 ± 0.26 | 10.6 ± 0.25 | 10.6 ± 0.72 | 0.542 |
| Folate (μg DFE/day) | 320.2 ± 8.26 | 331.6 ± 5.73 | 332.7 ± 4.80 | 324.1 ± 31.21 | 0.619 | 310.3 ± 8.63 | 303.8 ± 7.37 | 301.3 ± 7.17 | 299.2 ± 34.21 | 0.672 |
| Vitamin C (mg/day) | 82.2 ± 5.37 | 74.1 ± 2.76 | 75.8 ± 2.41 | 87.3 ± 23.48 | 0.569 | 75.1 ± 6.02 | 61.8 ± 3.99 | 61.6 ± 3.88 | 77.6 ± 24.48 | 0.117 |
| Water (g/day) | 947.3 ± 28.37 | 1,003.6 ± 20.03 | 992.8 ± 14.77 | 921.9 ± 80.21 | 0.354 | 911.4 ± 29.11 | 896.3 ± 24.56 | 877.2 ± 24.88 | 825.2 ± 61.73 | 0.381 |
Mode1 1, mean ± SE, analysis of variance; mode1 2, weighed mean ± SE, analysis of covariance adjusted for age, education level, household income, current drinking and smoking status, body mass index, systolic blood pressure, high-density lipoprotein-cholesterol, glycated hemoglobin, and total energy intake.
VSSD, very short sleep duration (< 6 hours); SSD, short sleep duration (6–7 hours); ASD, appropriate sleep duration (7–9 hours); LSD, long sleep duration (> 9 hours); SFA, saturated fatty acids; MUFA, monounsaturated fatty acids; PUFA, polyunsaturated fatty acids.
1)Total energy intake excluded from adjusted variables in model 2.
a,bDifferent letters indicate a significant difference.
Table 6.Food group intake by sleep duration category
| Food Groups1) |
Model 1 |
P-value |
Model 2 |
P-value | ||||||
|---|---|---|---|---|---|---|---|---|---|---|
| VSSD (n = 585) | SSD (n = 829) | ASD (n = 1,570) | LSD (n = 56) | VSSD (n = 585) | SSD (n = 829) | ASD (n = 1,570) | LSD (n = 56) | |||
| Cereal grains | 212.2 ± 5.38 | 222.3 ± 4.84 | 218.9 ± 3.03 | 242.2 ± 30.30 | 0.417 | 214.2 ± 6.94 | 219.0 ± 6.36 | 211.1 ± 6.19 | 237.3 ± 24.52 | 0.310 |
| Potatoes & starchy foods | 52.7 ± 5.33 | 46.7 ± 3.80 | 43.5 ± 2.52 | 29.0 ± 8.99 | 0.232 | 47.4 ± 5.83a | 35.9 ± 4.52ab | 33.4 ± 3.94b | 19.7 ± 10.29b | 0.046 |
| Sweeteners | 6.3 ± 0.47 | 6.4 ± 0.39 | 7.8 ± 0.42 | 9.2 ± 2.05 | 0.106 | 6.9 ± 0.76 | 5.8 ± 0.59 | 7.2 ± 0.64 | 9.2 ± 2.62 | 0.065 |
| Pulses | 45.5 ± 3.93 | 48.2 ± 3.17 | 44.5 ± 2.05 | 49.4 ± 17.29 | 0.805 | 40.5 ± 4.82 | 42.5 ± 4.56 | 38.6 ± 4.07 | 27.0 ± 15.22 | 0.642 |
| Nuts & seeds | 8.4 ± 1.03b | 7.4 ± 0.80b | 11.8 ± 1.04a | 9.6 ± 3.77ab | 0.020 | 5.2 ± 1.13 | 4.2 ± 1.19 | 8.4 ± 0.98 | 6.3 ± 3.47 | 0.066 |
| Vegetables | 301.1 ± 9.87 | 307.3 ± 7.18 | 306.1 ± 4.96 | 268.2 ± 24.10 | 0.087 | 296.8 ± 12.67a | 292.6 ± 10.19a | 282.8 ± 9.75ab | 225.9 ± 25.72b | 0.038 |
| Mushrooms | 7.5 ± 1.05 | 6.9 ± 0.90 | 6.3 ± 0.54 | 6.7 ± 3.74 | 0.823 | 8.1 ± 1.94 | 6.6 ± 1.84 | 6.6 ± 1.87 | 5.8 ± 3.37 | 0.732 |
| Fruits | 201.0 ± 14.25 | 208.4 ± 8.66 | 221.5 ± 6.84 | 236.0 ± 47.25 | 0.235 | 157.5 ± 14.62 | 156.7 ± 13.97 | 166.0 ± 11.16 | 162.0 ± 43.37 | 0.903 |
| Seaweeds | 19.2 ± 3.54 | 19.0 ± 2.24 | 17.7 ± 1.52 | 11.1 ± 2.80 | 0.674 | 19.3 ± 4.71 | 14.7 ± 2.75 | 13.6 ± 2.23 | 8.4 ± 5.98 | 0.521 |
| Meats | 65.2 ± 4.00b | 73.6 ± 3.85ab | 74.6 ± 2.51a | 47.9 ± 8.83ab | 0.044 | 71.1 ± 6.73 | 76.8 ± 6.56 | 77.3 ± 6.58 | 56.5 ± 13.61 | 0.282 |
| Eggs | 34.5 ± 1.92 | 36.9 ± 1.57 | 35.2 ± 1.14 | 27.1 ± 5.47 | 0.312 | 31.6 ± 2.55 | 33.0 ± 2.43 | 30.8 ± 2.25 | 26.9 ± 7.20 | 0.672 |
| Fish & shellfish | 66.3 ± 5.21 | 75.1 ± 4.41 | 73.0 ± 2.77 | 87.9 ± 14.95 | 0.806 | 74.4 ± 7.92 | 74.5 ± 6.69 | 69.6 ± 5.40 | 92.0 ± 24.67 | 0.667 |
| Dairy products | 90.8 ± 6.64 | 88.1 ± 4.84 | 99.1 ± 4.04 | 88.9 ± 17.20 | 0.210 | 89.2 ± 12.02 | 71.0 ± 8.93 | 84.6 ± 9.41 | 101.9 ± 32.36 | 0.117 |
| Fats & oils | 5.0 ± 0.27 | 5.9 ± 0.26 | 5.7 ± 0.19 | 5.0 ± 1.04 | 0.186 | 5.0 ± 0.33 | 5.2 ± 0.32 | 4.9 ± 0.30 | 4.7 ± 1.10 | 0.829 |
| Beverages | 152.9 ± 10.91 | 175.4 ± 8.81 | 156.3 ± 6.42 | 160.3 ± 31.84 | 0.827 | 168.3 ± 20.50 | 160.1 ± 16.40 | 149.3 ± 16.64 | 181.6 ± 45.97 | 0.680 |
| Alcoholic beverages | 26.0 ± 5.15 | 42.1 ± 6.73 | 33.2 ± 3.92 | 37.3 ± 17.61 | 0.112 | 86.8 ± 21.71 | 95.6 ± 21.34 | 97.5 ± 23.09 | 112.4 ± 28.30 | 0.207 |
Model 1, mean ± SE, analysis of variance; model 2, weighed mean ± SE, analysis of covariance adjusted for age, education level, household income, current drinking and smoking status, body mass index, systolic blood pressure, high-density lipoprotein-cholesterol, glycated hemoglobin, and total energy intake.
VSSD, very short sleep duration (< 6 hours); SSD, short sleep duration (6–7 hours); ASD, appropriate sleep duration (7–9 hours); LSD, long sleep duration (> 9 hours).
1)g/day.
a,bDifferent letters indicate a significant difference.
Table 7.Associations of dietary intake with categories of sleep duration by postmenopausal period
| Variable |
VSSD |
SSD |
LSD |
|||
|---|---|---|---|---|---|---|
| OR (95%CI) | P-value | OR (95%CI) | P-value | OR (95%CI) | P-value | |
| Early postmenopause (n = 1,448)1) | ||||||
| Sugars (g/day) | 0.997 (0.986, 1.008) | 0.609 | 1.003 (0.992, 1.013) | 0.593 | 1.030 (1.002, 1.060) | 0.039 |
| Cholesterol (mg/day) | 1.001 (0.998, 1.004) | 0.482 | 1.000 (0.997, 1.002) | 0.721 | 1.009 (1.004, 1.014) | < 0.001 |
| Phosphorus (mg/day) | 1.000 (0.998, 1.002) | 0.953 | 0.999 (0.997, 1.000) | 0.118 | 1.006 (1.001, 1.011) | 0.023 |
| Vitamin A (μgRAE/day) | 0.993 (0.961, 1.027) | 0.697 | 1.015 (0.997, 1.034) | 0.108 | 0.478 (0.256, 0.891) | 0.020 |
| Folate (μg DFE/day) | 0.996 (0.993, 0.999) | 0.010 | 1.000 (0.997, 1.002) | 0.676 | 1.000 (0.993, 1.007) | 0.936 |
| Late postmenopause (n = 1,590)2) | ||||||
| Cholesterol (mg/day) | 1.001 (0.998, 1.004) | 0.624 | 0.998 (0.996, 1.001) | 0.223 | 1.007 (1.002, 1.011) | 0.004 |
| Vitamin A (μgRAE/day) | 0.997 (0.978, 1.016) | 0.748 | 1.005 (0.989, 1.022) | 0.5582 | 1.043 (1.010, 1.078) | 0.011 |
| Riboflavin (mg/day) | 0.694 (0.396, 1.214) | 0.200 | 1.153 (0.741, 1.794) | 0.527 | 4.776 (1.635, 3.951) | 0.004 |
| Water (g/day) | 1.000 (0.998, 1.002) | 0.880 | 1.001 (1.000, 1.003) | 0.106 | 0.994 (0.991, 0.997) | < 0.001 |
| Cereal grains (g/day) | 1.001 (0.998, 1.005) | 0.406 | 1.001 (0.998, 1.004) | 0.505 | 1.015 (1.008, 1.022) | < 0.001 |
| Eggs (g/day) | 1.000 (0.991, 1.010) | 0.982 | 1.005 (0.998, 1.013) | 0.176 | 0.986 (0.972, 1.000) | 0.046 |
| Fish & shellfish (g/day) | 1.000 (0.997, 1.002) | 0.859 | 1.000 (0.997, 1.002) | 0.936 | 1.009 (1.004, 1.014) | < 0.001 |
| Beverages (g/day) | 1.000 (0.998, 1.003) | 0.672 | 0.998 (0.997, 1.000) | 0.098 | 1.005 (1.002, 1.009) | 0.005 |
Multinomial logistic regression relative to appropriate sleep duration (7–9 hours) adjusted for age, education level, household income, current drinking and smoking status, body mass index, systolic blood pressure, high-density lipoprotein-cholesterol, glycated hemoglobin, and total energy intake.
Only variables with significant relationships to sleep duration are shown.
OR, odds ratio; VSSD, very short sleep duration (< 6 hours); SSD, short sleep duration (6–7 hours); LSD, long sleep duration (> 9 hours); CI, confidence interval.
1)< 6 years after menopause.
2)≥ 6 years after menopause.
Table 8.Associations of dietary intake with sleep duration by postmenopausal period
| Variable |
Coefficient |
Inflection point1) | Sleep duration (hr) | |||
|---|---|---|---|---|---|---|
| β1 | P-value | β2 | P-value | |||
| Early postmenopause (n = 1,448)2) | ||||||
| PUFA (g/day) | 0.0240942 | 0.113 | −0.0006068 | 0.049 | 19.86 | 7.19 |
| Riboflavin (mg/day) | 0.3556539 | 0.102 | −0.1009126 | 0.032 | 1.76 | 7.08 |
| Water (g/day) | 0.0008693 | 0.001 | −0.0000004 | < 0.001 | 1,086.63 | 7.19 |
| Alcoholic beverages (g/day) | 0.0013586 | 0.001 | −0.0000008 | 0.001 | 849.13 | 7.52 |
| Late postmenopause (n = 1,590)3) | ||||||
| Sugars (g/day) | 0.0056061 | < 0.001 | −0.0000222 | < 0.001 | 126.33 | 7.01 |
| Sodium (mg/day) | −0.0001268 | 0.014 | 0.0000000 | 0.046 | - | - |
| Fruits (g/day) | 0.0003218 | 0.061 | −0.0000002 | < 0.001 | 804.50 | 6.90 |
| Beverages (g/day) | 0.0006865 | 0.011 | −0.0000007 | < 0.001 | 490.36 | 6.98 |
Polynomial regression analysis adjusted for age, education level, household income, current drinking and smoking status, body mass index, systolic blood pressure, high-density lipoprotein-cholesterol, glycated hemoglobin, and total energy intake.
Only variables with significant relationships to sleep duration are shown.
β1, first-order coefficient; β2, second-order coefficient; PUFA, polyunsaturated fatty acids.
1)−β1 / 2β2.
2)< 6 years after menopause.
3)≥ 6 yr after menopause.
- 1. Hirshkowitz M, Whiton K, Albert SM, Alessi C, Bruni O, DonCarlos L, et al. National Sleep Foundation’s sleep time duration recommendations: methodology and results summary. Sleep Health 2015; 1(1): 40-43. ArticlePubMed
- 2. Koren D, O’Sullivan KL, Mokhlesi B. Metabolic and glycemic sequelae of sleep disturbances in children and adults. Curr Diab Rep 2015; 15(1): 562.ArticlePubMedPMCPDF
- 3. Yoon JE, Oh D, Hwang I, Park JA, Im HJ, Kim D, et al. Longitudinal trends in sleep and related factors among South Korean adults from 2009 to 2018. J Clin Neurol 2023; 19(4): 392-401. ArticlePubMedPMCLink
- 4. Dashti HS, Scheer FA, Jacques PF, Lamon-Fava S, Ordovás JM. Short sleep duration and dietary intake: epidemiologic evidence, mechanisms, and health implications. Adv Nutr 2015; 6(6): 648-659. ArticlePubMedPMC
- 5. Yi M, Fei Q, Chen Z, Zhao W, Liu K, Jian S, et al. Unraveling the associations and causalities between glucose metabolism and multiple sleep traits. Front Endocrinol (Lausanne) 2023; 14: 1227372.ArticlePubMedPMC
- 6. Sherwood A, Routledge FS, Wohlgemuth WK, Hinderliter AL, Kuhn CM, Blumenthal JA. Blood pressure dipping: ethnicity, sleep quality, and sympathetic nervous system activity. Am J Hypertens 2011; 24(9): 982-988. ArticlePubMed
- 7. Kario K. Nocturnal hypertension: new technology and evidence. Hypertension 2018; 71(6): 997-1009. ArticlePubMed
- 8. Shin C, Lee S, Lee T, Shin K, Yi H, Kimm K, et al. Prevalence of insomnia and its relationship to menopausal status in middle-aged Korean women. Psychiatry Clin Neurosci 2005; 59(4): 395-402. ArticlePubMed
- 9. Baker FC, de Zambotti M, Colrain IM, Bei B. Sleep problems during the menopausal transition: prevalence, impact, and management challenges. Nat Sci Sleep 2018; 10: 73-95. ArticlePubMedPMCLink
- 10. Morabia A, Costanza MC. International variability in ages at menarche, first livebirth, and menopause. World Health Organization collaborative study of neoplasia and steroid contraceptives. Am J Epidemiol 1998; 148(12): 1195-1205. ArticlePubMed
- 11. Talaulikar V. Menopause transition: physiology and symptoms. Best Pract Res Clin Obstet Gynaecol 2022; 81: 3-7. ArticlePubMed
- 12. Kravitz HM, Joffe H. Sleep during the perimenopause: a SWAN story. Obstet Gynecol Clin North Am 2011; 38(3): 567-586. ArticlePubMedPMC
- 13. Hachul H, Bittencourt LR, Soares JM Jr, Tufik S, Baracat EC. Sleep in post-menopausal women: differences between early and late post-menopause. Eur J Obstet Gynecol Reprod Biol 2009; 145(1): 81-84. ArticlePubMed
- 14. Nedeltcheva AV, Kilkus JM, Imperial J, Kasza K, Schoeller DA, Penev PD. Sleep curtailment is accompanied by increased intake of calories from snacks. Am J Clin Nutr 2009; 89(1): 126-133. ArticlePubMed
- 15. St-Onge MP, Wolfe S, Sy M, Shechter A, Hirsch J. Sleep restriction increases the neuronal response to unhealthy food in normal-weight individuals. Int J Obes (Lond) 2014; 38(3): 411-416. ArticlePubMedPDF
- 16. Tasali E, Chapotot F, Wroblewski K, Schoeller D. The effects of extended bedtimes on sleep duration and food desire in overweight young adults: a home-based intervention. Appetite 2014; 80: 220-224. ArticlePubMedPMC
- 17. Erdélyi A, Pálfi E, Tűű L, Nas K, Szűcs Z, Török M, et al. The importance of nutrition in menopause and perimenopause-a review. Nutrients 2023; 16(1): 27.ArticlePubMedPMC
- 18. Zhu B, Grandner MA, Jackson NJ, Pien GW, Srimoragot M, Knutson KL, et al. Associations between diet and sleep duration in different menopausal stages. West J Nurs Res 2021; 43(10): 984-994. ArticlePubMedLink
- 19. Nguyen HD. Higher intakes of nutrients and regular drinking are associated with habitual sleep duration in pre- and postmenopausal women with comorbidities. Sleep Health 2023; 9(5): 688-697. ArticlePubMed
- 20. Harlow SD, Gass M, Hall JE, Lobo R, Maki P, Rebar RW, et al.; STRAW 10 Collaborative Group. Executive summary of the stages of reproductive aging workshop + 10: addressing the unfinished agenda of staging reproductive aging. Menopause 2012; 19(4): 387-395. ArticlePubMedPMC
- 21. Doo M, Kim Y. The risk of being obese according to short sleep duration is modulated after menopause in Korean women. Nutrients 2017; 9(3): 206.ArticlePubMedPMC
- 22. Seo YM, Kim HJ, Choi SY. Factors influencing sleep quality in middle-aged social assistance recipient women: utilizing data the 2018 from Korea Community Health Survey. J Korean Pubilc Health Nurs 2024; 38(3): 371-384. Article
- 23. Park JH. Association of health behavior, physical activity, health related quality of life and sleep duration in Korean adults: based on the 8th 2019-2020 Korea National Health and Nutrition Examination Survey. J Korean Soc Oral Health Sci 2022; 10(2): 78-85. Article
- 24. Papadopoulos D, Etindele Sosso FA. Socioeconomic status and sleep health: a narrative synthesis of 3 decades of empirical research. J Clin Sleep Med 2023; 19(3): 605-620. ArticlePubMedPMC
- 25. Chaput JP, Bouchard C, Tremblay A. Change in sleep duration and visceral fat accumulation over 6 years in adults. Obesity (Silver Spring) 2014; 22(5): E9-12. ArticlePubMed
- 26. Sperry SD, Scully ID, Gramzow RH, Jorgensen RS. Sleep duration and waist circumference in adults: a meta-analysis. Sleep 2015; 38(8): 1269-1276. ArticlePubMedPMC
- 27. Bromley LE, Booth JN 3rd, Kilkus JM, Imperial JG, Penev PD. Sleep restriction decreases the physical activity of adults at risk for type 2 diabetes. Sleep 2012; 35(7): 977-984. ArticlePubMedPMC
- 28. Omisade A, Buxton OM, Rusak B. Impact of acute sleep restriction on cortisol and leptin levels in young women. Physiol Behav 2010; 99(5): 651-656. ArticlePubMed
- 29. Ohkuma T, Fujii H, Iwase M, Kikuchi Y, Ogata S, Idewaki Y, et al. Impact of sleep duration on obesity and the glycemic level in patients with type 2 diabetes: the Fukuoka Diabetes Registry. Diabetes Care 2013; 36(3): 611-617. ArticlePubMedPMC
- 30. Williams CJ, Hu FB, Patel SR, Mantzoros CS. Sleep duration and snoring in relation to biomarkers of cardiovascular disease risk among women with type 2 diabetes. Diabetes Care 2007; 30(5): 1233-1240. ArticlePubMedPDF
- 31. Hess JM, Jonnalagadda SS, Slavin JL. What is a snack, why do we snack, and how can we choose better snacks? A review of the definitions of snacking, motivations to snack, contributions to dietary intake, and recommendations for improvement. Adv Nutr 2016; 7(3): 466-475. ArticlePubMedPMC
- 32. Scoditti E, Tumolo MR, Garbarino S. Mediterranean diet on sleep: a health alliance. Nutrients 2022; 14(14): 2998.ArticlePubMedPMC
- 33. Li M, Heizhati M, Wang L, Wang Z, Abudoureyimu R, Yang Z, et al. 24-hour urinary potassium excretion is negatively associated with self-reported sleep quality in the general population, independently of sleep-disordered breathing. J Clin Sleep Med 2022; 18(11): 2589-2596. ArticlePubMedPMC
- 34. Khalid S, Bashir S, Mehboob R, Anwar T, Ali M, Hashim M, et al. Effects of magnesium and potassium supplementation on insomnia and sleep hormones in patients with diabetes mellitus. Front Endocrinol (Lausanne) 2024; 15: 1370733.ArticlePubMedPMC
- 35. Bai C, Guo M, Yao Y, Ji JS, Gu D, Zeng Y. Sleep duration, vegetable consumption and all-cause mortality among older adults in China: a 6-year prospective study. BMC Geriatr 2021; 21(1): 373.ArticlePubMedPMCPDF
- 36. Hachul H, Hachul de Campos B, Lucena L, Tufik S. Sleep during menopause. Sleep Med Clin 2023; 18(4): 423-433. ArticlePubMed
- 37. Auro K, Joensuu A, Fischer K, Kettunen J, Salo P, Mattsson H, et al. A metabolic view on menopause and ageing. Nat Commun 2014; 5: 4708.ArticlePubMedPDF
- 38. Grandner MA, Kripke DF, Naidoo N, Langer RD. Relationships among dietary nutrients and subjective sleep, objective sleep, and napping in women. Sleep Med 2010; 11(2): 180-184. ArticlePubMed
- 39. Rusu A, Ciobanu DM, Inceu G, Craciun AE, Fodor A, Roman G, et al. Variability in sleep timing and dietary intake: a scoping review of the literature. Nutrients 2022; 14(24): 5248.ArticlePubMedPMC
- 40. Kabadayı Demir C, Bayram S, Köse B, Köseler Beyaz E, Yeşil E. Sleep, mood, and nutrition patterns of postmenopausal women diagnosed with major depressive disorder by menopause periods. Life (Basel) 2024; 14(6): 775.ArticlePubMedPMC
- 41. Korea Disease Control and Prevention Agency (KDCA). Korea Health Statistics 2022: Korea National Health and Nutrition Examination Survey (KNHANES Ⅸ-1). KDCA; 2023 Dec. Report No. 11-1790387-000796-10.
- 42. Ministry of Health and Welfare (MOHW), The Korean Nutrition Society. Dietary reference intakes for Koreans 2020. MOHW; 2020.
- 43. Marashly ET, Bohlega SA. Riboflavin has neuroprotective potential: focus on Parkinson’s disease and migraine. Front Neurol 2017; 8: 333.ArticlePubMedPMC
- 44. Murphy RA, Tintle N, Harris WS, Darvishian M, Marklund M, Virtanen JK, et al. PUFA ω-3 and ω-6 biomarkers and sleep: a pooled analysis of cohort studies on behalf of the Fatty Acids and Outcomes Research Consortium (FORCE). Am J Clin Nutr 2022; 115: 864-876. ArticlePubMedPDF
- 45. Gardiner C, Weakley J, Burke LM, Roach GD, Sargent C, Maniar N, et al. The effect of alcohol on subsequent sleep in healthy adults: a systematic review and meta-analysis. Sleep Med Rev 2025; 80: 102030.ArticlePubMed
- 46. Yehuda S, Rabinovitz S, Mostofsky DI. Essential fatty acids and sleep: mini-review and hypothesis. Med Hypotheses 1998; 50(2): 139-145. ArticlePubMed
REFERENCES
Figure & Data
REFERENCES
Citations
Citations to this article as recorded by 
 Cite
Cite- Figure
-
- We recommend
- Related articles
-
- Changing patterns and related factors of kimchi consumption among Korean adults: a nationwide cross-sectional analysis of the Korea National Health and Nutrition Examination Survey, 2010–2024
- Differences in lunch nutrient intake and nutritional adequacy among Korean older adults by meal site: a cross-sectional analysis of the 2018–2021 Korea National Health and Nutrition Examination Survey data
- Association between nutrient intake and frailty status in Korean older adults: a cross-sectional study using the 9th (2022–2023) Korea National Health and Nutrition Examination Survey
- Comparison of dietary behaviors and nutrient intake by gender and household type among older Koreans: a cross-sectional study using data from the 8th Korea National Health and Nutrition Examination Survey
- Prevalence of coronary artery disease according to lifestyle characteristics, nutrient intake level, and comorbidities among Koreans aged 40 years and older: a cross-sectional study using data from the 7th (2016–2018) Korea National Health and Nutrition Examination Survey
The dietary factors associated with sleep duration in postmenopausal middle-aged women: a cross-sectional study using 2019–2023 Korea National Health and Nutrition Examination Survey data
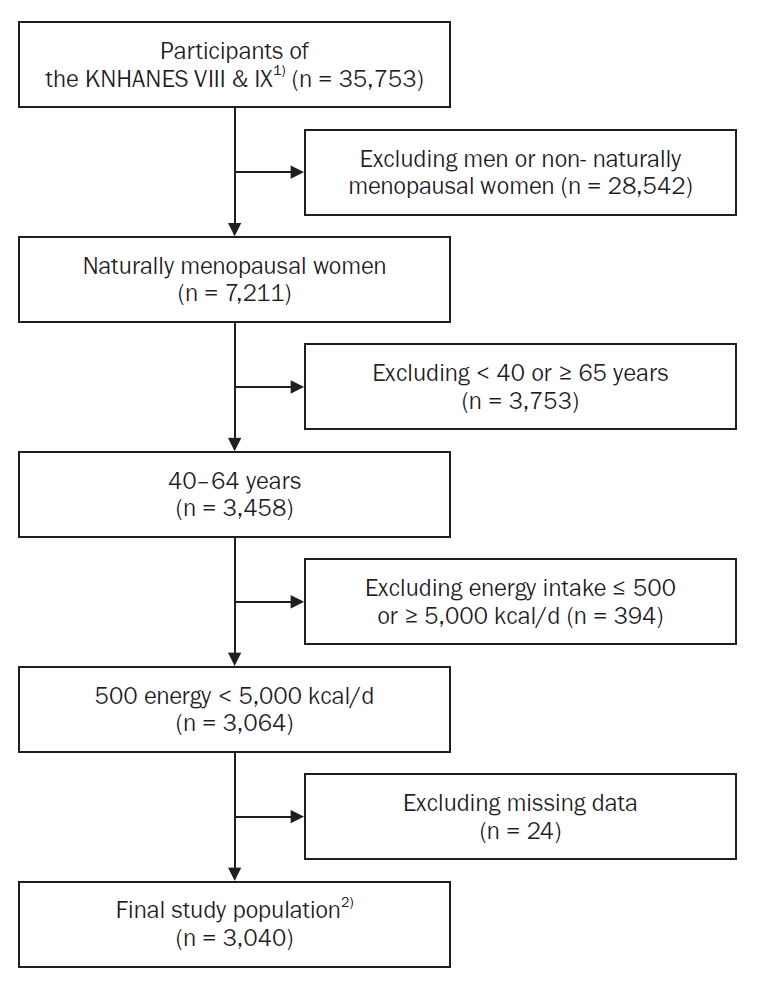
Fig. 1. Final study population derivation process.1)Year 1 (2022) and 2 (2023).2)Postmenopausal period data missing for two participants.
Fig. 1.
The dietary factors associated with sleep duration in postmenopausal middle-aged women: a cross-sectional study using 2019–2023 Korea National Health and Nutrition Examination Survey data
| Characteristics | Total (n = 3,040) | VSSD (n = 585) | SSD (n = 829) | ASD (n = 1,570) | LSD (n = 56) | P-value |
|---|---|---|---|---|---|---|
| Age group (year) | 0.533 | |||||
| 40–49 | 88 (2.9) | 15 (2.6) | 22 (2.7) | 50 (3.2) | 1 (1.8) | |
| 50–59 | 1,721 (56.6) | 322 (55.0) | 485 (58.5) | 887 (56.5) | 27 (48.2) | |
| 60–64 | 1,231 (40.5) | 248 (42.4) | 322 (38.8) | 633 (40.3) | 28 (50.0) | |
| Postmenopausal period | 0.071 | |||||
| Early postmenopause |
1,448 (47.7) | 250 (42.7) | 404 (48.7) | 767 (48.9) | 27 (48.2) | |
| Late postmenopause |
1,590 (52.3) | 335 (57.3) | 425 (51.3) | 801 (51.1) | 29 (51.8) | |
| Education level | < 0.001 | |||||
| Up to elementary school | 406 (13.4) | 108 (18.5) | 85 (10.3) | 200 (12.7) | 13 (23.2) | |
| Middle school graduate | 465 (15.3) | 106 (18.1) | 132 (15.9) | 215 (13.7) | 12 (21.4) | |
| High school graduate | 1,362 (44.8) | 253 (43.2) | 369 (44.5) | 719 (45.8) | 21 (37.5) | |
| College or above | 807 (26.5) | 118 (20.2) | 243 (29.3) | 436 (27.8) | 10 (17.9) | |
| Household income | 0.006 | |||||
| Low | 365 (12.0) | 85 (14.5) | 87 (10.5) | 181 (11.5) | 12 (21.4) | |
| Lower middle | 768 (25.3) | 158 (27.0) | 212 (25.6) | 383 (24.4) | 15 (26.8) | |
| Upper middle | 845 (27.8) | 171 (29.2) | 212 (25.6) | 447 (28.5) | 15 (26.8) | |
| High | 1,062 (34.9) | 171 (29.2) | 318 (38.4) | 559 (35.6) | 14 (25.0) | |
| Economic participation | 0.624 | |||||
| Employed | 1,740 (57.2) | 338 (57.8) | 483 (58.3) | 891 (56.8) | 28 (50.0) | |
| Unemployed or non- economically active | 1,300 (42.8) | 247 (42.2) | 346 (41.7) | 679 (43.2) | 28 (50.0) | |
| Current drinking status | 0.739 | |||||
| Non-drinker | 1,975 (65.0) | 379 (64.8) | 527 (63.6) | 1,031 (65.7) | 38 (67.9) | |
| Drinker | 1,065 (35.0) | 206 (35.2) | 302 (36.4) | 539 (34.3) | 18 (32.1) | |
| Current smoking status | 0.089 | |||||
| Non-smoker | 2,928 (96.3) | 555 (94.9) | 795 (95.9) | 1523 (97.0) | 55 (98.2) | |
| Smoker | 112 (3.7) | 30 (5.1) | 34 (4.1) | 47 (3.0) | 1 (1.8) | |
| Aerobic physical activity status | 0.274 | |||||
| Participation | 1,765 (58.0) | 328 (56.1) | 500 (60.3) | 898 (57.2) | 36 (64.3) | |
| Non-participation | 1,278 (42.0) | 257 (43.9) | 329 (39.7) | 672 (42.8) | 20 (35.7) |
| Characteristics | Total (n = 3,040) | VSSD (n = 585) | SSD (n = 829) | ASD (n = 1,570) | LSD (n = 56) | P-value |
|---|---|---|---|---|---|---|
| BMI (kg/m2) | 23.8 ± 0.08 | 24.2 ± 0.18 |
23.6 ± 0.12 |
23.7 ± 0.10 |
23.5 ± 0.65 |
0.022 |
| WC (cm) | 81.4 ± 0.21 | 82.7 ± 0.49 |
81.1 ± 0.34 |
81.2 ± 0.28 |
80.6 ± 1.82 |
0.040 |
| SBP (mmHg) | 118.8 ± 0.34 | 119.4 ± 0.73 | 118.5 ± 0.63 | 118.9 ± 0.48 | 117.2 ± 2.78 | 0.769 |
| DBP (mmHg) | 75.0 ± 0.20 | 75.6 ± 0.43 | 74.7 ± 0.36 | 74.9 ± 0.28 | 76.2 ± 1.56 | 0.353 |
| FBG (mg/dL) | 101.2 ± 0.47 | 102.3 ± 0.90 | 100.4 ± 0.65 | 101.0 ± 0.72 | 106.6 ± 5.23 | 0.237 |
| HbA1c (%) | 5.8 ± 0.02 | 5.9 ± 0.04 |
5.8 ± 0.02 |
5.8 ± 0.03 |
6.1 ± 0.23 |
0.022 |
| Total cholesterol (mg/dL) | 202.1 ± 0.88 | 199.9 ± 1.91 | 203.4 ± 1.54 | 202.5 ± 1.17 | 189.2 ± 6.63 | 0.093 |
| HDL-chol (mg/dL) | 58.7 ± 0.31 | 59.7 ± 0.71 |
59.6 ± 0.56 |
57.9 ± 0.41 |
56.8 ± 2.00 |
0.030 |
| LDL-chol (mg/dL) | 122.9 ± 1.20 | 117.3 ± 2.54 |
125.6 ± 2.22 |
124.0 ± 1.59 |
107.6 ± 7.62 |
0.014 |
| TG (mg/dL) | 116.7 ± 1.40 | 116.9 ± 3.31 | 113.6 ± 2.49 | 118.2 ± 1.96 | 117.0 ± 12.46 | 0.530 |
| Meal | VSSD (n = 585) | SSD (n = 829) | ASD (n = 1,570) | LSD (n = 56) | P-value |
|---|---|---|---|---|---|
| Breakfast | 0.006 | ||||
| No (skipped) | 112 (19.1) | 138 (16.6) | 244 (15.5) | 18 (32.1) | |
| Yes (not skipped) | 473 (80.9) | 691 (83.4) | 1326 (84.5) | 38 (67.9) | |
| Lunch | 0.238 | ||||
| No (skipped) | 54 (9.2) | 60 (7.2) | 105 (6.7) | 3 (5.4) | |
| Yes (not skipped) | 531 (90.8) | 769 (92.8) | 1465 (93.3) | 53 (94.6) | |
| Dinner | 0.013 | ||||
| No (skipped) | 46 (7.9) | 44 (5.3) | 81 (5.2) | 6 (10.7) | |
| Yes (not skipped) | 539 (92.1) | 785 (94.7) | 1489 (94.8) | 50 (89.3) |
| Meal | Model 1 |
P-value | Model 2 |
P-value | ||||||
|---|---|---|---|---|---|---|---|---|---|---|
| VSSD (n = 585) | SSD (n = 829) | ASD (n = 1,570) | LSD (n = 56) | VSSD (n = 585) | SSD (n = 829) | ASD (n = 1,570) | LSD (n = 56) | |||
| Breakfast | 305.2 ± 9.66 |
320.0 ± 7.72 |
330.8 ± 6.03 |
270.4 ± 30.57 |
0.014 | 303.4 ± 17.09 | 315.6 ± 15.96 | 325.0 ± 16.21 | 259.8 ± 46.43 | 0.169 |
| Lunch | 452.2 ± 12.14 | 474.5 ± 11.05 | 481.1 ± 7.58 | 476.2 ± 41.71 | 0.145 | 446.8 ± 20.74 | 442.6 ± 19.79 | 449.4 ± 20.21 | 439.8 ± 49.28 | 0.957 |
| Dinner | 448.4 ± 12.71 |
477.1 ± 10.37 |
477.8 ± 7.35 |
462.0 ± 41.91 |
0.046 | 494.5 ± 21.23 | 510.8 ± 20.03 | 512.1 ± 19.02 | 526.1 ± 49.59 | 0.612 |
| Snacks | 319.1 ± 14.03 | 317.8 ± 10.80 | 314.3 ± 7.53 | 354.7 ± 64.61 | 0.643 | 343.6 ± 20.52 |
319.2 ± 18.72 |
301.7 ± 18.39 |
362.6 ± 46.71 |
0.033 |
| Nutrients | Model 1 |
P-value | Model 2 |
P-value | ||||||
|---|---|---|---|---|---|---|---|---|---|---|
| VSSD (n = 585) | SSD (n = 829) | ASD (n = 1,570) | LSD (n = 56) | VSSD (n = 585) | SSD (n = 829) | ASD (n = 1,570) | LSD (n = 56) | |||
| Total energy intake (kcal/day) |
1,498.1 ± 29.08 |
1,588.5 ± 21.46 |
1,610.8 ± 16.22 |
1,588.5 ± 97.49 |
0.008 | 1,497.1 ± 40.98 |
1,569.1 ± 38.85 |
1,593.5 ± 36.28 |
1,587.7 ± 104.97 |
0.037 |
| Carbohydrate (%) | 64.4 ± 0.51 |
62.5 ± 0.43 |
62.8 ± 0.30 |
64.7 ± 1.60 |
0.005 | 64.0 ± 0.87 | 62.7 ± 0.82 | 62.8 ± 0.82 | 62.9 ± 1.94 | 0.135 |
| Protein (%) | 15.0 ± 0.19 | 15.3 ± 0.16 | 15.1 ± 0.11 | 14.7 ± 0.67 | 0.623 | 15.4 ± 0.32 | 15.5 ± 0.29 | 15.4 ± 0.28 | 15.2 ± 0.73 | 0.915 |
| Fat (%) | 20.6 ± 0.42 |
22.2 ± 0.34 |
22.0 ± 0.24 |
20.6 ± 1.37 |
0.001 | 20.6 ± 0.67 | 21.7 ± 0.62 | 21.8 ± 0.62 | 21.9 ± 1.67 | 0.058 |
| Carbohydrate (g/day) | 237.9 ± 4.78 | 243.7 ± 3.75 | 247.7 ± 2.53 | 249.5 ± 16.43 | 0.289 | 238.7 ± 4.08 | 234.5 ± 3.81 | 233.4 ± 3.84 | 236.0 ± 8.92 | 0.191 |
| Dietary Fiber (g/day) | 25.2 ± 0.65 | 26.4 ± 0.52 | 26.8 ± 0.39 | 24.7 ± 1.85 | 0.125 | 23.9 ± 0.63 | 23.6 ± 0.60 | 23.6 ± 0.55 | 21.7 ± 1.73 | 0.617 |
| Sugars (g/day) | 56.3 ± 2.03 | 58.8 ± 1.80 | 61.8 ± 1.21 | 63.8 ± 6.27 | 0.067 | 54.7 ± 2.23 | 52.6 ± 2.13 | 54.8 ± 1.90 | 58.7 ± 6.19 | 0.520 |
| Protein (g/day) | 56.0 ± 1.26 |
60.0 ± 1.04 |
60.3 ± 0.77 |
56.3 ± 3.65 |
0.017 | 57.9 ± 1.21 | 58.2 ± 1.19 | 57.8 ± 1.16 | 54.22 ± 2.57 | 0.453 |
| Fat (g/day) | 34.7 ± 1.09 |
39.8 ± 0.89 |
40.7 ± 0.73 |
39.2 ± 4.09 |
< 0.001 | 36.6 ± 1.18 | 38.0 ± 1.11 | 38.5 ± 1.10 | 38.8 ± 3.47 | 0.152 |
| SFA (g/day) | 10.6 ± 0.40 |
11.9 ± 0.31 |
12.4 ± 0.26 |
11.8 ± 1.46 |
0.003 | 11.4 ± 0.50 | 11.6 ± 0.44 | 12.0 ± 0.46 | 12.0 ± 1.37 | 0.361 |
| MUFA (g/day) | 10.8 ± 0.36 |
12.7 ± 0.32 |
13.1 ± 0.28 |
13.3 ± 1.67 |
< 0.001 | 11.7 ± 0.46 |
12.3 ± 0.45 |
12.7 ± 0.45 |
13.5 ± 1.53 |
0.017 |
| PUFA (g/day) | 9.6 ± 0.36 |
11.0 ± 0.26 |
10.8 ± 0.20 |
9.8 ± 0.97 |
0.015 | 9.5 ± 0.34 | 10.0 ± 0.29 | 9.6 ± 0.26 | 8.8 ± 0.83 | 0.312 |
| n-3 Fatty acids (g/day) | 1.7 ± 0.08 | 1.9 ± 0.07 | 1.8 ± 0.05 | 1.7 ± 0.24 | 0.182 | 1.6 ± 0.13 | 1.7 ± 0.13 | 1.6 ± 0.13 | 1.4 ± 0.29 | 0.314 |
| n-6 Fatty acids (g/day) | 7.9 ± 0.31 |
9.1 ± 0.22 |
8.9 ± 0.17 |
8.1 ± 0.81 |
0.013 | 7.9 ± 0.30 | 8.2 ± 0.25 | 8.0 ± 0.23 | 7.4 ± 0.66 | 0.432 |
| Cholesterol (mg/day) | 209.8 ± 8.49 | 227.5 ± 6.58 | 225.4 ± 4.79 | 223.1 ± 31.66 | 0.359 | 219.4 ± 11.03 | 219.6 ± 10.61 | 218.1 ± 10.47 | 228.8 ± 29.58 | 0.982 |
| Calcium (mg/day) | 489.2 ± 14.93 | 491.9 ± 10.37 | 503.9 ± 8.04 | 481.1 ± 45.82 | 0.700 | 468.2 ± 16.25 | 439.6 ± 13.35 | 449.0 ± 12.80 | 442.4 ± 47.58 | 0.355 |
| Phosphorus (mg/day) | 928.1 ± 19.36 | 966.1 ± 14.36 | 975.0 ± 10.92 | 923.9 ± 54.40 | 0.163 | 936.0 ± 17.05 | 915.8 ± 16.06 | 914.5 ± 15.53 | 873.9 ± 47.52 | 0.238 |
| Sodium (mg/day) | 2,697.8 ± 76.80 | 2,809.0 ± 59.77 | 2,798.4 ± 44.59 | 2,655.3 ± 263.85 | 0.613 | 2,713.2 ± 76.14 | 2,676.8 ± 72.44 | 2,629.4 ± 63.32 | 2,514.9 ± 199.37 | 0.571 |
| Potassium (mg/day) | 2,713.8 ± 67.50 | 2,789.4 ± 46.64 | 2,787.0 ± 34.08 | 2,647.1 ± 162.43 | 0.642 | 2,644.0 ± 59.49 |
2,555.6 ± 55.24 |
2,510.7 ± 51.18 |
2,409.4 ± 158.86 |
0.045 |
| Iron (mg/day) | 9.3 ± 0.26 | 9.6 ± 0.22 | 9.7 ± 0.16 | 10.1 ± 1.07 | 0.547 | 9.1 ± 0.27 | 8.8 ± 0.27 | 8.8 ± 0.22 | 9.5 ± 1.08 | 0.674 |
| Vitamin A (μgRAE/day) | 394.7 ± 15.94 | 396.7 ± 12.08 | 409.8 ± 9.66 | 430.8 ± 95.55 | 0.780 | 378.9 ± 19.65 | 353.3 ± 18.02 | 361.3 ± 16.99 | 402.7 ± 103.71 | 0.617 |
| Thiamin (mg/day) | 1.0 ± 0.03 | 1.0 ± 0.02 | 1.1 ± 0.02 | 0.9 ± 0.06 | 0.118 | 1.0 ± 0.04 | 1.0 ± 0.04 | 1.0 ± 0.04 | 0.9 ± 0.07 | 0.190 |
| Riboflavin (mg/day) | 1.4 ± 0.04 | 1.4 ± 0.02 | 1.5 ± 0.02 | 1.5 ± 0.12 | 0.351 | 1.4 ± 0.05 | 1.3 ± 0.05 | 1.3 ± 0.05 | 1.5 ± 0.11 | 0.249 |
| Niacin (mg/day) | 10.3 ± 0.29 | 10.6 ± 0.21 | 10.9 ± 0.16 | 10.7 ± 0.79 | 0.374 | 10.9 ± 0.29 | 10.5 ± 0.26 | 10.6 ± 0.25 | 10.6 ± 0.72 | 0.542 |
| Folate (μg DFE/day) | 320.2 ± 8.26 | 331.6 ± 5.73 | 332.7 ± 4.80 | 324.1 ± 31.21 | 0.619 | 310.3 ± 8.63 | 303.8 ± 7.37 | 301.3 ± 7.17 | 299.2 ± 34.21 | 0.672 |
| Vitamin C (mg/day) | 82.2 ± 5.37 | 74.1 ± 2.76 | 75.8 ± 2.41 | 87.3 ± 23.48 | 0.569 | 75.1 ± 6.02 | 61.8 ± 3.99 | 61.6 ± 3.88 | 77.6 ± 24.48 | 0.117 |
| Water (g/day) | 947.3 ± 28.37 | 1,003.6 ± 20.03 | 992.8 ± 14.77 | 921.9 ± 80.21 | 0.354 | 911.4 ± 29.11 | 896.3 ± 24.56 | 877.2 ± 24.88 | 825.2 ± 61.73 | 0.381 |
| Food Groups |
Model 1 |
P-value | Model 2 |
P-value | ||||||
|---|---|---|---|---|---|---|---|---|---|---|
| VSSD (n = 585) | SSD (n = 829) | ASD (n = 1,570) | LSD (n = 56) | VSSD (n = 585) | SSD (n = 829) | ASD (n = 1,570) | LSD (n = 56) | |||
| Cereal grains | 212.2 ± 5.38 | 222.3 ± 4.84 | 218.9 ± 3.03 | 242.2 ± 30.30 | 0.417 | 214.2 ± 6.94 | 219.0 ± 6.36 | 211.1 ± 6.19 | 237.3 ± 24.52 | 0.310 |
| Potatoes & starchy foods | 52.7 ± 5.33 | 46.7 ± 3.80 | 43.5 ± 2.52 | 29.0 ± 8.99 | 0.232 | 47.4 ± 5.83 |
35.9 ± 4.52 |
33.4 ± 3.94 |
19.7 ± 10.29 |
0.046 |
| Sweeteners | 6.3 ± 0.47 | 6.4 ± 0.39 | 7.8 ± 0.42 | 9.2 ± 2.05 | 0.106 | 6.9 ± 0.76 | 5.8 ± 0.59 | 7.2 ± 0.64 | 9.2 ± 2.62 | 0.065 |
| Pulses | 45.5 ± 3.93 | 48.2 ± 3.17 | 44.5 ± 2.05 | 49.4 ± 17.29 | 0.805 | 40.5 ± 4.82 | 42.5 ± 4.56 | 38.6 ± 4.07 | 27.0 ± 15.22 | 0.642 |
| Nuts & seeds | 8.4 ± 1.03 |
7.4 ± 0.80 |
11.8 ± 1.04 |
9.6 ± 3.77 |
0.020 | 5.2 ± 1.13 | 4.2 ± 1.19 | 8.4 ± 0.98 | 6.3 ± 3.47 | 0.066 |
| Vegetables | 301.1 ± 9.87 | 307.3 ± 7.18 | 306.1 ± 4.96 | 268.2 ± 24.10 | 0.087 | 296.8 ± 12.67 |
292.6 ± 10.19 |
282.8 ± 9.75 |
225.9 ± 25.72 |
0.038 |
| Mushrooms | 7.5 ± 1.05 | 6.9 ± 0.90 | 6.3 ± 0.54 | 6.7 ± 3.74 | 0.823 | 8.1 ± 1.94 | 6.6 ± 1.84 | 6.6 ± 1.87 | 5.8 ± 3.37 | 0.732 |
| Fruits | 201.0 ± 14.25 | 208.4 ± 8.66 | 221.5 ± 6.84 | 236.0 ± 47.25 | 0.235 | 157.5 ± 14.62 | 156.7 ± 13.97 | 166.0 ± 11.16 | 162.0 ± 43.37 | 0.903 |
| Seaweeds | 19.2 ± 3.54 | 19.0 ± 2.24 | 17.7 ± 1.52 | 11.1 ± 2.80 | 0.674 | 19.3 ± 4.71 | 14.7 ± 2.75 | 13.6 ± 2.23 | 8.4 ± 5.98 | 0.521 |
| Meats | 65.2 ± 4.00 |
73.6 ± 3.85 |
74.6 ± 2.51 |
47.9 ± 8.83 |
0.044 | 71.1 ± 6.73 | 76.8 ± 6.56 | 77.3 ± 6.58 | 56.5 ± 13.61 | 0.282 |
| Eggs | 34.5 ± 1.92 | 36.9 ± 1.57 | 35.2 ± 1.14 | 27.1 ± 5.47 | 0.312 | 31.6 ± 2.55 | 33.0 ± 2.43 | 30.8 ± 2.25 | 26.9 ± 7.20 | 0.672 |
| Fish & shellfish | 66.3 ± 5.21 | 75.1 ± 4.41 | 73.0 ± 2.77 | 87.9 ± 14.95 | 0.806 | 74.4 ± 7.92 | 74.5 ± 6.69 | 69.6 ± 5.40 | 92.0 ± 24.67 | 0.667 |
| Dairy products | 90.8 ± 6.64 | 88.1 ± 4.84 | 99.1 ± 4.04 | 88.9 ± 17.20 | 0.210 | 89.2 ± 12.02 | 71.0 ± 8.93 | 84.6 ± 9.41 | 101.9 ± 32.36 | 0.117 |
| Fats & oils | 5.0 ± 0.27 | 5.9 ± 0.26 | 5.7 ± 0.19 | 5.0 ± 1.04 | 0.186 | 5.0 ± 0.33 | 5.2 ± 0.32 | 4.9 ± 0.30 | 4.7 ± 1.10 | 0.829 |
| Beverages | 152.9 ± 10.91 | 175.4 ± 8.81 | 156.3 ± 6.42 | 160.3 ± 31.84 | 0.827 | 168.3 ± 20.50 | 160.1 ± 16.40 | 149.3 ± 16.64 | 181.6 ± 45.97 | 0.680 |
| Alcoholic beverages | 26.0 ± 5.15 | 42.1 ± 6.73 | 33.2 ± 3.92 | 37.3 ± 17.61 | 0.112 | 86.8 ± 21.71 | 95.6 ± 21.34 | 97.5 ± 23.09 | 112.4 ± 28.30 | 0.207 |
| Variable | VSSD |
SSD |
LSD |
|||
|---|---|---|---|---|---|---|
| OR (95%CI) | P-value | OR (95%CI) | P-value | OR (95%CI) | P-value | |
| Early postmenopause (n = 1,448) |
||||||
| Sugars (g/day) | 0.997 (0.986, 1.008) | 0.609 | 1.003 (0.992, 1.013) | 0.593 | 1.030 (1.002, 1.060) | 0.039 |
| Cholesterol (mg/day) | 1.001 (0.998, 1.004) | 0.482 | 1.000 (0.997, 1.002) | 0.721 | 1.009 (1.004, 1.014) | < 0.001 |
| Phosphorus (mg/day) | 1.000 (0.998, 1.002) | 0.953 | 0.999 (0.997, 1.000) | 0.118 | 1.006 (1.001, 1.011) | 0.023 |
| Vitamin A (μgRAE/day) | 0.993 (0.961, 1.027) | 0.697 | 1.015 (0.997, 1.034) | 0.108 | 0.478 (0.256, 0.891) | 0.020 |
| Folate (μg DFE/day) | 0.996 (0.993, 0.999) | 0.010 | 1.000 (0.997, 1.002) | 0.676 | 1.000 (0.993, 1.007) | 0.936 |
| Late postmenopause (n = 1,590) |
||||||
| Cholesterol (mg/day) | 1.001 (0.998, 1.004) | 0.624 | 0.998 (0.996, 1.001) | 0.223 | 1.007 (1.002, 1.011) | 0.004 |
| Vitamin A (μgRAE/day) | 0.997 (0.978, 1.016) | 0.748 | 1.005 (0.989, 1.022) | 0.5582 | 1.043 (1.010, 1.078) | 0.011 |
| Riboflavin (mg/day) | 0.694 (0.396, 1.214) | 0.200 | 1.153 (0.741, 1.794) | 0.527 | 4.776 (1.635, 3.951) | 0.004 |
| Water (g/day) | 1.000 (0.998, 1.002) | 0.880 | 1.001 (1.000, 1.003) | 0.106 | 0.994 (0.991, 0.997) | < 0.001 |
| Cereal grains (g/day) | 1.001 (0.998, 1.005) | 0.406 | 1.001 (0.998, 1.004) | 0.505 | 1.015 (1.008, 1.022) | < 0.001 |
| Eggs (g/day) | 1.000 (0.991, 1.010) | 0.982 | 1.005 (0.998, 1.013) | 0.176 | 0.986 (0.972, 1.000) | 0.046 |
| Fish & shellfish (g/day) | 1.000 (0.997, 1.002) | 0.859 | 1.000 (0.997, 1.002) | 0.936 | 1.009 (1.004, 1.014) | < 0.001 |
| Beverages (g/day) | 1.000 (0.998, 1.003) | 0.672 | 0.998 (0.997, 1.000) | 0.098 | 1.005 (1.002, 1.009) | 0.005 |
| Variable | Coefficient |
Inflection point |
Sleep duration (hr) | |||
|---|---|---|---|---|---|---|
| β1 | P-value | β2 | P-value | |||
| Early postmenopause (n = 1,448) |
||||||
| PUFA (g/day) | 0.0240942 | 0.113 | −0.0006068 | 0.049 | 19.86 | 7.19 |
| Riboflavin (mg/day) | 0.3556539 | 0.102 | −0.1009126 | 0.032 | 1.76 | 7.08 |
| Water (g/day) | 0.0008693 | 0.001 | −0.0000004 | < 0.001 | 1,086.63 | 7.19 |
| Alcoholic beverages (g/day) | 0.0013586 | 0.001 | −0.0000008 | 0.001 | 849.13 | 7.52 |
| Late postmenopause (n = 1,590) |
||||||
| Sugars (g/day) | 0.0056061 | < 0.001 | −0.0000222 | < 0.001 | 126.33 | 7.01 |
| Sodium (mg/day) | −0.0001268 | 0.014 | 0.0000000 | 0.046 | - | - |
| Fruits (g/day) | 0.0003218 | 0.061 | −0.0000002 | < 0.001 | 804.50 | 6.90 |
| Beverages (g/day) | 0.0006865 | 0.011 | −0.0000007 | < 0.001 | 490.36 | 6.98 |
Table 1. General characteristics according to sleep duration categories
n (%). Rao-Scott chi-square test. VSSD, very short sleep duration (< 6 hours); SSD, short sleep duration (6–7 hours); ASD, appropriate sleep duration (7–9 hours); LSD, long sleep duration (> 9 hours). < 6 years after menopause. ≥ 6 years after menopause.
Table 2. Health indicators according to sleep duration categories
Mean ± SE. Analysis of variance. VSSD, very short sleep duration (< 6 hours); SSD, short sleep duration (6–7 hours); ASD, appropriate sleep duration (7–9 hours); LSD, long sleep duration (> 9 hours); BMI, body mass index; WC, waist circumference; SBP, systolic blood pressure; DBP, diastolic blood pressure; FBG, fasting blood glucose; HbA1c, glycated hemoglobin; HDL-chol, high-density lipoprotein-cholesterol; LDL-chol, low-density lipoprotein-cholesterol; TG, triglyceride. Different letters indicate statistically significant differences according to the Tukey test.
Table 3. Meal skipping according to sleep duration categories
n (%). Rao-Scott chi-square test. VSSD, very short sleep duration (< 6 hours); SSD, short sleep duration (6–7 hours); ASD, appropriate sleep duration (7–9 hours); LSD, long sleep duration (> 9 hours).
Table 4. Energy intake by meal according to sleep duration categories
Model 1, mean ± SE, analysis of variance; Model 2, weighed mean ± SE, analysis of covariance adjusted for age, education level, household income, current drinking and smoking status, body mass index, systolic blood pressure, high-density lipoprotein-cholesterol, glycated hemoglobin, and total energy intake. VSSD, very short sleep duration (< 6 hours); SSD, short sleep duration (6–7 hours); ASD, appropriate sleep duration (7–9 hours); LSD, long sleep duration (> 9 hours). Different letters indicate a significant difference.
Table 5. Energy and nutrient intake according to sleep duration categories
Mode1 1, mean ± SE, analysis of variance; mode1 2, weighed mean ± SE, analysis of covariance adjusted for age, education level, household income, current drinking and smoking status, body mass index, systolic blood pressure, high-density lipoprotein-cholesterol, glycated hemoglobin, and total energy intake. VSSD, very short sleep duration (< 6 hours); SSD, short sleep duration (6–7 hours); ASD, appropriate sleep duration (7–9 hours); LSD, long sleep duration (> 9 hours); SFA, saturated fatty acids; MUFA, monounsaturated fatty acids; PUFA, polyunsaturated fatty acids. Total energy intake excluded from adjusted variables in model 2. Different letters indicate a significant difference.
Table 6. Food group intake by sleep duration category
Model 1, mean ± SE, analysis of variance; model 2, weighed mean ± SE, analysis of covariance adjusted for age, education level, household income, current drinking and smoking status, body mass index, systolic blood pressure, high-density lipoprotein-cholesterol, glycated hemoglobin, and total energy intake. VSSD, very short sleep duration (< 6 hours); SSD, short sleep duration (6–7 hours); ASD, appropriate sleep duration (7–9 hours); LSD, long sleep duration (> 9 hours). g/day. Different letters indicate a significant difference.
Table 7. Associations of dietary intake with categories of sleep duration by postmenopausal period
Multinomial logistic regression relative to appropriate sleep duration (7–9 hours) adjusted for age, education level, household income, current drinking and smoking status, body mass index, systolic blood pressure, high-density lipoprotein-cholesterol, glycated hemoglobin, and total energy intake. Only variables with significant relationships to sleep duration are shown. OR, odds ratio; VSSD, very short sleep duration (< 6 hours); SSD, short sleep duration (6–7 hours); LSD, long sleep duration (> 9 hours); CI, confidence interval. < 6 years after menopause. ≥ 6 years after menopause.
Table 8. Associations of dietary intake with sleep duration by postmenopausal period
Polynomial regression analysis adjusted for age, education level, household income, current drinking and smoking status, body mass index, systolic blood pressure, high-density lipoprotein-cholesterol, glycated hemoglobin, and total energy intake. Only variables with significant relationships to sleep duration are shown. β1, first-order coefficient; β2, second-order coefficient; PUFA, polyunsaturated fatty acids. −β1 / 2β2. < 6 years after menopause. ≥ 6 yr after menopause.


