
Articles
- Page Path
- HOME > Korean J Community Nutr > Volume 31(2); 2026 > Article
-
Research Article
노인의 점심 식사 장소에 따른 영양 섭취 실태 및 적정성 비교: 제7–8기(2018–2021) 국민건강영양조사 자료를 이용하여 -
최다은1)
 , 서선희2),†
 - Differences in lunch nutrient intake and nutritional adequacy among Korean older adults by meal site: a cross-sectional analysis of the 2018–2021 Korea National Health and Nutrition Examination Survey data
-
Daeun Choi1), Sunhee Seo2),†
-
Korean Journal of Community Nutrition 2026;31(2):205-213.
DOI: https://doi.org/10.5720/kjcn.2026.00045
Published online: April 30, 2026
1)이화여자대학교 식품영양학과 박사과정
2)이화여자대학교 식품영양학과 교수
1)Ph.D. Student, Department of Nutritional Science and Food Management, Ewha Womans University, Seoul, Korea
2)Professor, Department of Nutritional Science and Food Management, Ewha Womans University, Seoul, Korea
- †Corresponding author: Sunhee Seo Department of Nutritional Science and Food Management, Ewha Womans University, 52 Ewhayeodae-gil, Seodaemun-gu, Seoul 03760, Korea Tel: +82-2-3277-4484 Email: seo@ewha.ac.kr
• Received: February 2, 2026 • Revised: April 16, 2026 • Accepted: April 21, 2026
© 2026 The Korean Society of Community Nutrition
This is an Open-Access article distributed under the terms of the Creative Commons Attribution Non-Commercial License (https://creativecommons.org/licenses/by-nc/4.0) which permits unrestricted non-commercial use, distribution, and reproduction in any medium, provided the original work is properly cited.
- 329 Views
- 11 Download
Abstract
-
Objectives
- This study aimed to examine whether the dietary quality of congregate lunches differs according to meal location among older adults and to identify meal settings that may represent gaps in nutritional oversight. Specifically, this study compared lunchtime nutrient intake and adequacy among older adults eating at workplaces, welfare centers, and religious institutions.
-
Methods
- Data were obtained from the 2018–2021 Korea National Health and Nutrition Examination Survey. The participants included 487 adults aged ≥ 65 years who reported consuming lunch at institutional meal sites, including workplaces (n = 187), welfare centers (n = 145), and religious institutions (n = 155). Nutrient intakes, nutrient adequacy ratio (NARs), and the mean adequacy ratio were compared using complex-sample general linear models with Bonferroni post-hoc tests, adjusting for sex, age, and total energy intake.
-
Results
- Socioeconomic characteristics were broadly comparable across groups, but nutrient intake and dietary quality differed according to meal location. In food-group analyses, meat intake was lowest among participants eating at religious institutions, and dairy intake also differed significantly across settings. In nutrient adequacy analyses, NAR for carbohydrate, thiamin, and niacin differed significantly by meal location. However, except for carbohydrate, most nutrient-specific NAR remained below 1.0 across all groups, indicating insufficient adequacy relative to one-third of the recommended intake from lunch alone. Conclusion: The dietary quality of congregate lunches among older adults differed according to meal location. Although nutrient inadequacy was common across settings, older adults eating at religious institutions showed relatively lower adequacy for some nutrients, particularly thiamin and niacin. These findings suggest that nutritional support should be strengthened across congregate meal services, with particular attention to less structured community-based settings such as religious institutions.
INTRODUCTION
METHODS
1) 일반적 특성
2) 식사의 질 평가
RESULTS
DISCUSSION
-
CONFLICT OF INTEREST
There are no financial or other issues that might lead to conflict of interest.
-
FUNDING
None.
-
DATA AVAILABILITY
The data that support the findings of this study are openly available in KNHANES database at https://knhanes.kdca.go.kr.
NOTES
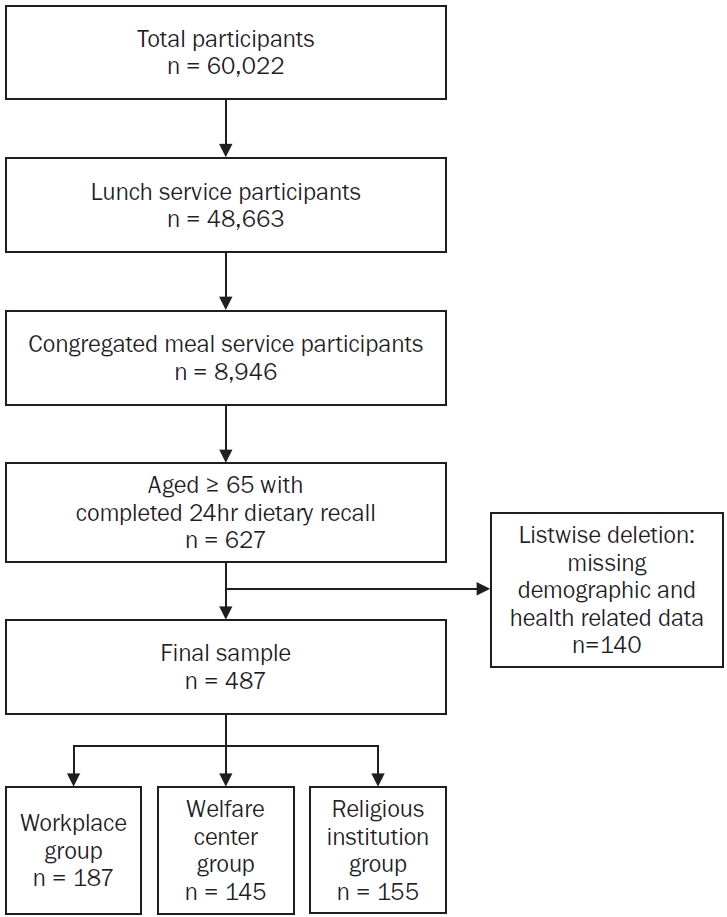
Table 1.General characteristics of participants according to meal location
| Category | WP (n = 187) | WC (n = 145) | RI (n = 155) | Total (n = 487) | P-value1) |
|---|---|---|---|---|---|
| Sex | < 0.001 | ||||
| Male | 101 (57.0) | 69 (46.3) | 36 (22.5) | 206 (42.9) | |
| Female | 86 (43.0) | 76 (53.7) | 119 (77.5) | 281 (57.1) | |
| Age (year) | < 0.001 | ||||
| < 75 | 169 (91.9) | 53 (37.8) | 75 (46.8) | 297 (61.9) | |
| ≥ 75 | 18 (8.1) | 92 (62.2) | 80 (53.2) | 190 (38.1) | |
| Area of residence | 0.788 | ||||
| Urban | 143 (76.6) | 118 (80.4) | 119 (77.8) | 380 (78.1) | |
| Rural area | 44 (23.4) | 27 (19.6) | 36 (22.2) | 107 (21.9) | |
| Education level (n = 469) | 0.941 | ||||
| ≤ Elementary school | 58 (24.1) | 44 (22.7) | 51 (23.6) | 153 (23.6) | |
| Middle school | 21 (8.7) | 21 (10.7) | 12 (10.4) | 54 (9.9) | |
| High school | 55 (34.9) | 31 (29.9) | 36 (29.3) | 122 (31.7) | |
| ≥ College | 49 (32.2) | 43 (36.7) | 48 (36.7) | 140 (34.9) | |
| Marital status | 0.244 | ||||
| Married | 130 (67.9) | 95 (60.2) | 99 (58.2) | 324 (62.6) | |
| Single | 57 (32.1) | 50 (39.8) | 56 (41.8) | 163 (37.4) | |
| National basic livelihood security recipient | 0.743 | ||||
| Yes | 9 (4.1) | 6 (2.9) | 8 (4.4) | 23 (3.9) | |
| No | 178 (95.9) | 139 (97.1) | 147 (95.6) | 464 (96.1) | |
| Personal income quartile | 0.497 | ||||
| Low | 40 (20.3) | 37 (22.7) | 36 (19.8) | 113 (20.8) | |
| Middle-low | 60 (33.8) | 29 (21.8) | 42 (29.1) | 131 (28.8) | |
| Middle-high | 41 (19.8) | 40 (28.0) | 40 (26.4) | 121 (24.3) | |
| High | 46 (26.1) | 39 (27.5) | 37 (24.7) | 122 (26.1) | |
| Monthly household income (1,000 KRW) | 508.79 ± 31.11 | 532.00 ± 36.50 | 513.84 ± 37.01 | 518.21 ± 19.48 | 0.891 |
Table 2.Body mass index, self-rated health status, and chewing problems according to meal location
| Category | WP (n = 187) | WC (n = 145) | RI (n = 155) | Total (n = 487) | P-value1) |
|---|---|---|---|---|---|
| BMI (kg/m2) | 23.65 ± 0.43 | 22.91 ± 0.47 | 23.02 ± 0.40 | 23.19 ± 0.25 | 0.553 |
| Self-rated health status (n = 470) | 0.695 | ||||
| Very good | 4 (2.4) | 5 (3.6) | 8 (5.8) | 17 (3.8) | |
| Good | 7 (2.8) | 4 (2.5) | 3 (2.0) | 14 (2.4) | |
| Moderate | 20 (9.8) | 13 (6.9) | 17 (11.0) | 50 (9.3) | |
| Poor | 90 (46.9) | 74 (55.1) | 76 (49.7) | 240 (50.1) | |
| Very poor | 48 (27.2) | 36 (24.3) | 43 (26.8) | 127 (26.4) | |
| Average2) | 3.34 ± 0.08 | 3.29 ± 0.06 | 3.23 ± 0.07 | 3.29 ± 0.04 | 0.565 |
| Chewing problems (n = 390) | 0.173 | ||||
| Very uncomfortable | 4 (1.1) | 5 (3.1) | 4 (2.3) | 13 (2.1) | |
| Uncomfortable | 27 (14.8) | 24 (17.1) | 19 (12.8) | 70 (14.8) | |
| Moderate | 25 (18.5) | 13 (12.6) | 13 (9.6) | 51 (14.0) | |
| Not uncomfortable | 42 (29.5) | 25 (23.8) | 34 (21.7) | 101 (25.4) | |
| Not uncomfortable at all | 53 (36.0) | 48 (43.3) | 54 (53.7) | 155 (43.7) | |
| Average2) | 3.85 ± 0.09 | 3.87 ± 0.12 | 4.12 ± 0.11 | 3.95 ± 0.06 | 0.116 |
n (%) or Mean ± SE.
WP, workplace group; WC, welfare center group; RI, religious institution group; BMI, body mass index.
1)P-values were determined by chi-square test for categorical variables and by complex-sample general linear model for continuous variables.
2)5-point Likert scale. Higher scores indicate better self-rated health or less chewing difficulty.
Table 3.Comparison of food group intake at lunch according to meal location
| Food groups | WP (n = 187) | WC (n = 145) | RI (n = 155) | Total (n = 487) | P-value1) |
|---|---|---|---|---|---|
| Grains (g) | 80.55 ± 12.27 | 72.13 ± 3.80 | 96.04 ± 22.97 | 82.91 ± 5.72 | 0.156 |
| Potatoes and starch (g) | 12.33 ± 1.39a | 1.70 ± 1.00ab | 6.85 ± 1.71b | 6.96 ± 0.25 | < 0.001 |
| Sugars (g) | 2.97 ± 0.46a | 0.79 ± 0.73ab | 0.69 ± 0.54b | 1.82 ± 0.26 | 0.016 |
| Beans (g) | 12.61 ± 1.50 | 11.71 ± 2.97 | 13.68 ± 6.51 | 12.67 ± 3.31 | 0.703 |
| Seeds and nuts (g) | 0.76 ± 0.16 | 0.51 ± 0.14 | 0.40 ± 0.16 | 0.55 ± 0.08 | 0.163 |
| Vegetables (g) | 125.80 ± 16.54 | 111.54 ± 12.49 | 117.99 ± 18.05 | 118.44 ± 7.43 | 0.829 |
| Mushrooms (g) | 9.72 ± 4.02 | 13.14 ± 0.54 | 8.21 ± 5.74 | 10.36 ± 3.08 | 0.415 |
| Fruits (g) | 27.50 ± 2.52 | 24.56 ± 2.53 | 18.78 ± 2.95 | 24.64 ± 1.60 | 0.201 |
| Meats (g) | 59.28 ± 7.56a | 31.68 ± 1.28b | 13.78 ± 4.62c | 34.91 ± 2.19 | 0.003 |
| Eggs (g) | 4.51 ± 2.08 | 4.61 ± 0.00 | 79.31 ± 23.69 | 29.48 ± 7.76 | 0.105 |
| Seafoods (g) | 5.45 ± 6.33a | 29.93 ± 6.58a | 7.07 ± 6.58b | 14.15 ± 2.88 | 0.023 |
| Seaweeds (g) | 19.56 ± 8.21 | 33.40 ± 2.16 | 25.52 ± 1.70 | 26.16 ± 4.02 | 0.412 |
| Dairy products (g) | 24.96 ± 2.57ab | 31.52 ± 2.59a | 21.51 ± 3.04b | 26.10 ± 1.72 | < 0.001 |
| Drinks (g) | 82.97 ± 9.99a | 79.55 ± 10.01a | 52.53 ± 11.77b | 73.02 ± 6.61 | < 0.001 |
Table 4.Energy and nutrient intake of participants at lunch according to meal location
| Nutrient intakes | WP (n = 187) | WC (n = 145) | RI (n = 155) | Total (n = 487) | P-value1) |
|---|---|---|---|---|---|
| Energy (kcal) | 599.82 ± 41.23 | 595.85 ± 32.02 | 607.63 ± 53.53 | 601.10 ± 23.39 | > 0.999 |
| Water (g) | 252.11 ± 13.22 | 251.74 ± 13.26 | 219.04 ± 14.03 | 240.96 ± 6.91 | 0.128 |
| Carbohydrates (g) | 88.40 ± 2.83 | 92.48 ± 1.89 | 96.89 ± 3.93 | 92.59 ± 1.73 | 0.163 |
| Protein (g) | 25.52 ± 1.08a | 23.30 ± 0.63b | 21.17 ± 0.99b | 23.33 ± 0.53 | 0.008 |
| Fat (g) | 15.81 ± 1.05 | 14.77 ± 0.77 | 13.75 ± 1.50 | 14.77 ± 0.66 | 0.507 |
| Energy contribution (%) | |||||
| Carbohydrate | 62.05 ± 1.35 | 63.28 ± 1.25 | 66.69 ± 1.55 | 64.01 ± 0.79 | 0.069 |
| Protein | 16.29 ± 0.55a | 15.07 ± 0.43ab | 13.87 ± 0.55b | 15.08 ± 0.28 | 0.007 |
| Fat | 20.05 ± 1.14 | 20.24 ± 1.06 | 18.16 ± 1.36 | 19.48 ± 0.65 | 0.458 |
| Dietary fiber (g) | 7.12 ± 0.40 | 7.41 ± 0.33 | 6.95 ± 0.35 | 7.16 ± 0.21 | 0.635 |
| Sugar (g) | 11.61 ± 1.37 | 11.08 ± 1.16 | 10.54 ± 1.45 | 11.08 ± 0.75 | > 0.999 |
| Calcium (mg) | 135.00 ± 11.25 | 152.16 ± 12.56 | 135.68 ± 12.75 | 140.95 ± 6.62 | 0.744 |
| Iron (mg) | 3.72 ± 0.23 | 3.72 ± 0.28 | 3.03 ± 0.19 | 3.49 ± 0.11 | 0.061 |
| Phosphorus (mg) | 340.26 ± 11.17a | 333.77 ± 9.49ab | 300.55 ± 12.19b | 324.86 ± 5.72 | 0.049 |
| Sodium (mg) | 1,196.26 ± 65.72 | 1,210.45 ± 55.60 | 1,160.69 ± 81.03 | 1,189.13 ± 39.88 | > 0.999 |
| Potassium (mg) | 774.76 ± 35.99 | 796.11 ± 32.37 | 704.86 ± 41.62 | 758.58 ± 18.47 | 0.122 |
| Magnesium (mg) | 95.41 ± 4.03 | 98.03 ± 4.21 | 88.38 ± 4.15 | 93.94 ± 2.22 | 0.204 |
| Vitamin A (μg RAE) | 127.46 ± 14.73 | 121.72 ± 12.08 | 93.71 ± 11.57 | 114.30 ± 8.11 | 0.131 |
| Thiamine (mg) | 0.49 ± 0.03a | 0.39 ± 0.02b | 0.34 ± 0.03b | 0.41 ± 0.02 | 0.001 |
| Riboflavin (mg) | 0.48 ± 0.03 | 0.47 ± 0.03 | 0.41 ± 0.03 | 0.45 ± 0.02 | 0.149 |
| Niacin (mg) | 4.15 ± 0.26a | 3.64 ± 0.18ab | 3.14 ± 0.22b | 3.65 ± 0.12 | 0.012 |
| Vitamin C (mg) | 14.35 ± 1.84 | 15.94 ± 2.36 | 14.87 ± 2.62 | 15.05 ± 1.21 | > 0.999 |
| Vitamin D (μg) | 1.06 ± 0.24 | 1.09 ± 0.20 | 0.88 ± 0.29 | 1.01 ± 0.13 | > 0.999 |
| Vitamin E (mg) | 2.23 ± 0.18 | 2.11 ± 0.09 | 1.89 ± 0.13 | 2.08 ± 0.07 | 0.251 |
Table 5.NAR and MAR at lunch according to meal location
| Category | WP (n = 187) | WC (n = 145) | RI (n = 155) | Total (n = 487) | P-value1) |
|---|---|---|---|---|---|
| NAR | |||||
| Carbohydrates | 1.77 ± 0.09a | 2.17 ± 0.15ab | 2.15 ± 0.13b | 2.03 ± 0.06 | 0.039 |
| Protein | 0.80 ± 0.03 | 0.85 ± 0.02 | 0.81 ± 0.03 | 0.82 ± 0.01 | 0.240 |
| Calcium | 0.43 ± 0.03 | 0.48 ± 0.04 | 0.45 ± 0.03 | 0.45 ± 0.02 | 0.505 |
| Iron | 0.72 ± 0.03 | 0.83 ± 0.03 | 0.79 ± 0.03 | 0.78 ± 0.02 | 0.075 |
| Phosphorus | 0.87 ± 0.02 | 0.91 ± 0.02 | 0.84 ± 0.03 | 0.87 ± 0.01 | 0.095 |
| Vitamin A | 0.39 ± 0.05 | 0.42 ± 0.04 | 0.49 ± 0.05 | 0.43 ± 0.03 | 0.296 |
| Thiamine | 0.78 ± 0.03ab | 0.86 ± 0.02a | 0.75 ± 0.03b | 0.80 ± 0.02 | 0.012 |
| Riboflavin | 0.66 ± 0.04 | 0.73 ± 0.03 | 0.70 ± 0.04 | 0.70 ± 0.02 | 0.367 |
| Niacin | 0.60 ± 0.03a | 0.69 ± 0.03b | 0.57 ± 0.03a | 0.62 ± 0.02 | 0.009 |
| Folate | 0.59 ± 0.03 | 0.63 ± 0.04 | 0.70 ± 0.04 | 0.64 ± 0.02 | 0.060 |
| Vitamin C | 0.32 ± 0.04 | 0.40 ± 0.04 | 0.44 ± 0.04 | 0.38 ± 0.02 | 0.050 |
| MAR | 0.77 ± 0.03 | 0.87 ± 0.04 | 0.85 ± 0.04 | 0.83 ± 0.02 | 0.100 |
Adjusted Mean ± SE.
NAR, nutrient adequacy ratio; MAR, mean adequacy ratio; WP, workplace group; WC, welfare center group; RI, religious institution group.
1)P-values were obtained using a complex-sample adjusted for total energy intake, sex, and age.
a,bDifferent letters indicate statistically significant differences according to the Bonferroni test.
- 1. Korean Statistical in Information Service. Major population indicators (sex ratio, population growth rate, population structure, dependency ratio, etc.) [Internet]. Ministry of Data and Statistics; 2023 [cited 2026 Apr 5]. Available from: https://kosis.kr/statHtml/statHtml.do?orgId=101&tblId=DT_1BPA002
- 2. Seo S, Yu E, Ahn J. A qualitative study on the experiences of congregate meal services from the low-income elderly. J Korean Diet Assoc 2013; 19(3): 298-308. Article
- 3. Middleton G, Patterson KA, Muir-Cochrane E, Velardo S, McCorry F, Coveney J. The health and well-being impacts of community shared meal programs for older populations: a scoping review. Innov Aging 2022; 6(7): igac068.ArticlePubMedPMCPDF
- 4. Lee SY. Performance evaluation of the meal support program for older adults in Seoul. Seoul Welfare Foundation; 2024 Oct. Report No. Seoul Welfare Foundation-2024-15.
- 5. Public Data Portal. Status of free meal services for older adults [Internet]. Public Data Portal; 2025 [cited 2025 May 10]. Available from: https://www.data.go.kr/data/15013107/standard.do
- 6. Keller H, Carrier N, Duizer L, Lengyel C, Slaughter S, Steele C. Making the most of mealtimes (M3): grounding mealtime interventions with a conceptual model. J Am Med Dir Assoc 2014; 15(3): 158-161. ArticlePubMedPMC
- 7. Edwards JSA, Hartwell HJ. Institutional meals. In: Meiselman HL, editor. Meals in science and practice: interdisciplinary research and business applications. Woodhead Publishing; 2009. p. 102-127.
- 8. Shams-White MM, Korycinski RW, Dodd KW, Barrett B, Jacobs S, Subar AF, et al. Examining the association between meal context and diet quality: an observational study of meal context in older adults. Int J Behav Nutr Phys Act 2021; 18(1): 67.ArticlePubMedPMCPDF
- 9. Kwon JH, Hwang RI, Jeong HJ, Jang HM. Comparison of food service provision by food service operational types for residential facilities. J Health Info Stat 2022; 47(4): 258-267. ArticlePDF
- 10. Goo SY. Current status and challenges of meal support for the elderly in a super-aged society [Internet]. National Assembly Research Service; 2024 [cited 2025 Aug 2]. Available from: https://www.nars.go.kr/report/view.do?cmsCode=CM0043&brdSeq=44860
- 11. Ham S, Kim K. Evaluation of the dietary quality and nutritional status of elderly people using the Nutrition Quotient for Elderly (NQ-E) in Seoul. J Nutr Health 2020; 53(1): 68-82. ArticleLink
- 12. Lee M, Kim J, Park O, Lee Y. A study on the needs for nutrition management program for elderly who use welfare facilities. Korean J Community Nutr 2016; 21(1): 65-74. ArticleLink
- 13. Lee Y, Kim J, Lee M, Park O, Yoo H. Investigation of food and nutrition management program and its needs for the aged using the elderly welfare facility. J Nutr Educ Behav 2014; 46(4 Suppl): S163.Article
- 14. Lee JE. Current status of foodservice nutrition management and effects of welfare facility support for the elderly in Cheongju city. Nutr Res Pract 2022; 16(4): 527-536. ArticlePubMedPMCLink
- 15. Kwon J, Lee SH, Lee KM, Lee Y. Study on energy and nutrient intake and food preference of the elderly in care facilities. Korean J Community Nutr 2016; 21(2): 200-217. ArticleLink
- 16. Han G, Yang E. Status of health and nutritional intake of the elderly in long-term care facilities: focus on Gwangju metropolitan city. J Nutr Health 2020; 53(1): 27-38. ArticleLink
- 17. Choi D, Lee Y, Park H, Song K, Hwang J. Dietary quality of lunches in senior leisure service facilities in South Korea: analysis of data from the 2013-2017 Korea National Health and Nutrition Examination Survey. Nutr Res Pract 2021; 15(2): 266-277. ArticlePubMedPMCLink
- 18. Kim WG, Choi I, Yoon J. Nutritional quality of lunches consumed by Korean workers: comparison between institutional and commercial lunches. Nutr Res Pract 2016; 10(6): 606-615. ArticlePubMedPMCLink
- 19. Scouten S, Lucia VC, Wunderlich T, Uhley V, Afonso NM. An assessment of needs of church coordinators providing meals to a homeless shelter. J Health Care Poor Underserved 2016; 27(3): 1211-1219. ArticlePubMed
- 20. Ministry of Health and Welfare (MOHW), The Korean Nutrition Society. Dietary reference intakes for Koreans 2025. MOHW; 2025. p. 8-18.
- 21. Guthrie HA, Scheer JC. Validity of a dietary score for assessing nutrient adequacy. J Am Diet Assoc 1981; 78(3): 240-245. ArticlePubMed
- 22. Kant AK, Block G, Schatzkin A, Ziegler RG, Nestle M. Dietary diversity in the US population, NHANES II, 1976-1980. J Am Diet Assoc 1991; 91(12): 1526-1531. ArticlePubMed
- 23. Condrasky MD, Baruth M, Wilcox S, Carter C, Jordan JF. Cooks training for faith, activity, and nutrition project with AME churches in SC. Eval Program Plann 2013; 37: 43-49. ArticlePubMedPMC
- 24. Shin WY, Cho SH, Kim JH. Workplace foodservice meals are associated with higher nutritional quality among adult Korean workers: a nationwide cross-sectional study. Nutr Res Pract 2022; 16(2): 248-259. ArticlePubMedPMCLink
- 25. Baum JI, Kim IY, Wolfe RR. Protein consumption and the elderly: what is the optimal level of intake? Nutrients 2016; 8(6): 359.ArticlePubMedPMC
- 26. Wilcox S, Parrott A, Baruth M, Laken M, Condrasky M, Saunders R, et al. The faith, activity, and nutrition program: a randomized controlled trial in African-American churches. Am J Prev Med 2013; 44(2): 122-131. ArticlePubMedPMC
- 27. Wilcox S, Laken M, Parrott AW, Condrasky M, Saunders R, Addy CL, et al. The faith, activity, and nutrition (FAN) program: design of a participatory research intervention to increase physical activity and improve dietary habits in African American churches. Contemp Clin Trials 2010; 31(4): 323-335. ArticlePubMedPMC
REFERENCES
Figure & Data
REFERENCES
Citations
Citations to this article as recorded by 
 Cite
Cite- Figure
-
- We recommend
- Related articles
-
- Association between nutrient intake and frailty status in Korean older adults: a cross-sectional study using the 9th (2022–2023) Korea National Health and Nutrition Examination Survey
- Comparison of dietary behaviors and nutrient intake by gender and household type among older Koreans: a cross-sectional study using data from the 8th Korea National Health and Nutrition Examination Survey
- Prevalence of coronary artery disease according to lifestyle characteristics, nutrient intake level, and comorbidities among Koreans aged 40 years and older: a cross-sectional study using data from the 7th (2016–2018) Korea National Health and Nutrition Examination Survey
- Ultra-processed food intake and dietary behaviors in Korean adolescents: a cross-sectional study based on the 2019–2023 Korea National Health and Nutrition Examination Survey
- Self-reported weight change and diet quality in relation to metabolic syndrome among Korean cancer survivors: a cross-sectional study using the Korea National Health and Nutrition Examination Survey 2019–2021
Differences in lunch nutrient intake and nutritional adequacy among Korean older adults by meal site: a cross-sectional analysis of the 2018–2021 Korea National Health and Nutrition Examination Survey data

Fig. 1. Flow diagram of participant selection.
Fig. 1.
Differences in lunch nutrient intake and nutritional adequacy among Korean older adults by meal site: a cross-sectional analysis of the 2018–2021 Korea National Health and Nutrition Examination Survey data
| Category | WP (n = 187) | WC (n = 145) | RI (n = 155) | Total (n = 487) | P-value |
|---|---|---|---|---|---|
| Sex | < 0.001 | ||||
| Male | 101 (57.0) | 69 (46.3) | 36 (22.5) | 206 (42.9) | |
| Female | 86 (43.0) | 76 (53.7) | 119 (77.5) | 281 (57.1) | |
| Age (year) | < 0.001 | ||||
| < 75 | 169 (91.9) | 53 (37.8) | 75 (46.8) | 297 (61.9) | |
| ≥ 75 | 18 (8.1) | 92 (62.2) | 80 (53.2) | 190 (38.1) | |
| Area of residence | 0.788 | ||||
| Urban | 143 (76.6) | 118 (80.4) | 119 (77.8) | 380 (78.1) | |
| Rural area | 44 (23.4) | 27 (19.6) | 36 (22.2) | 107 (21.9) | |
| Education level (n = 469) | 0.941 | ||||
| ≤ Elementary school | 58 (24.1) | 44 (22.7) | 51 (23.6) | 153 (23.6) | |
| Middle school | 21 (8.7) | 21 (10.7) | 12 (10.4) | 54 (9.9) | |
| High school | 55 (34.9) | 31 (29.9) | 36 (29.3) | 122 (31.7) | |
| ≥ College | 49 (32.2) | 43 (36.7) | 48 (36.7) | 140 (34.9) | |
| Marital status | 0.244 | ||||
| Married | 130 (67.9) | 95 (60.2) | 99 (58.2) | 324 (62.6) | |
| Single | 57 (32.1) | 50 (39.8) | 56 (41.8) | 163 (37.4) | |
| National basic livelihood security recipient | 0.743 | ||||
| Yes | 9 (4.1) | 6 (2.9) | 8 (4.4) | 23 (3.9) | |
| No | 178 (95.9) | 139 (97.1) | 147 (95.6) | 464 (96.1) | |
| Personal income quartile | 0.497 | ||||
| Low | 40 (20.3) | 37 (22.7) | 36 (19.8) | 113 (20.8) | |
| Middle-low | 60 (33.8) | 29 (21.8) | 42 (29.1) | 131 (28.8) | |
| Middle-high | 41 (19.8) | 40 (28.0) | 40 (26.4) | 121 (24.3) | |
| High | 46 (26.1) | 39 (27.5) | 37 (24.7) | 122 (26.1) | |
| Monthly household income (1,000 KRW) | 508.79 ± 31.11 | 532.00 ± 36.50 | 513.84 ± 37.01 | 518.21 ± 19.48 | 0.891 |
| Category | WP (n = 187) | WC (n = 145) | RI (n = 155) | Total (n = 487) | P-value |
|---|---|---|---|---|---|
| BMI (kg/m2) | 23.65 ± 0.43 | 22.91 ± 0.47 | 23.02 ± 0.40 | 23.19 ± 0.25 | 0.553 |
| Self-rated health status (n = 470) | 0.695 | ||||
| Very good | 4 (2.4) | 5 (3.6) | 8 (5.8) | 17 (3.8) | |
| Good | 7 (2.8) | 4 (2.5) | 3 (2.0) | 14 (2.4) | |
| Moderate | 20 (9.8) | 13 (6.9) | 17 (11.0) | 50 (9.3) | |
| Poor | 90 (46.9) | 74 (55.1) | 76 (49.7) | 240 (50.1) | |
| Very poor | 48 (27.2) | 36 (24.3) | 43 (26.8) | 127 (26.4) | |
| Average |
3.34 ± 0.08 | 3.29 ± 0.06 | 3.23 ± 0.07 | 3.29 ± 0.04 | 0.565 |
| Chewing problems (n = 390) | 0.173 | ||||
| Very uncomfortable | 4 (1.1) | 5 (3.1) | 4 (2.3) | 13 (2.1) | |
| Uncomfortable | 27 (14.8) | 24 (17.1) | 19 (12.8) | 70 (14.8) | |
| Moderate | 25 (18.5) | 13 (12.6) | 13 (9.6) | 51 (14.0) | |
| Not uncomfortable | 42 (29.5) | 25 (23.8) | 34 (21.7) | 101 (25.4) | |
| Not uncomfortable at all | 53 (36.0) | 48 (43.3) | 54 (53.7) | 155 (43.7) | |
| Average |
3.85 ± 0.09 | 3.87 ± 0.12 | 4.12 ± 0.11 | 3.95 ± 0.06 | 0.116 |
| Food groups | WP (n = 187) | WC (n = 145) | RI (n = 155) | Total (n = 487) | P-value |
|---|---|---|---|---|---|
| Grains (g) | 80.55 ± 12.27 | 72.13 ± 3.80 | 96.04 ± 22.97 | 82.91 ± 5.72 | 0.156 |
| Potatoes and starch (g) | 12.33 ± 1.39 |
1.70 ± 1.00 |
6.85 ± 1.71 |
6.96 ± 0.25 | < 0.001 |
| Sugars (g) | 2.97 ± 0.46 |
0.79 ± 0.73 |
0.69 ± 0.54 |
1.82 ± 0.26 | 0.016 |
| Beans (g) | 12.61 ± 1.50 | 11.71 ± 2.97 | 13.68 ± 6.51 | 12.67 ± 3.31 | 0.703 |
| Seeds and nuts (g) | 0.76 ± 0.16 | 0.51 ± 0.14 | 0.40 ± 0.16 | 0.55 ± 0.08 | 0.163 |
| Vegetables (g) | 125.80 ± 16.54 | 111.54 ± 12.49 | 117.99 ± 18.05 | 118.44 ± 7.43 | 0.829 |
| Mushrooms (g) | 9.72 ± 4.02 | 13.14 ± 0.54 | 8.21 ± 5.74 | 10.36 ± 3.08 | 0.415 |
| Fruits (g) | 27.50 ± 2.52 | 24.56 ± 2.53 | 18.78 ± 2.95 | 24.64 ± 1.60 | 0.201 |
| Meats (g) | 59.28 ± 7.56 |
31.68 ± 1.28 |
13.78 ± 4.62 |
34.91 ± 2.19 | 0.003 |
| Eggs (g) | 4.51 ± 2.08 | 4.61 ± 0.00 | 79.31 ± 23.69 | 29.48 ± 7.76 | 0.105 |
| Seafoods (g) | 5.45 ± 6.33 |
29.93 ± 6.58 |
7.07 ± 6.58 |
14.15 ± 2.88 | 0.023 |
| Seaweeds (g) | 19.56 ± 8.21 | 33.40 ± 2.16 | 25.52 ± 1.70 | 26.16 ± 4.02 | 0.412 |
| Dairy products (g) | 24.96 ± 2.57 |
31.52 ± 2.59 |
21.51 ± 3.04 |
26.10 ± 1.72 | < 0.001 |
| Drinks (g) | 82.97 ± 9.99 |
79.55 ± 10.01 |
52.53 ± 11.77 |
73.02 ± 6.61 | < 0.001 |
| Nutrient intakes | WP (n = 187) | WC (n = 145) | RI (n = 155) | Total (n = 487) | P-value |
|---|---|---|---|---|---|
| Energy (kcal) | 599.82 ± 41.23 | 595.85 ± 32.02 | 607.63 ± 53.53 | 601.10 ± 23.39 | > 0.999 |
| Water (g) | 252.11 ± 13.22 | 251.74 ± 13.26 | 219.04 ± 14.03 | 240.96 ± 6.91 | 0.128 |
| Carbohydrates (g) | 88.40 ± 2.83 | 92.48 ± 1.89 | 96.89 ± 3.93 | 92.59 ± 1.73 | 0.163 |
| Protein (g) | 25.52 ± 1.08 |
23.30 ± 0.63 |
21.17 ± 0.99 |
23.33 ± 0.53 | 0.008 |
| Fat (g) | 15.81 ± 1.05 | 14.77 ± 0.77 | 13.75 ± 1.50 | 14.77 ± 0.66 | 0.507 |
| Energy contribution (%) | |||||
| Carbohydrate | 62.05 ± 1.35 | 63.28 ± 1.25 | 66.69 ± 1.55 | 64.01 ± 0.79 | 0.069 |
| Protein | 16.29 ± 0.55 |
15.07 ± 0.43 |
13.87 ± 0.55 |
15.08 ± 0.28 | 0.007 |
| Fat | 20.05 ± 1.14 | 20.24 ± 1.06 | 18.16 ± 1.36 | 19.48 ± 0.65 | 0.458 |
| Dietary fiber (g) | 7.12 ± 0.40 | 7.41 ± 0.33 | 6.95 ± 0.35 | 7.16 ± 0.21 | 0.635 |
| Sugar (g) | 11.61 ± 1.37 | 11.08 ± 1.16 | 10.54 ± 1.45 | 11.08 ± 0.75 | > 0.999 |
| Calcium (mg) | 135.00 ± 11.25 | 152.16 ± 12.56 | 135.68 ± 12.75 | 140.95 ± 6.62 | 0.744 |
| Iron (mg) | 3.72 ± 0.23 | 3.72 ± 0.28 | 3.03 ± 0.19 | 3.49 ± 0.11 | 0.061 |
| Phosphorus (mg) | 340.26 ± 11.17 |
333.77 ± 9.49 |
300.55 ± 12.19 |
324.86 ± 5.72 | 0.049 |
| Sodium (mg) | 1,196.26 ± 65.72 | 1,210.45 ± 55.60 | 1,160.69 ± 81.03 | 1,189.13 ± 39.88 | > 0.999 |
| Potassium (mg) | 774.76 ± 35.99 | 796.11 ± 32.37 | 704.86 ± 41.62 | 758.58 ± 18.47 | 0.122 |
| Magnesium (mg) | 95.41 ± 4.03 | 98.03 ± 4.21 | 88.38 ± 4.15 | 93.94 ± 2.22 | 0.204 |
| Vitamin A (μg RAE) | 127.46 ± 14.73 | 121.72 ± 12.08 | 93.71 ± 11.57 | 114.30 ± 8.11 | 0.131 |
| Thiamine (mg) | 0.49 ± 0.03 |
0.39 ± 0.02 |
0.34 ± 0.03 |
0.41 ± 0.02 | 0.001 |
| Riboflavin (mg) | 0.48 ± 0.03 | 0.47 ± 0.03 | 0.41 ± 0.03 | 0.45 ± 0.02 | 0.149 |
| Niacin (mg) | 4.15 ± 0.26 |
3.64 ± 0.18 |
3.14 ± 0.22 |
3.65 ± 0.12 | 0.012 |
| Vitamin C (mg) | 14.35 ± 1.84 | 15.94 ± 2.36 | 14.87 ± 2.62 | 15.05 ± 1.21 | > 0.999 |
| Vitamin D (μg) | 1.06 ± 0.24 | 1.09 ± 0.20 | 0.88 ± 0.29 | 1.01 ± 0.13 | > 0.999 |
| Vitamin E (mg) | 2.23 ± 0.18 | 2.11 ± 0.09 | 1.89 ± 0.13 | 2.08 ± 0.07 | 0.251 |
| Category | WP (n = 187) | WC (n = 145) | RI (n = 155) | Total (n = 487) | P-value |
|---|---|---|---|---|---|
| NAR | |||||
| Carbohydrates | 1.77 ± 0.09 |
2.17 ± 0.15 |
2.15 ± 0.13 |
2.03 ± 0.06 | 0.039 |
| Protein | 0.80 ± 0.03 | 0.85 ± 0.02 | 0.81 ± 0.03 | 0.82 ± 0.01 | 0.240 |
| Calcium | 0.43 ± 0.03 | 0.48 ± 0.04 | 0.45 ± 0.03 | 0.45 ± 0.02 | 0.505 |
| Iron | 0.72 ± 0.03 | 0.83 ± 0.03 | 0.79 ± 0.03 | 0.78 ± 0.02 | 0.075 |
| Phosphorus | 0.87 ± 0.02 | 0.91 ± 0.02 | 0.84 ± 0.03 | 0.87 ± 0.01 | 0.095 |
| Vitamin A | 0.39 ± 0.05 | 0.42 ± 0.04 | 0.49 ± 0.05 | 0.43 ± 0.03 | 0.296 |
| Thiamine | 0.78 ± 0.03 |
0.86 ± 0.02 |
0.75 ± 0.03 |
0.80 ± 0.02 | 0.012 |
| Riboflavin | 0.66 ± 0.04 | 0.73 ± 0.03 | 0.70 ± 0.04 | 0.70 ± 0.02 | 0.367 |
| Niacin | 0.60 ± 0.03 |
0.69 ± 0.03 |
0.57 ± 0.03 |
0.62 ± 0.02 | 0.009 |
| Folate | 0.59 ± 0.03 | 0.63 ± 0.04 | 0.70 ± 0.04 | 0.64 ± 0.02 | 0.060 |
| Vitamin C | 0.32 ± 0.04 | 0.40 ± 0.04 | 0.44 ± 0.04 | 0.38 ± 0.02 | 0.050 |
| MAR | 0.77 ± 0.03 | 0.87 ± 0.04 | 0.85 ± 0.04 | 0.83 ± 0.02 | 0.100 |
Table 1. General characteristics of participants according to meal location
n (%) or Mean ± SE. WP, workplace group; WC, welfare center group; RI, religious institution group.
Table 2. Body mass index, self-rated health status, and chewing problems according to meal location
n (%) or Mean ± SE. WP, workplace group; WC, welfare center group; RI, religious institution group; BMI, body mass index. 5-point Likert scale. Higher scores indicate better self-rated health or less chewing difficulty.
Table 3. Comparison of food group intake at lunch according to meal location
Adjusted Mean ± SE WP, workplace group; WC, welfare center group; RI, religious institution group. Different letters indicate statistically significant differences according to the Bonferroni test.
Table 4. Energy and nutrient intake of participants at lunch according to meal location
Adjusted Mean ± SE. WP, workplace group; WC, welfare center group; RI, religious institution group. Different letters indicate statistically significant differences according to the Bonferroni test.
Table 5. NAR and MAR at lunch according to meal location
Adjusted Mean ± SE. NAR, nutrient adequacy ratio; MAR, mean adequacy ratio; WP, workplace group; WC, welfare center group; RI, religious institution group. Different letters indicate statistically significant differences according to the Bonferroni test.


