
Articles
- Page Path
- HOME > Korean J Community Nutr > Volume 31(1); 2026 > Article
-
Research Article
한국 노인의 성별 및 가구 유형에 따른 식생활 형태 및 영양소 섭취 실태 비교: 제8기 국민건강영양조사를 활용한 단면연구 -
박단아1)
 , 이수경2),†
 - Comparison of dietary behaviors and nutrient intake by gender and household type among older Koreans: a cross-sectional study using data from the 8th Korea National Health and Nutrition Examination Survey
-
Dana Park1), Soo-Kyung Lee2),†
-
Korean Journal of Community Nutrition 2026;31(1):87-100.
DOI: https://doi.org/10.5720/kjcn.2025.00367
Published online: February 28, 2026
1)인하대학교 식품영양학과 대학원생
2)인하대학교 식품영양학과 교수
1)Graduate Student, Department of Food and Nutrition, Inha University, Incheon, Korea
2)Professor, Department of Food and Nutrition, Inha University, Incheon, Korea
- †Corresponding author: Soo-Kyung Lee Department of Food and Nutrition, Inha University, 100 Inha-ro, Michuhol-gu, Incheon 22212, Korea Tel: +82-32-860-8121 Email: skleenutrition@inha.ac.kr
• Received: December 19, 2025 • Revised: January 29, 2026 • Accepted: February 11, 2026
© 2026 The Korean Society of Community Nutrition
This is an Open-Access article distributed under the terms of the Creative Commons Attribution Non-Commercial License (http://creativecommons.org/licenses/by-nc/4.0) which permits unrestricted non-commercial use, distribution, and reproduction in any medium, provided the original work is properly cited.
- 894 Views
- 60 Download
Abstract
-
Objectives
- This study aimed to identify gender- and household type-specific nutritional vulnerability among older Koreans by comparing dietary behaviors, nutrient intake, and diet quality.
-
Methods
- We analyzed data from 2,412 adults aged ≥ 65 years (1,118 men; 1,294 women) from the 8th Korea National Health and Nutrition Examination Survey (2019–2021). Household type was classified as one-person, couple-only, or with-children. Outcome variables included dietary behavior, daily energy and nutrient intake, and diet quality, assessed using the Korean Healthy Eating Index (KHEI). Analyses were carried out accounting for the complex sampling design, adjusting for age, residential area, education level, household income level, economic activity status, self-rated health status, and survey year.
-
Results
- Elderly men in one-person households, compared with those in couple-only households, were more likely to skip breakfast and lunch and to consume less energy. The odds of intake below the estimated average requirement (EAR) were higher for iron (odds ratio [OR] = 1.731, P = 0.022) and zinc (OR = 2.460, P = 0.002) among men in one-person households. The KHEI score was the lowest among men in one-person households. Elderly women in with-children households, compared with those in couple-only households, were more likely to skip breakfast and to consume less energy. The risks of intake below the estimated energy requirement (EER) and EAR were higher among women in with-children households than those in couple-only households (EER: OR = 1.448; magnesium: OR = 2.090; iron: OR = 1.692; zinc: OR = 1.902; folate: OR = 2.282; all P < 0.05). The KHEI score was lower among women in with-children households.
-
Conclusion
- Elderly men living alone and elderly women living with children showed significantly greater nutritional vulnerability. More attention should be given to understanding how gender-specific household types can affect nutritional vulnerability in later life.
INTRODUCTION
METHODS
1) 독립변수: 가구 유형
2) 종속변수: 식생활 관련 변수
3) 일반적 특성
RESULTS
DISCUSSION
-
CONFLICT OF INTEREST
There are no financial or other issues that might lead to conflict of interest.
-
FUNDING
None.
-
DATA AVAILABILITY
The data that support the findings of this study are openly available in KNHANES at https://knhanes.kdca.go.kr/knhanes/main.do.
NOTES
Fig. 1.Flowchart of inclusion and exclusion of study participants. KNHANES, Korea National Health and Nutrition Examination Survey; FPG, fasting plasma glucose; HbA1c, glycated hemoglobin.
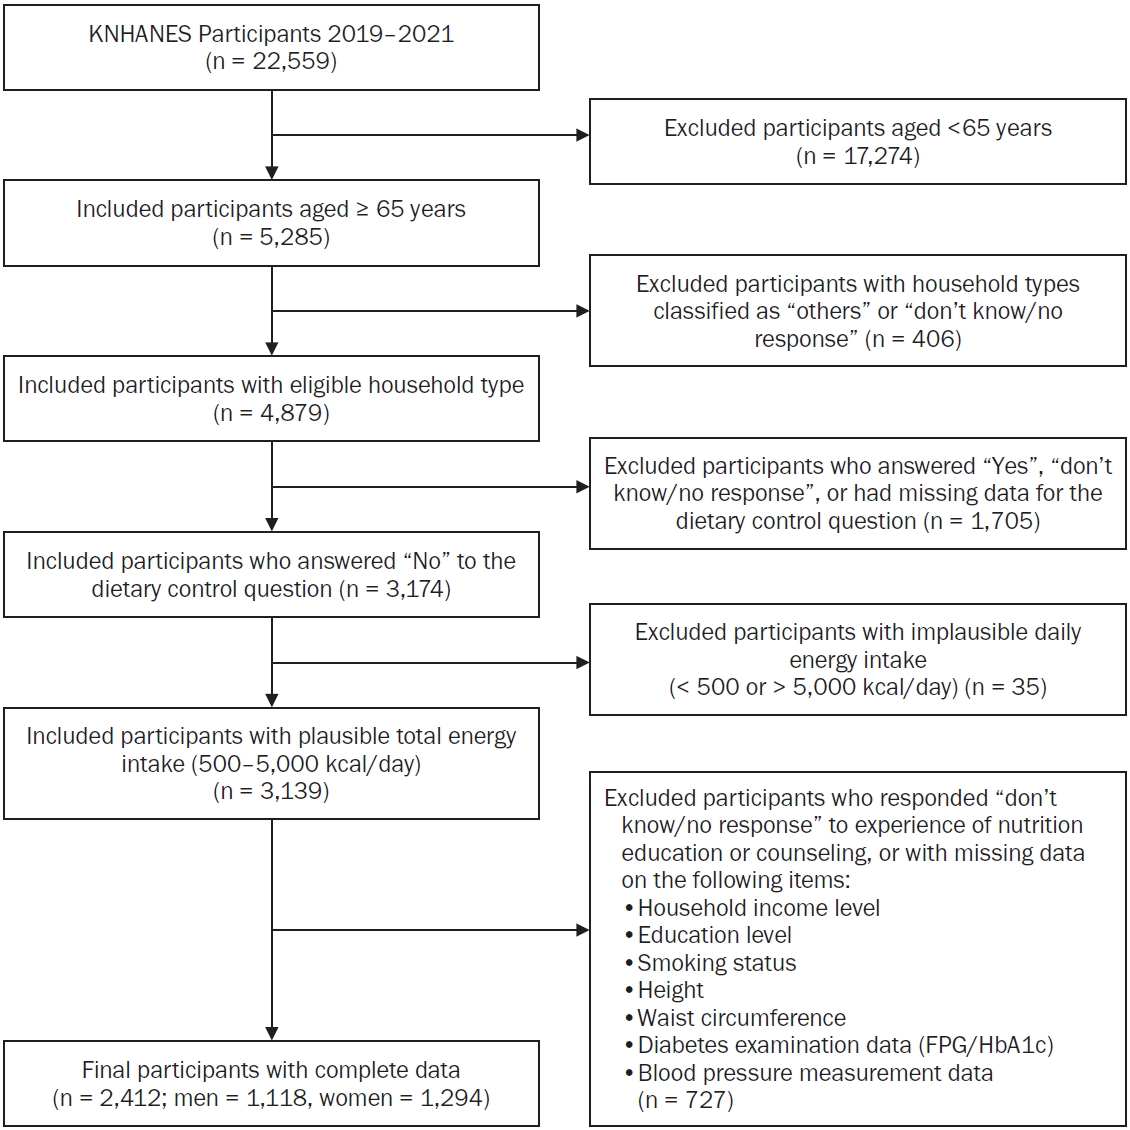
Table 1.General characteristics of the participants by household type and gender
| Variables | Men (n = 1,118) | P-value | Women (n = 1,294) | P-value | ||||
|---|---|---|---|---|---|---|---|---|
| One-person (n = 170) | Couple-only (n = 737) | With-children (n = 211) | One-person (n = 468) | Couple-only (n = 535) | With-children (n = 291) | |||
| Age (year) | ||||||||
| 65–74 | 104 (62.0) | 441 (61.4) | 138 (63.3) | 0.896 | 200 (46.0) | 392 (73.8) | 199 (70.2) | < 0.001 |
| ≥ 75 | 66 (38.0) | 296 (38.6) | 73 (36.7) | 268 (54.0) | 143 (26.2) | 92 (29.8) | ||
| Mean age (year) | 72.69 ± 0.42 | 72.89 ± 0.20 | 72.09 ± 0.44 | 0.175 | 74.45 ± 0.27a | 71.27 ± 0.22b | 71.92 ± 0.33b | < 0.001 |
| Residential area | 0.002 | < 0.001 | ||||||
| Urban | 121 (75.0) | 478 (68.8) | 172 (82.3) | 307 (70.3) | 355 (68.9) | 237 (86.8) | ||
| Rural | 49 (25.0) | 259 (31.2) | 39 (17.7) | 161 (29.7) | 180 (31.1) | 54 (13.2) | ||
| Education level | 0.731 | 0.002 | ||||||
| ≤ Elementary school | 62 (33.2) | 304 (39.9) | 80 (39.4) | 357 (74.2) | 335 (59.4) | 184 (59.5) | ||
| Middle school | 41 (23.5) | 143 (19.6) | 34 (17.8) | 49 (11.1) | 99 (19.9) | 52 (17.7) | ||
| High school | 40 (27.0) | 178 (24.6) | 63 (28.6) | 42 (10.2) | 77 (16.0) | 40 (17.4) | ||
| ≥ College | 27 (16.2) | 112 (16.0) | 34 (14.3) | 20 (4.5) | 24 (4.7) | 15 (5.5) | ||
| Household income level | < 0.001 | < 0.001 | ||||||
| Lowest quartile | 111 (64.8) | 287 (38.0) | 34 (18.8) | 354 (72.9) | 250 (45.0) | 77 (32.2) | ||
| Lower-middle quartile | 31 (18.3) | 266 (35.4) | 62 (32.6) | 89 (21.2) | 184 (35.0) | 80 (27.5) | ||
| Upper-middle quartile | 22 (13.6) | 126 (18.3) | 60 (24.3) | 17 (4.1) | 79 (15.8) | 79 (22.2) | ||
| Highest quartile | 6 (3.3) | 58 (8.3) | 55 (24.3) | 8 (1.8) | 22 (4.1) | 55 (18.1) | ||
| Currently working1) | 0.153 | 0.291 | ||||||
| Yes | 66 (38.5) | 351 (48.0) | 97 (43.6) | 171 (35.9) | 185 (33.3) | 89 (29.5) | ||
| No | 104 (61.5) | 386 (52.0) | 114 (56.4) | 297 (64.1) | 350 (66.7) | 202 (70.5) | ||
| Smoking status2) | 0.158 | 0.297 | ||||||
| Yes | 45 (27.4) | 132 (19.0) | 48 (20.9) | 20 (4.8) | 10 (2.5) | 12 (5.1) | ||
| No | 125 (72.6) | 605 (81.0) | 163 (79.1) | 448 (95.2) | 525 (97.5) | 279 (94.9) | ||
| Drinking status3) | 0.922 | 0.883 | ||||||
| Yes | 99 (59.6) | 443 (59.9) | 127 (58.4) | 78 (17.7) | 94 (17.5) | 52 (18.8) | ||
| No | 71 (40.4) | 294 (40.1) | 84 (41.6) | 390 (82.3) | 441 (82.5) | 239 (81.2) | ||
| Self-rated health status4) | 0.018 | 0.542 | ||||||
| Good | 37 (23.4) | 248 (33.6) | 69 (32.5) | 90 (20.3) | 111 (21.0) | 77 (25.6) | ||
| Fair | 86 (48.1) | 369 (50.9) | 104 (51.5) | 220 (47.1) | 252 (46.2) | 126 (44.4) | ||
| Poor | 47 (28.5) | 120 (15.5) | 38 (16.0) | 158 (32.6) | 172 (32.8) | 88 (29.9) | ||
| BMI (kg/m2) | 23.47 ± 0.23 | 23.85 ± 0.15 | 23.60 ± 0.24 | 0.329 | 24.19 ± 0.18 | 24.44 ± 0.17 | 24.32 ± 0.30 | 0.657 |
| Obesity5) | 52 (28.0) | 233 (31.8) | 65 (32.0) | 0.700 | 175 (37.2) | 201 (38.6) | 118 (39.2) | 0.878 |
| Abdominal obesity6) | 71 (43.3) | 325 (44.4) | 90 (43.8) | 0.970 | 251 (53.3) | 273 (52.4) | 170 (54.8) | 0.821 |
| Diabetes7) | 42 (24.3) | 189 (25.0) | 58 (30.0) | 0.345 | 123 (26.6) | 134 (24.7) | 75 (24.2) | 0.777 |
| Hypertension8) | 98 (60.1) | 424 (57.5) | 116 (56.0) | 0.785 | 315 (65.6) | 348 (65.0) | 182 (60.5) | 0.332 |
n (weighted %) or weighted mean ± SE.
Statistical analysis: Values were obtained using the general linear model for continuous variables and the χ2 test for categorical variables in complex sample survey data analysis (P < 0.05).
BMI, body mass index.
1)Currently working: “Yes” = currently employed; “No” = unemployed or economically inactive individuals.
2)Smoking status: “Yes” = current smoker; “No” = former smoker or never smoker.
3)Drinking status: “Yes” = consumed alcohol at least once a month in the past year; “No” = lifetime abstainer or consumed less than once a month.
4)Self-rated health status: “Good” = very good or good, “Fair” = fair, “Poor” = poor or very poor.
5)Obesity: defined as BMI ≥ 25 kg/m2.
6)Abdominal obesity: defined as a waist circumference ≥ 90 cm for men and ≥ 85 cm for women.
7)Diabetes: defined as fasting plasma glucose (FPG) ≥ 126 mg/dL, HbA1c ≥ 6.5%, or current use of antidiabetic medication.
8)Hypertension: defined as systolic blood pressure ≥ 140 mmHg, diastolic blood pressure ≥ 90 mmHg, or current use of antihypertensive medication.
a,bValues are significantly different according to the Bonferroni post hoc test (P < 0.05).
Table 2.Differences in dietary behaviors and nutrition-related factors by household type and gender
| Variables | Men (n = 1,118) | P-value | Women (n = 1,294) | P-value | ||||
|---|---|---|---|---|---|---|---|---|
| One-person (n = 170) | Couple-only (n = 737) | With-children (n = 211) | One-person (n = 468) | Couple-only (n = 535) | With-children (n = 291) | |||
| Breakfast skipping status | < 0.001 | < 0.001 | ||||||
| Yes | 17 (10.2) | 22 (2.8) | 11 (3.5) | 26 (5.7) | 19 (3.6) | 32 (11.8) | ||
| No | 153 (89.8) | 715 (97.2) | 200 (96.5) | 442 (94.3) | 516 (96.4) | 259 (88.2) | ||
| Lunch skipping status | 0.008 | 0.062 | ||||||
| Yes | 22 (12.0) | 27 (4.5) | 16 (9.4) | 59 (12.9) | 34 (7.6) | 23 (8.4) | ||
| No | 148 (88.0) | 710 (95.5) | 195 (90.6) | 409 (87.1) | 501 (92.4) | 268 (91.6) | ||
| Dinner skipping status | 0.399 | 0.253 | ||||||
| Yes | 5 (3.5) | 15 (1.8) | 3 (1.3) | 32 (7.0) | 24 (4.6) | 10 (4.0) | ||
| No | 165 (96.5) | 722 (98.2) | 208 (98.7) | 436 (93.0) | 511 (95.4) | 281 (96.0) | ||
| Breakfast companionship status1) | < 0.001 | < 0.001 | ||||||
| Yes | 17 (9.4) | 600 (81.0) | 140 (66.3) | 26 (4.8) | 434 (78.5) | 160 (53.8) | ||
| No | 138 (81.4) | 118 (16.4) | 56 (27.6) | 412 (88.3) | 77 (16.6) | 101 (34.5) | ||
| Not applicable | 15 (9.2) | 19 (2.6) | 15 (6.1) | 30 (6.9) | 24 (4.9) | 30 (11.7) | ||
| Lunch companionship status1) | < 0.001 | < 0.001 | ||||||
| Yes | 40 (22.3) | 541 (71.0) | 122 (56.2) | 85 (18.0) | 399 (72.2) | 153 (47.7) | ||
| No | 114 (69.1) | 177 (25.4) | 80 (38.2) | 346 (74.2) | 108 (21.5) | 125 (47.6) | ||
| Not applicable | 16 (8.6) | 19 (3.6) | 9 (5.6) | 37 (7.8) | 28 (6.3) | 13 (4.7) | ||
| Dinner companionship status1) | < 0.001 | < 0.001 | ||||||
| Yes | 22 (11.5) | 663 (90.2) | 165 (78.5) | 37 (7.5) | 477 (87.3) | 197 (65.0) | ||
| No | 146 (86.5) | 67 (8.9) | 46 (21.5) | 418 (90.0) | 51 (11.3) | 92 (33.4) | ||
| Not applicable | 2 (2.0) | 7 (0.9) | 0 (0.0) | 13 (2.6) | 7 (1.4) | 2 (1.6) | ||
| Frequency of eating out | 0.098 | 0.003 | ||||||
| ≥ Once/day | 14 (8.9) | 25 (4.2) | 19 (8.9) | 7 (1.1) | 7 (0.9) | 6 (2.1) | ||
| 5–6 times/week | 14 (8.4) | 71 (10.0) | 23 (8.9) | 23 (5.4) | 15 (2.3) | 14 (4.6) | ||
| 3–4 times/week | 18 (10.3) | 61 (8.0) | 27 (11.9) | 24 (5.2) | 16 (3.1) | 22 (6.9) | ||
| 1–2 times/week | 40 (23.2) | 163 (22.3) | 55 (26.0) | 101 (22.4) | 111 (22.4) | 57 (19.7) | ||
| 1–3 times/month | 48 (28.0) | 282 (37.2) | 54 (28.3) | 133 (28.1) | 217 (40.1) | 119 (40.5) | ||
| < Once/month | 36 (21.2) | 135 (18.2) | 33 (16.1) | 180 (37.7) | 169 (31.3) | 73 (26.2) | ||
| Experience of nutrition education or counseling | 0.671 | 0.159 | ||||||
| Yes | 6 (3.9) | 22 (2.7) | 3 (2.1) | 37 (7.3) | 27 (4.5) | 14 (4.3) | ||
| No | 164 (96.1) | 715 (97.3) | 208 (97.9) | 431 (92.7) | 508 (95.5) | 277 (95.7) | ||
| Dietary supplement use2) | 0.111 | 0.195 | ||||||
| Yes | 90 (51.2) | 425 (59.3) | 117 (52.3) | 297 (65.5) | 361 (70.3) | 183 (64.1) | ||
| No | 80 (48.8) | 312 (40.7) | 94 (47.7) | 171 (34.5) | 174 (29.7) | 108 (35.9) | ||
| Awareness of nutrition labeling | 0.688 | 0.001 | ||||||
| Yes | 74 (45.4) | 318 (44.7) | 88 (41.4) | 154 (37.0) | 251 (49.9) | 139 (50.9) | ||
| No | 96 (54.6) | 419 (55.3) | 123 (58.6) | 314 (63.0) | 284 (50.1) | 152 (49.1) | ||
n (weighted %).
n: unweighted value, %: weighted value.
Statistical analysis: χ2 tests were used for categorical variables in complex sample survey data analysis (P < 0.05).
1)Companionship status: “Yes” = ate the meal with family or others; “No” = ate alone; “Not applicable” = meal frequency was ≤ 2 times per week during the past year.
2)Dietary supplement use: Use of dietary supplements for ≥ 2 weeks during the past year.
Table 3.Comparison of daily energy and nutrient consumption and energy distribution ratios by household type and gender
| Variables | Men (n = 1,118) | P-value | Women (n = 1,294) | P-value | ||||
|---|---|---|---|---|---|---|---|---|
| One-person (n = 170) | Couple-only (n = 737) | With-children (n = 211) | One-person (n = 468) | Couple-only (n = 535) | With-children (n = 291) | |||
| Energy (kcal) | 1,681.98 ± 52.65b | 1,848.92 ± 23.50a | 1,836.76 ± 49.93ab | 0.033 | 1,373.38 ± 27.84ab | 1,439.42 ± 27.13a | 1,346.75 ± 28.66b | 0.035 |
| Protein (g) | 57.37 ± 2.22b | 66.76 ± 1.15a | 65.43 ± 2.20a | 0.004 | 46.68 ± 1.22ab | 51.37 ± 1.93a | 45.91 ± 1.34b | 0.033 |
| Carbohydrate (g) | 268.36 ± 6.88b | 298.00 ± 3.63a | 292.06 ± 7.28a | 0.003 | 234.59 ± 4.75ab | 246.69 ± 4.22a | 228.66 ± 4.91b | 0.009 |
| Calcium (mg) | 461.38 ± 22.44 | 527.74 ± 12.69 | 534.23 ± 24.61 | 0.051 | 399.12 ± 13.41b | 465.04 ± 13.61a | 403.00 ± 18.00b | 0.002 |
| Sodium (mg) | 3,309.06 ± 176.23 | 3,400.07 ± 71.02 | 3,431.21 ± 133.89 | 0.864 | 2,333.42 ± 71.19b | 2,690.67 ± 88.69a | 2,315.41 ± 97.34b | 0.003 |
| Potassium (mg) | 2,464.25 ± 98.39b | 2,945.25 ± 51.24a | 2,859.41 ± 107.58a | 0.001 | 2,253.29 ± 66.46b | 2,497.07 ± 60.18a | 2,143.53 ± 68.16b | < 0.001 |
| Magnesium (mg) | 285.88 ± 9.60b | 347.19 ± 5.36a | 338.09 ± 11.43a | < 0.001 | 254.97 ± 6.13b | 287.69 ± 7.83a | 244.38 ± 7.11b | < 0.001 |
| Iron (mg) | 8.05 ± 0.47b | 9.98 ± 0.23a | 9.45 ± 0.41ab | 0.004 | 7.04 ± 0.25b | 8.21 ± 0.32a | 6.91 ± 0.26b | 0.003 |
| Zinc (mg) | 9.32 ± 0.39b | 10.94 ± 0.21a | 10.70 ± 0.38a | 0.007 | 7.87 ± 0.20ab | 8.46 ± 0.21a | 7.54 ± 0.23b | 0.006 |
| Vitamin A (μg RAE) | 282.86 ± 22.19b | 352.78 ± 12.30a | 375.35 ± 34.58a | 0.029 | 300.60 ± 15.54 | 350.78 ± 15.68 | 301.33 ± 22.52 | 0.088 |
| Thiamin (mg) | 0.97 ± 0.05 | 1.09 ± 0.02 | 1.07 ± 0.05 | 0.133 | 0.81 ± 0.02b | 0.90 ± 0.02a | 0.81 ± 0.03ab | 0.034 |
| Folate (μg DFE) | 312.20 ± 12.37b | 362.69 ± 6.76a | 354.91 ± 13.73a | 0.012 | 275.85 ± 7.62b | 314.28 ± 8.40a | 255.19 ± 8.37b | < 0.001 |
| Vitamin C (mg) | 62.18 ± 7.13 | 61.33 ± 2.38 | 59.22 ± 4.29 | 0.847 | 56.41 ± 3.66 | 65.56 ± 3.75 | 56.54 ± 4.05 | 0.146 |
| Vitamin B2 (mg) | 1.25 ± 0.06 | 1.39 ± 0.03 | 1.41 ± 0.06 | 0.131 | 1.03 ± 0.03b | 1.16 ± 0.04a | 1.02 ± 0.04b | 0.005 |
| Carbohydrates (%)1) | 64.96 ± 0.88 | 65.87 ± 0.45 | 65.07 ± 0.72 | 0.459 | 69.25 ± 0.57 | 69.63 ± 0.45 | 68.63 ± 0.66 | 0.403 |
| Protein (%)1) | 13.56 ± 0.27 | 14.36 ± 0.15 | 14.14 ± 0.25 | 0.059 | 13.51 ± 0.20 | 13.93 ± 0.19 | 13.48 ± 0.25 | 0.217 |
| Fat (%)1) | 16.21 ± 0.56ab | 16.47 ± 0.27b | 17.79 ± 0.49a | 0.020 | 16.41 ± 0.42 | 15.99 ± 0.33 | 17.28 ± 0.55 | 0.117 |
Mean ± SE.
Statistical analysis: Values were obtained using a general linear model for continuous variables in complex sample survey data analysis (P < 0.05).
1)Carbohydrate (%), protein (%), and fat (%) indicate the percentage contribution of each macronutrient to total daily energy intake, adjusted for total energy intake.
a,bValues are significantly different according to the Bonferroni post hoc test (P < 0.05).
Table 4.Risk of energy intake below the EER and nutrient intake below the EAR by household type and gender
| Variables | Men (n = 1,118) | Women (n = 1,294) | ||||
|---|---|---|---|---|---|---|
| Couple-only (n = 737) | One-person (n = 170) | With-children (n = 211) | Couple-only (n = 535) | One-person (n = 468) | With-children (n = 291) | |
| Energy (kcal)1) | 1.000 (Ref.) | 1.241 (0.820–1.878) | 1.022 (0.701–1.490) | 1.000 (Ref.) | 1.036 (0.742–1.446) | 1.448 (1.004–2.089)* |
| Protein (g) | 1.000 (Ref.) | 1.303 (0.748–2.271) | 0.785 (0.446–1.382) | 1.000 (Ref.) | 1.210 (0.802–1.827) | 1.371 (0.798–2.355) |
| Carbohydrate (g) | - | - | - | 1.000 (Ref.) | 0.957 (0.216–4.234) | 0.377 (0.064–2.201) |
| Calcium (mg) | 1.000 (Ref.) | 1.043 (0.633–1.717) | 0.728 (0.487–1.089) | 1.000 (Ref.) | 1.214 (0.770–1.912) | 1.102 (0.643–1.888) |
| Magnesium (mg) | 1.000 (Ref.) | 1.529 (0.935–2.503) | 1.218 (0.743–1.998) | 1.000 (Ref.) | 1.346 (0.916–1.980) | 2.090 (1.330–3.286)* |
| Iron (mg) | 1.000 (Ref.) | 1.731 (1.083–2.766)* | 1.009 (0.633–1.609) | 1.000 (Ref.) | 1.286 (0.869–1.902) | 1.692 (1.137–2.519)* |
| Zinc (mg) | 1.000 (Ref.) | 2.460 (1.394–4.343)* | 0.813 (0.498–1.325) | 1.000 (Ref.) | 1.475 (0.971–2.239) | 1.902 (1.129–3.204)* |
| Vitamin A (μg RAE) | 1.000 (Ref.) | 1.315 (0.778–2.221) | 0.835 (0.499–1.397) | 1.000 (Ref.) | 0.871 (0.604–1.255) | 1.124 (0.707–1.787) |
| Thiamin (mg) | 1.000 (Ref.) | 1.438 (0.879–2.352) | 1.478 (0.916–2.384) | 1.000 (Ref.) | 1.244 (0.879–1.760) | 1.466 (0.895–2.402) |
| Folate (μg DFE) | 1.000 (Ref.) | 1.170 (0.783–1.751) | 1.070 (0.680–1.682) | 1.000 (Ref.) | 1.625 (1.118–2.363)* | 2.282 (1.470–3.541)* |
| Vitamin C (mg) | 1.000 (Ref.) | 1.135 (0.717–1.799) | 1.276 (0.808–2.015) | 1.000 (Ref.) | 1.039 (0.731–1.476) | 1.158 (0.759–1.769) |
| Vitamin B2 (mg) | 1.000 (Ref.) | 1.311 (0.825–2.084) | 1.047 (0.691–1.588) | 1.000 (Ref.) | 0.962 (0.699–1.324) | 1.396 (0.909–2.144) |
Odds ratios (95% confidence intervals).
Statistical analysis: Values were obtained using logistic regression analysis in complex sample survey data analysis.
Energy intake was adjusted for age, residential area, education level, household income level, economic activity status, self-rated health status, and survey year. Other nutrients were adjusted for age, residential area, education level, household income, economic activity status, self-rated health, total energy intake, and survey year.
Logistic regression could not be performed for carbohydrate intake in men due to a highly skewed response distribution.
EER, estimated energy requirement; EAR, estimated average requirement.
*P < 0.05.
1)Energy intake was assessed based on the EER, as the 2020 Dietary Reference Intakes for Koreans (KDRIs) do not define an EAR for energy.
Table 5.Differences in KHEI scores by household type and gender
| Variable | Men (n = 1,118) | P-value | Women (n = 1,294) | P-value | ||||
|---|---|---|---|---|---|---|---|---|
| One-person (n = 170) | Couple-only (n = 737) | With-children (n = 211) | One-person (n = 468) | Couple-only (n = 535) | With-children (n = 291) | |||
| Total KHEI score (0–100) | 60.79 ± 1.02b | 67.20 ± 0.62a | 65.61 ± 0.96a | < 0.001 | 67.14 ± 0.99a | 68.95 ± 0.87a | 65.59 ± 1.22ab | 0.004 |
| Adequacy | ||||||||
| Breakfast (0–10) | 9.04 ± 0.21b | 9.70 ± 0.07a | 9.46 ± 0.16ab | 0.007 | 9.03 ± 0.23b | 9.40 ± 0.18a | 8.79 ± 0.25b | 0.019 |
| Mixed grains (0–5) | 1.58 ± 0.21b | 2.66 ± 0.11a | 2.30 ± 0.19a | < 0.001 | 2.37 ± 0.16 | 2.29 ± 0.15 | 2.06 ± 0.18 | 0.260 |
| Total fruits (0–5) | 1.84 ± 0.19b | 2.52 ± 0.11a | 2.49 ± 0.19a | 0.015 | 3.29 ± 0.18 | 3.40 ± 0.14 | 3.01 ± 0.19 | 0.163 |
| Fresh fruits (0–5) | 1.91 ± 0.21b | 2.67 ± 0.12a | 2.67 ± 0.21a | 0.011 | 3.32 ± 0.19 | 3.43 ± 0.15 | 3.04 ± 0.20 | 0.192 |
| Total vegetables (0–5) | 3.53 ± 0.13 | 3.90 ± 0.07 | 3.87 ± 0.12 | 0.052 | 3.73 ± 0.10b | 3.96 ± 0.10a | 3.72 ± 0.11ab | 0.046 |
| Vegetables, excluding kimchi and pickles (0–5) | 2.78 ± 0.16b | 3.41 ± 0.09a | 3.22 ± 0.13a | 0.002 | 3.78 ± 0.12 | 4.00 ± 0.11 | 3.77 ± 0.11 | 0.127 |
| Meat, fish, eggs, and beans (0–10) | 6.41 ± 0.33b | 7.43 ± 0.17a | 6.84 ± 0.26ab | 0.003 | 7.33 ± 0.25 | 7.63 ± 0.19 | 7.02 ± 0.27 | 0.063 |
| Milk and milk products (0–10) | 2.42 ± 0.41 | 2.90 ± 0.24 | 2.67 ± 0.32 | 0.457 | 4.02 ± 0.36 | 3.91 ± 0.34 | 3.45 ± 0.40 | 0.321 |
| Moderation | ||||||||
| Saturated fatty acid (0–10) | 8.36 ± 0.29 | 8.82 ± 0.17 | 8.64 ± 0.22 | 0.286 | 7.87 ± 0.26b | 8.51 ± 0.20a | 7.83 ± 0.30b | 0.007 |
| Sodium (0–10) | 6.81 ± 0.29 | 6.65 ± 0.16 | 6.60 ± 0.26 | 0.844 | 8.24 ± 0.18a | 7.89 ± 0.19a | 8.43 ± 0.18ab | 0.026 |
| Total sugar (0–10) | 7.33 ± 0.33 | 6.92 ± 0.19 | 7.17 ± 0.28 | 0.449 | 5.66 ± 0.32 | 5.76 ± 0.30 | 5.74 ± 0.33 | 0.946 |
| Energy balance | ||||||||
| Carbohydrate (0–5) | 2.44 ± 0.19 | 2.61 ± 0.13 | 2.82 ± 0.18 | 0.243 | 2.22 ± 0.16 | 2.23 ± 0.14 | 2.35 ± 0.17 | 0.722 |
| Fat (0–5) | 3.38 ± 0.17 | 3.44 ± 0.12 | 3.69 ± 0.17 | 0.241 | 3.13 ± 0.16 | 3.15 ± 0.14 | 2.98 ± 0.17 | 0.565 |
| Total energy (0–5) | 2.97 ± 0.22b | 3.56 ± 0.12a | 3.19 ± 0.17ab | 0.013 | 3.16 ± 0.17 | 3.38 ± 0.15 | 3.41 ± 0.21 | 0.411 |
Mean ± SE.
Statistical analysis: Values were obtained using the general linear model for continuous variables in complex sample survey data analysis (P < 0.05).
All variables were adjusted for age, residential area, education level, household income, economic activity status, self-rated health, and survey year.
KHEI, Korean Healthy Eating Index.
a,bValues are significantly different according to the Bonferroni post hoc test (P < 0.05).
- 1. Korean Statistical Information Service. Proportion of elderly population (by si/do/si/gun/gu) [Internet]. Statistics Korea; 2024 [cited 2025 Dec 04]. Available from: https://kosis.kr/statHtml/statHtml.do?orgId=101&tblId=DT_1YL20631&conn_path=I2
- 2. Harper S. Economic and social implications of aging societies. Science 2014; 346(6209): 587-591. ArticlePubMed
- 3. Casimir GJ, Tobi H. Defining and using the concept of household: a systematic review. Int J Consum Stud 2011; 35: 498-506. Article
- 4. Korean Statistical Information Service. Proportion of elderly living alone households (by si/do/si/gun/gu) [Internet]. Statistics Korea; 2025 [cited 2025 Aug 30]. Available from: https://kosis.kr/statHtml/statHtml.do?orgId=101&tblId=DT_1YL12701&conn_path=I2
- 5. Her W, Oh YS. Classification of lonely lives in old age and exploration of factors leading to lonely lives. Health Soc Welf Rev 2024; 44(3): 111-136. Article
- 6. Steptoe A, Fong HL, Lassale C. Social isolation, loneliness and low dietary micronutrient intake amongst older people in England. Age Ageing 2024; 53(10): afae223.ArticlePubMedPMC
- 7. Choi HS. A study on the senior quality of life factors. J Korea Acad Ind Coop Soc 2019; 20(12): 314-321. Article
- 8. Oh JH, Jung BM. Comparison analysis of dietary behavior and nutrient intakes of the elderly according to their family status: the Korea National Health and Nutrition Examination Survey 2013-2016. Korean J Community Nutr 2019; 24(4): 309-320. ArticleLink
- 9. Choi YR, Park HR, Song KH, Lee Y, Lim YS. Disparities in dietary quantity and quality between the two different types of Korean family of older adults living with spouses and living alone: using data from the 6th Korea National Health and Nutrition Examination Survey. Nutr Res Pract 2020; 14(3): 242-251. Article
- 10. Liu C, Yi F, Xu Z, Tian X. Do living arrangements matter?—Evidence from eating behaviors of the elderly in rural China. J Econ Ageing 2021; 19: 100307.Article
- 11. Jang W, Kim M, Kim Y. Association between living alone with frailty among elderly Korean men. J Nutr Health 2025; 58(1): 77-86. ArticleLink
- 12. Shin SK, Kim HJ, Choi BY, Lee SS. A comparison of food frequency for the elderly regarding different family types - based on Community Health Survey for 2008 -. Korean J Nutr 2012; 45(3): 264-273. Article
- 13. Choi SB, Kwak JH, Chung HK, Kang HJ, Paik JK. Comparison of nutrient intake and metabolic syndrome between single person households and non-single person households in elderly subjects - from the Sixth Korea National Health and Nutrition Examination Survey (KNHANES, 2013~2015) -. Korean J Food Nutr 2020; 33(3): 322-330. Article
- 14. Youn KJ, Park HA, Cho YG. Familial types and dietary quality in Korean elderly. Korean J Health Promot 2022; 22(2): 93-102. Article
- 15. Yoon Y, Lee Y, Song K, Lee Y. Evaluation of diet quality determined by dietary patterns of elderly Koreans living alone: data retrieved from the 2016-2018 Korea National Health and Nutrition Examination Survey. J Korean Diet Assoc 2021; 27(3): 133-148. Article
- 16. Tani Y, Kondo N, Takagi D, Saito M, Hikichi H, Ojima T, et al. Combined effects of eating alone and living alone on unhealthy dietary behaviors, obesity and underweight in older Japanese adults: results of the JAGES. Appetite 2015; 95: 1-8. ArticlePubMed
- 17. Tsubota-Utsugi M, Kikuya M, Satoh M, Inoue R, Hosaka M, Metoki H, et al. Living situations associated with poor dietary intake among healthy Japanese elderly: the Ohasama study. J Nutr Health Aging 2015; 19(4): 375-382. ArticlePubMedPMCPDF
- 18. Sung M, Lee J, Choi Y, Chi S. Co-residence of older single mothers and ever-single daughters: borderline between overdependence and mutual dependence. J Families Better Life 2017; 35(3): 81-98. Article
- 19. Lee HJ. A study on the gender inequality of elderly women's household and caregiving labor. PNU J Women's Stud 2015; 25(3): 141-177. Article
- 20. Choi MS, Kim SH. Life history on care of multiple family members by elderly woman in her 70s. J Soc Sci 2024; 35(3): 83-112. Article
- 21. Baek KH, Song DY, Jang SJ. Unjust inter-generational re-distribution of care responsibility in the context of double care. J Korean Women's Stud 2018; 34(2): 33-70. Article
- 22. Phulkerd S, Gray RS, Chamratrithirong A. The influence of co-residential and non-co-residential living arrangements on sufficient fruit and vegetable consumption in the aging population in Thailand. BMC Geriatr 2020; 20(1): 476.ArticlePubMedPMCPDF
- 23. Choi MK, Kang MH, Kim MH. Diet and health status of elderly women according to the family type. Korean J Community Nutr 2016; 21(3): 256-264. ArticleLink
- 24. Yun S, Park S, Yook SM, Kim K, Shim JE, Hwang JY, et al. Development of the Korean Healthy Eating Index for adults, based on the Korea National Health and Nutrition Examination Survey. Nutr Res Pract 2022; 16(2): 233-247. ArticlePubMedLink
- 25. The Korean Society for the Study of Obesity. Clinical practice guidelines for obesity 2022, 8th ed. summary [Internet]. The Korean Society for the Study of Obesity; 2022 [cited 2025 Aug 25]. Available from: https://general.kosso.or.kr/html/?pmode=BBBS0001300003&page=1&smode=view&seq=1383&searchValue=&searchTitle=strTitle
- 26. Hong SH, Kim JM. Relationship between eating behavior and healthy eating competency of single-person and multi-person households by age group. Korean J Community Nutr 2021; 26(5): 337-349. ArticleLink
- 27. Kang NY, Jung BM. Analysis of the difference in nutrients intake, dietary behaviors and food intake frequency of single- and non single-person households: the Korea National Health and Nutrition Examination Survey (KNHANES), 2014-2016. Korean J Community Nutr 2019; 24(1): 1-17. ArticleLink
- 28. Lim HS, Lee MN. Comparison of health status and nutrient intake by household type in the elderly population. J Bone Metab 2019; 26(1): 25-30. ArticlePubMedPMCLink
- 29. Lee H, Kim SJ, Kang M. Comparative study on eating habits and health of single-person and multi-person households. PLoS One 2025; 20(7): e0327763. ArticlePubMedPMC
- 30. Lee MS, Lee SY. Analysis of awareness, knowledge, and behavior about food hygiene•safety among the elderly. Korean J Community Nutr 2021; 26(3): 200-210. ArticleLink
- 31. Tani Y, Fujiwara T, Anzai T, Kondo K. Cooking skills, living alone, and mortality: JAGES cohort study. Int J Behav Nutr Phys Act 2023; 20(1): 131.ArticlePubMedPMCPDF
- 32. Choi MK, Park ES, Kim MH. Home meal replacement use and eating habits of adults in one-person households. Korean J Community Nutr 2019; 24(6): 476-484. ArticleLink
- 33. Hu Y, Xiao J, Li X. The impact of living arrangements on dietary patterns among older adults: the mediating effects of loneliness and anxiety. Front Public Health 2025; 13: 1519564.ArticlePubMedPMC
- 34. Kim N, Kim GU, Kim H. Comparative study of dietary patterns by living arrangements: the Korea National Health and Nutrition Examination Survey (KNHANES) 2013-2015. Int J Environ Res Public Health 2020; 17(7): 2371.ArticlePubMedPMC
- 35. Kucukerdonmez O, Navruz Varli S, Koksal E. Comparison of nutritional status in the elderly according to living situations. J Nutr Health Aging 2017; 21(1): 25-30. ArticlePubMedPMCPDF
- 36. Lee YJ, Kwon MK, Baek HJ, Lee SS. Comparative analysis of food intake according to the family type of elderly women in Seoul area. J Nutr Health 2015; 48(3): 277-288. Article
- 37. Lee SJ. A study on the dietary intake and quality of life (EQ-5D) of elderly single-person and multi-person households. J Korean Soc Food Cult 2025; 40(2): 104-112. Article
REFERENCES
Figure & Data
REFERENCES
Citations
Citations to this article as recorded by 
 Cite
Cite- Figure
-
- We recommend
- Related articles
-
- Changing patterns and related factors of kimchi consumption among Korean adults: a nationwide cross-sectional analysis of the Korea National Health and Nutrition Examination Survey, 2010–2024
- Differences in lunch nutrient intake and nutritional adequacy among Korean older adults by meal site: a cross-sectional analysis of the 2018–2021 Korea National Health and Nutrition Examination Survey data
- Association between nutrient intake and frailty status in Korean older adults: a cross-sectional study using the 9th (2022–2023) Korea National Health and Nutrition Examination Survey
- Prevalence of coronary artery disease according to lifestyle characteristics, nutrient intake level, and comorbidities among Koreans aged 40 years and older: a cross-sectional study using data from the 7th (2016–2018) Korea National Health and Nutrition Examination Survey
- Ultra-processed food intake and dietary behaviors in Korean adolescents: a cross-sectional study based on the 2019–2023 Korea National Health and Nutrition Examination Survey
Comparison of dietary behaviors and nutrient intake by gender and household type among older Koreans: a cross-sectional study using data from the 8th Korea National Health and Nutrition Examination Survey

Fig. 1. Flowchart of inclusion and exclusion of study participants. KNHANES, Korea National Health and Nutrition Examination Survey; FPG, fasting plasma glucose; HbA1c, glycated hemoglobin.
Fig. 1.
Comparison of dietary behaviors and nutrient intake by gender and household type among older Koreans: a cross-sectional study using data from the 8th Korea National Health and Nutrition Examination Survey
| Variables | Men (n = 1,118) | P-value | Women (n = 1,294) | P-value | ||||
|---|---|---|---|---|---|---|---|---|
| One-person (n = 170) | Couple-only (n = 737) | With-children (n = 211) | One-person (n = 468) | Couple-only (n = 535) | With-children (n = 291) | |||
| Age (year) | ||||||||
| 65–74 | 104 (62.0) | 441 (61.4) | 138 (63.3) | 0.896 | 200 (46.0) | 392 (73.8) | 199 (70.2) | < 0.001 |
| ≥ 75 | 66 (38.0) | 296 (38.6) | 73 (36.7) | 268 (54.0) | 143 (26.2) | 92 (29.8) | ||
| Mean age (year) | 72.69 ± 0.42 | 72.89 ± 0.20 | 72.09 ± 0.44 | 0.175 | 74.45 ± 0.27 |
71.27 ± 0.22 |
71.92 ± 0.33 |
< 0.001 |
| Residential area | 0.002 | < 0.001 | ||||||
| Urban | 121 (75.0) | 478 (68.8) | 172 (82.3) | 307 (70.3) | 355 (68.9) | 237 (86.8) | ||
| Rural | 49 (25.0) | 259 (31.2) | 39 (17.7) | 161 (29.7) | 180 (31.1) | 54 (13.2) | ||
| Education level | 0.731 | 0.002 | ||||||
| ≤ Elementary school | 62 (33.2) | 304 (39.9) | 80 (39.4) | 357 (74.2) | 335 (59.4) | 184 (59.5) | ||
| Middle school | 41 (23.5) | 143 (19.6) | 34 (17.8) | 49 (11.1) | 99 (19.9) | 52 (17.7) | ||
| High school | 40 (27.0) | 178 (24.6) | 63 (28.6) | 42 (10.2) | 77 (16.0) | 40 (17.4) | ||
| ≥ College | 27 (16.2) | 112 (16.0) | 34 (14.3) | 20 (4.5) | 24 (4.7) | 15 (5.5) | ||
| Household income level | < 0.001 | < 0.001 | ||||||
| Lowest quartile | 111 (64.8) | 287 (38.0) | 34 (18.8) | 354 (72.9) | 250 (45.0) | 77 (32.2) | ||
| Lower-middle quartile | 31 (18.3) | 266 (35.4) | 62 (32.6) | 89 (21.2) | 184 (35.0) | 80 (27.5) | ||
| Upper-middle quartile | 22 (13.6) | 126 (18.3) | 60 (24.3) | 17 (4.1) | 79 (15.8) | 79 (22.2) | ||
| Highest quartile | 6 (3.3) | 58 (8.3) | 55 (24.3) | 8 (1.8) | 22 (4.1) | 55 (18.1) | ||
| Currently working |
0.153 | 0.291 | ||||||
| Yes | 66 (38.5) | 351 (48.0) | 97 (43.6) | 171 (35.9) | 185 (33.3) | 89 (29.5) | ||
| No | 104 (61.5) | 386 (52.0) | 114 (56.4) | 297 (64.1) | 350 (66.7) | 202 (70.5) | ||
| Smoking status |
0.158 | 0.297 | ||||||
| Yes | 45 (27.4) | 132 (19.0) | 48 (20.9) | 20 (4.8) | 10 (2.5) | 12 (5.1) | ||
| No | 125 (72.6) | 605 (81.0) | 163 (79.1) | 448 (95.2) | 525 (97.5) | 279 (94.9) | ||
| Drinking status |
0.922 | 0.883 | ||||||
| Yes | 99 (59.6) | 443 (59.9) | 127 (58.4) | 78 (17.7) | 94 (17.5) | 52 (18.8) | ||
| No | 71 (40.4) | 294 (40.1) | 84 (41.6) | 390 (82.3) | 441 (82.5) | 239 (81.2) | ||
| Self-rated health status |
0.018 | 0.542 | ||||||
| Good | 37 (23.4) | 248 (33.6) | 69 (32.5) | 90 (20.3) | 111 (21.0) | 77 (25.6) | ||
| Fair | 86 (48.1) | 369 (50.9) | 104 (51.5) | 220 (47.1) | 252 (46.2) | 126 (44.4) | ||
| Poor | 47 (28.5) | 120 (15.5) | 38 (16.0) | 158 (32.6) | 172 (32.8) | 88 (29.9) | ||
| BMI (kg/m2) | 23.47 ± 0.23 | 23.85 ± 0.15 | 23.60 ± 0.24 | 0.329 | 24.19 ± 0.18 | 24.44 ± 0.17 | 24.32 ± 0.30 | 0.657 |
| Obesity |
52 (28.0) | 233 (31.8) | 65 (32.0) | 0.700 | 175 (37.2) | 201 (38.6) | 118 (39.2) | 0.878 |
| Abdominal obesity |
71 (43.3) | 325 (44.4) | 90 (43.8) | 0.970 | 251 (53.3) | 273 (52.4) | 170 (54.8) | 0.821 |
| Diabetes |
42 (24.3) | 189 (25.0) | 58 (30.0) | 0.345 | 123 (26.6) | 134 (24.7) | 75 (24.2) | 0.777 |
| Hypertension |
98 (60.1) | 424 (57.5) | 116 (56.0) | 0.785 | 315 (65.6) | 348 (65.0) | 182 (60.5) | 0.332 |
| Variables | Men (n = 1,118) | P-value | Women (n = 1,294) | P-value | ||||
|---|---|---|---|---|---|---|---|---|
| One-person (n = 170) | Couple-only (n = 737) | With-children (n = 211) | One-person (n = 468) | Couple-only (n = 535) | With-children (n = 291) | |||
| Breakfast skipping status | < 0.001 | < 0.001 | ||||||
| Yes | 17 (10.2) | 22 (2.8) | 11 (3.5) | 26 (5.7) | 19 (3.6) | 32 (11.8) | ||
| No | 153 (89.8) | 715 (97.2) | 200 (96.5) | 442 (94.3) | 516 (96.4) | 259 (88.2) | ||
| Lunch skipping status | 0.008 | 0.062 | ||||||
| Yes | 22 (12.0) | 27 (4.5) | 16 (9.4) | 59 (12.9) | 34 (7.6) | 23 (8.4) | ||
| No | 148 (88.0) | 710 (95.5) | 195 (90.6) | 409 (87.1) | 501 (92.4) | 268 (91.6) | ||
| Dinner skipping status | 0.399 | 0.253 | ||||||
| Yes | 5 (3.5) | 15 (1.8) | 3 (1.3) | 32 (7.0) | 24 (4.6) | 10 (4.0) | ||
| No | 165 (96.5) | 722 (98.2) | 208 (98.7) | 436 (93.0) | 511 (95.4) | 281 (96.0) | ||
| Breakfast companionship status |
< 0.001 | < 0.001 | ||||||
| Yes | 17 (9.4) | 600 (81.0) | 140 (66.3) | 26 (4.8) | 434 (78.5) | 160 (53.8) | ||
| No | 138 (81.4) | 118 (16.4) | 56 (27.6) | 412 (88.3) | 77 (16.6) | 101 (34.5) | ||
| Not applicable | 15 (9.2) | 19 (2.6) | 15 (6.1) | 30 (6.9) | 24 (4.9) | 30 (11.7) | ||
| Lunch companionship status |
< 0.001 | < 0.001 | ||||||
| Yes | 40 (22.3) | 541 (71.0) | 122 (56.2) | 85 (18.0) | 399 (72.2) | 153 (47.7) | ||
| No | 114 (69.1) | 177 (25.4) | 80 (38.2) | 346 (74.2) | 108 (21.5) | 125 (47.6) | ||
| Not applicable | 16 (8.6) | 19 (3.6) | 9 (5.6) | 37 (7.8) | 28 (6.3) | 13 (4.7) | ||
| Dinner companionship status |
< 0.001 | < 0.001 | ||||||
| Yes | 22 (11.5) | 663 (90.2) | 165 (78.5) | 37 (7.5) | 477 (87.3) | 197 (65.0) | ||
| No | 146 (86.5) | 67 (8.9) | 46 (21.5) | 418 (90.0) | 51 (11.3) | 92 (33.4) | ||
| Not applicable | 2 (2.0) | 7 (0.9) | 0 (0.0) | 13 (2.6) | 7 (1.4) | 2 (1.6) | ||
| Frequency of eating out | 0.098 | 0.003 | ||||||
| ≥ Once/day | 14 (8.9) | 25 (4.2) | 19 (8.9) | 7 (1.1) | 7 (0.9) | 6 (2.1) | ||
| 5–6 times/week | 14 (8.4) | 71 (10.0) | 23 (8.9) | 23 (5.4) | 15 (2.3) | 14 (4.6) | ||
| 3–4 times/week | 18 (10.3) | 61 (8.0) | 27 (11.9) | 24 (5.2) | 16 (3.1) | 22 (6.9) | ||
| 1–2 times/week | 40 (23.2) | 163 (22.3) | 55 (26.0) | 101 (22.4) | 111 (22.4) | 57 (19.7) | ||
| 1–3 times/month | 48 (28.0) | 282 (37.2) | 54 (28.3) | 133 (28.1) | 217 (40.1) | 119 (40.5) | ||
| < Once/month | 36 (21.2) | 135 (18.2) | 33 (16.1) | 180 (37.7) | 169 (31.3) | 73 (26.2) | ||
| Experience of nutrition education or counseling | 0.671 | 0.159 | ||||||
| Yes | 6 (3.9) | 22 (2.7) | 3 (2.1) | 37 (7.3) | 27 (4.5) | 14 (4.3) | ||
| No | 164 (96.1) | 715 (97.3) | 208 (97.9) | 431 (92.7) | 508 (95.5) | 277 (95.7) | ||
| Dietary supplement use |
0.111 | 0.195 | ||||||
| Yes | 90 (51.2) | 425 (59.3) | 117 (52.3) | 297 (65.5) | 361 (70.3) | 183 (64.1) | ||
| No | 80 (48.8) | 312 (40.7) | 94 (47.7) | 171 (34.5) | 174 (29.7) | 108 (35.9) | ||
| Awareness of nutrition labeling | 0.688 | 0.001 | ||||||
| Yes | 74 (45.4) | 318 (44.7) | 88 (41.4) | 154 (37.0) | 251 (49.9) | 139 (50.9) | ||
| No | 96 (54.6) | 419 (55.3) | 123 (58.6) | 314 (63.0) | 284 (50.1) | 152 (49.1) | ||
| Variables | Men (n = 1,118) | P-value | Women (n = 1,294) | P-value | ||||
|---|---|---|---|---|---|---|---|---|
| One-person (n = 170) | Couple-only (n = 737) | With-children (n = 211) | One-person (n = 468) | Couple-only (n = 535) | With-children (n = 291) | |||
| Energy (kcal) | 1,681.98 ± 52.65 |
1,848.92 ± 23.50 |
1,836.76 ± 49.93 |
0.033 | 1,373.38 ± 27.84 |
1,439.42 ± 27.13 |
1,346.75 ± 28.66 |
0.035 |
| Protein (g) | 57.37 ± 2.22 |
66.76 ± 1.15 |
65.43 ± 2.20 |
0.004 | 46.68 ± 1.22 |
51.37 ± 1.93 |
45.91 ± 1.34 |
0.033 |
| Carbohydrate (g) | 268.36 ± 6.88 |
298.00 ± 3.63 |
292.06 ± 7.28 |
0.003 | 234.59 ± 4.75 |
246.69 ± 4.22 |
228.66 ± 4.91 |
0.009 |
| Calcium (mg) | 461.38 ± 22.44 | 527.74 ± 12.69 | 534.23 ± 24.61 | 0.051 | 399.12 ± 13.41 |
465.04 ± 13.61 |
403.00 ± 18.00 |
0.002 |
| Sodium (mg) | 3,309.06 ± 176.23 | 3,400.07 ± 71.02 | 3,431.21 ± 133.89 | 0.864 | 2,333.42 ± 71.19 |
2,690.67 ± 88.69 |
2,315.41 ± 97.34 |
0.003 |
| Potassium (mg) | 2,464.25 ± 98.39 |
2,945.25 ± 51.24 |
2,859.41 ± 107.58 |
0.001 | 2,253.29 ± 66.46 |
2,497.07 ± 60.18 |
2,143.53 ± 68.16 |
< 0.001 |
| Magnesium (mg) | 285.88 ± 9.60 |
347.19 ± 5.36 |
338.09 ± 11.43 |
< 0.001 | 254.97 ± 6.13 |
287.69 ± 7.83 |
244.38 ± 7.11 |
< 0.001 |
| Iron (mg) | 8.05 ± 0.47 |
9.98 ± 0.23 |
9.45 ± 0.41 |
0.004 | 7.04 ± 0.25 |
8.21 ± 0.32 |
6.91 ± 0.26 |
0.003 |
| Zinc (mg) | 9.32 ± 0.39 |
10.94 ± 0.21 |
10.70 ± 0.38 |
0.007 | 7.87 ± 0.20 |
8.46 ± 0.21 |
7.54 ± 0.23 |
0.006 |
| Vitamin A (μg RAE) | 282.86 ± 22.19 |
352.78 ± 12.30 |
375.35 ± 34.58 |
0.029 | 300.60 ± 15.54 | 350.78 ± 15.68 | 301.33 ± 22.52 | 0.088 |
| Thiamin (mg) | 0.97 ± 0.05 | 1.09 ± 0.02 | 1.07 ± 0.05 | 0.133 | 0.81 ± 0.02 |
0.90 ± 0.02 |
0.81 ± 0.03 |
0.034 |
| Folate (μg DFE) | 312.20 ± 12.37 |
362.69 ± 6.76 |
354.91 ± 13.73 |
0.012 | 275.85 ± 7.62 |
314.28 ± 8.40 |
255.19 ± 8.37 |
< 0.001 |
| Vitamin C (mg) | 62.18 ± 7.13 | 61.33 ± 2.38 | 59.22 ± 4.29 | 0.847 | 56.41 ± 3.66 | 65.56 ± 3.75 | 56.54 ± 4.05 | 0.146 |
| Vitamin B2 (mg) | 1.25 ± 0.06 | 1.39 ± 0.03 | 1.41 ± 0.06 | 0.131 | 1.03 ± 0.03 |
1.16 ± 0.04 |
1.02 ± 0.04 |
0.005 |
| Carbohydrates (%) |
64.96 ± 0.88 | 65.87 ± 0.45 | 65.07 ± 0.72 | 0.459 | 69.25 ± 0.57 | 69.63 ± 0.45 | 68.63 ± 0.66 | 0.403 |
| Protein (%) |
13.56 ± 0.27 | 14.36 ± 0.15 | 14.14 ± 0.25 | 0.059 | 13.51 ± 0.20 | 13.93 ± 0.19 | 13.48 ± 0.25 | 0.217 |
| Fat (%) |
16.21 ± 0.56 |
16.47 ± 0.27 |
17.79 ± 0.49 |
0.020 | 16.41 ± 0.42 | 15.99 ± 0.33 | 17.28 ± 0.55 | 0.117 |
| Variables | Men (n = 1,118) | Women (n = 1,294) | ||||
|---|---|---|---|---|---|---|
| Couple-only (n = 737) | One-person (n = 170) | With-children (n = 211) | Couple-only (n = 535) | One-person (n = 468) | With-children (n = 291) | |
| Energy (kcal) |
1.000 (Ref.) | 1.241 (0.820–1.878) | 1.022 (0.701–1.490) | 1.000 (Ref.) | 1.036 (0.742–1.446) | 1.448 (1.004–2.089) |
| Protein (g) | 1.000 (Ref.) | 1.303 (0.748–2.271) | 0.785 (0.446–1.382) | 1.000 (Ref.) | 1.210 (0.802–1.827) | 1.371 (0.798–2.355) |
| Carbohydrate (g) | - | - | - | 1.000 (Ref.) | 0.957 (0.216–4.234) | 0.377 (0.064–2.201) |
| Calcium (mg) | 1.000 (Ref.) | 1.043 (0.633–1.717) | 0.728 (0.487–1.089) | 1.000 (Ref.) | 1.214 (0.770–1.912) | 1.102 (0.643–1.888) |
| Magnesium (mg) | 1.000 (Ref.) | 1.529 (0.935–2.503) | 1.218 (0.743–1.998) | 1.000 (Ref.) | 1.346 (0.916–1.980) | 2.090 (1.330–3.286) |
| Iron (mg) | 1.000 (Ref.) | 1.731 (1.083–2.766) |
1.009 (0.633–1.609) | 1.000 (Ref.) | 1.286 (0.869–1.902) | 1.692 (1.137–2.519) |
| Zinc (mg) | 1.000 (Ref.) | 2.460 (1.394–4.343) |
0.813 (0.498–1.325) | 1.000 (Ref.) | 1.475 (0.971–2.239) | 1.902 (1.129–3.204) |
| Vitamin A (μg RAE) | 1.000 (Ref.) | 1.315 (0.778–2.221) | 0.835 (0.499–1.397) | 1.000 (Ref.) | 0.871 (0.604–1.255) | 1.124 (0.707–1.787) |
| Thiamin (mg) | 1.000 (Ref.) | 1.438 (0.879–2.352) | 1.478 (0.916–2.384) | 1.000 (Ref.) | 1.244 (0.879–1.760) | 1.466 (0.895–2.402) |
| Folate (μg DFE) | 1.000 (Ref.) | 1.170 (0.783–1.751) | 1.070 (0.680–1.682) | 1.000 (Ref.) | 1.625 (1.118–2.363) |
2.282 (1.470–3.541) |
| Vitamin C (mg) | 1.000 (Ref.) | 1.135 (0.717–1.799) | 1.276 (0.808–2.015) | 1.000 (Ref.) | 1.039 (0.731–1.476) | 1.158 (0.759–1.769) |
| Vitamin B2 (mg) | 1.000 (Ref.) | 1.311 (0.825–2.084) | 1.047 (0.691–1.588) | 1.000 (Ref.) | 0.962 (0.699–1.324) | 1.396 (0.909–2.144) |
| Variable | Men (n = 1,118) | P-value | Women (n = 1,294) | P-value | ||||
|---|---|---|---|---|---|---|---|---|
| One-person (n = 170) | Couple-only (n = 737) | With-children (n = 211) | One-person (n = 468) | Couple-only (n = 535) | With-children (n = 291) | |||
| Total KHEI score (0–100) | 60.79 ± 1.02 |
67.20 ± 0.62 |
65.61 ± 0.96 |
< 0.001 | 67.14 ± 0.99 |
68.95 ± 0.87 |
65.59 ± 1.22 |
0.004 |
| Adequacy | ||||||||
| Breakfast (0–10) | 9.04 ± 0.21 |
9.70 ± 0.07 |
9.46 ± 0.16 |
0.007 | 9.03 ± 0.23 |
9.40 ± 0.18 |
8.79 ± 0.25 |
0.019 |
| Mixed grains (0–5) | 1.58 ± 0.21 |
2.66 ± 0.11 |
2.30 ± 0.19 |
< 0.001 | 2.37 ± 0.16 | 2.29 ± 0.15 | 2.06 ± 0.18 | 0.260 |
| Total fruits (0–5) | 1.84 ± 0.19 |
2.52 ± 0.11 |
2.49 ± 0.19 |
0.015 | 3.29 ± 0.18 | 3.40 ± 0.14 | 3.01 ± 0.19 | 0.163 |
| Fresh fruits (0–5) | 1.91 ± 0.21 |
2.67 ± 0.12 |
2.67 ± 0.21 |
0.011 | 3.32 ± 0.19 | 3.43 ± 0.15 | 3.04 ± 0.20 | 0.192 |
| Total vegetables (0–5) | 3.53 ± 0.13 | 3.90 ± 0.07 | 3.87 ± 0.12 | 0.052 | 3.73 ± 0.10 |
3.96 ± 0.10 |
3.72 ± 0.11 |
0.046 |
| Vegetables, excluding kimchi and pickles (0–5) | 2.78 ± 0.16 |
3.41 ± 0.09 |
3.22 ± 0.13 |
0.002 | 3.78 ± 0.12 | 4.00 ± 0.11 | 3.77 ± 0.11 | 0.127 |
| Meat, fish, eggs, and beans (0–10) | 6.41 ± 0.33 |
7.43 ± 0.17 |
6.84 ± 0.26 |
0.003 | 7.33 ± 0.25 | 7.63 ± 0.19 | 7.02 ± 0.27 | 0.063 |
| Milk and milk products (0–10) | 2.42 ± 0.41 | 2.90 ± 0.24 | 2.67 ± 0.32 | 0.457 | 4.02 ± 0.36 | 3.91 ± 0.34 | 3.45 ± 0.40 | 0.321 |
| Moderation | ||||||||
| Saturated fatty acid (0–10) | 8.36 ± 0.29 | 8.82 ± 0.17 | 8.64 ± 0.22 | 0.286 | 7.87 ± 0.26 |
8.51 ± 0.20 |
7.83 ± 0.30 |
0.007 |
| Sodium (0–10) | 6.81 ± 0.29 | 6.65 ± 0.16 | 6.60 ± 0.26 | 0.844 | 8.24 ± 0.18 |
7.89 ± 0.19 |
8.43 ± 0.18 |
0.026 |
| Total sugar (0–10) | 7.33 ± 0.33 | 6.92 ± 0.19 | 7.17 ± 0.28 | 0.449 | 5.66 ± 0.32 | 5.76 ± 0.30 | 5.74 ± 0.33 | 0.946 |
| Energy balance | ||||||||
| Carbohydrate (0–5) | 2.44 ± 0.19 | 2.61 ± 0.13 | 2.82 ± 0.18 | 0.243 | 2.22 ± 0.16 | 2.23 ± 0.14 | 2.35 ± 0.17 | 0.722 |
| Fat (0–5) | 3.38 ± 0.17 | 3.44 ± 0.12 | 3.69 ± 0.17 | 0.241 | 3.13 ± 0.16 | 3.15 ± 0.14 | 2.98 ± 0.17 | 0.565 |
| Total energy (0–5) | 2.97 ± 0.22 |
3.56 ± 0.12 |
3.19 ± 0.17 |
0.013 | 3.16 ± 0.17 | 3.38 ± 0.15 | 3.41 ± 0.21 | 0.411 |
Table 1. General characteristics of the participants by household type and gender
n (weighted %) or weighted mean ± SE. Statistical analysis: Values were obtained using the general linear model for continuous variables and the BMI, body mass index. Currently working: “Yes” = currently employed; “No” = unemployed or economically inactive individuals. Smoking status: “Yes” = current smoker; “No” = former smoker or never smoker. Drinking status: “Yes” = consumed alcohol at least once a month in the past year; “No” = lifetime abstainer or consumed less than once a month. Self-rated health status: “Good” = very good or good, “Fair” = fair, “Poor” = poor or very poor. Obesity: defined as BMI ≥ 25 kg/m2. Abdominal obesity: defined as a waist circumference ≥ 90 cm for men and ≥ 85 cm for women. Diabetes: defined as fasting plasma glucose (FPG) ≥ 126 mg/dL, HbA1c ≥ 6.5%, or current use of antidiabetic medication. Hypertension: defined as systolic blood pressure ≥ 140 mmHg, diastolic blood pressure ≥ 90 mmHg, or current use of antihypertensive medication. Values are significantly different according to the Bonferroni post hoc test (
Table 2. Differences in dietary behaviors and nutrition-related factors by household type and gender
n (weighted %). n: unweighted value, %: weighted value. Statistical analysis: Companionship status: “Yes” = ate the meal with family or others; “No” = ate alone; “Not applicable” = meal frequency was ≤ 2 times per week during the past year. Dietary supplement use: Use of dietary supplements for ≥ 2 weeks during the past year.
Table 3. Comparison of daily energy and nutrient consumption and energy distribution ratios by household type and gender
Mean ± SE. Statistical analysis: Values were obtained using a general linear model for continuous variables in complex sample survey data analysis ( Carbohydrate (%), protein (%), and fat (%) indicate the percentage contribution of each macronutrient to total daily energy intake, adjusted for total energy intake. Values are significantly different according to the Bonferroni post hoc test (
Table 4. Risk of energy intake below the EER and nutrient intake below the EAR by household type and gender
Odds ratios (95% confidence intervals). Statistical analysis: Values were obtained using logistic regression analysis in complex sample survey data analysis. Energy intake was adjusted for age, residential area, education level, household income level, economic activity status, self-rated health status, and survey year. Other nutrients were adjusted for age, residential area, education level, household income, economic activity status, self-rated health, total energy intake, and survey year. Logistic regression could not be performed for carbohydrate intake in men due to a highly skewed response distribution. EER, estimated energy requirement; EAR, estimated average requirement. Energy intake was assessed based on the EER, as the 2020 Dietary Reference Intakes for Koreans (KDRIs) do not define an EAR for energy.
Table 5. Differences in KHEI scores by household type and gender
Mean ± SE. Statistical analysis: Values were obtained using the general linear model for continuous variables in complex sample survey data analysis ( All variables were adjusted for age, residential area, education level, household income, economic activity status, self-rated health, and survey year. KHEI, Korean Healthy Eating Index. Values are significantly different according to the Bonferroni post hoc test (


