
 KSCN
KSCN
Articles
- Page Path
- HOME > Korean J Community Nutr > Volume 31(3); 2026 > Article
-
Research Article
- Changing patterns and related factors of kimchi consumption among Korean adults: a nationwide cross-sectional analysis of the Korea National Health and Nutrition Examination Survey, 2010–2024
-
Hui-Yang Zhao1)
 , Hyunji Ham2), Sumin Kim2), Chang Hyeon Lee3), Kyungho Ha4), Sangah Shin5),†
 -
Korean Journal of Community Nutrition 2026;31(3):244-263.
DOI: https://doi.org/10.5720/kjcn.2026.00108
Published online: June 30, 2026
1)Master Student, Department of Food and Nutrition, Chung-Ang University, Anseong, Korea
2)Ph.D. Student, Department of Food Science and Nutrition, Jeju National University, Jeju, Korea
3)Researcher, Science-Culture Convergence Team, World Institute of Kimchi, Gwangju, Korea
4)Associate Professor, Department of Food Science and Nutrition, Jeju National University, Jeju, Korea
5)Associate Professor, Department of Food and Nutrition, Chung-Ang University, Anseong, Korea
- †Corresponding author: Sangah Shin Department of Food and Nutrition, Chung-Ang University, 4726 Seodong-daero, Daedeok-myeon, Anseong 17546, Korea Tel: +82-31-670-3259 Fax: +82-31-675-1381 Email: ivory8320@cau.ac.kr
• Received: March 16, 2026 • Revised: April 22, 2026 • Accepted: June 2, 2026
© 2026 The Korean Society of Community Nutrition
This is an Open-Access article distributed under the terms of the Creative Commons Attribution Non-Commercial License (https://creativecommons.org/licenses/by-nc/4.0) which permits unrestricted non-commercial use, distribution, and reproduction in any medium, provided the original work is properly cited.
- 1,311 Views
- 25 Download


Abstract
-
Objectives
- This study was conducted to analyze long-term trends in kimchi consumption and patterns among Korean adults using data from the Korea National Health and Nutrition Examination Survey (KNHANES) from 2010 to 2024, and to identify sociodemographic, dietary, and health-related factors associated with recent kimchi consumption.
-
Methods
- Data from the 5th (2010) through 9th (2024) KNHANES were utilized. Trend analysis included 103,267 participants, while factor analysis focused on 14,244 adults aged ≥ 30 years (2022–2024). Changes in consumption form (side dish versus ingredient) and locations were examined. Multiple logistic regression was used to calculate odds ratios (ORs) for meeting the recommended intake (40 g/day).
-
Results
- Over the past 15 years, kimchi consumption among Korean adults has significantly decreased regardless of gender (men: β = –1.53, women: β = –1.31, P for trend < 0.05). The proportion of individuals reporting no kimchi intake on the 24-hour recall day increased from 11.7% in 2010 to 22.7% in 2024. Among young adults (20–39 years), a qualitative shift occurred as consumption transitioned from side dishes to dish ingredients. At-home consumption decreased for all age groups under 60 years. Conversely, eating-out consumption increased for most groups, except for those aged 20–39 years, while school/workplace consumption increased only in the 0–9 years age group. Analysis of the factors associated with meeting the recommended intake revealed that men, older adults, rural residents, married individuals, alcohol consumers, and smokers were more likely to meet the recommendation. Conversely, frequent solo dining or skipping meals were significantly associated with a lower likelihood of meeting the recommendation.
-
Conclusion
- This study confirms a structural shift in the Korean diet. Future strategies for preserving traditional food culture and establishing nutritional policies must be tailored to reflect modern dietary changes, such as an increase in single-person households and the spread of a solo-dining culture.
INTRODUCTION
METHODS
1) Assessment and classification of kimchi consumption
2) Definition of general characteristics
RESULTS
DISCUSSION
-
CONFLICT OF INTEREST
There are no financial or other issues that might lead to a conflict of interest.
-
FUNDING
This study was supported by the National Research Foundation of Korea (NRF) grant funded by the Korean Government (MSIT; RS-2025-00556573). This study was supported by the World Institute of Kimchi (WIKIM) [No. KEB2602-3-2].
-
DATA AVAILABILITY
All the data and materials are publicly available on the KNHANES website (https://knhanes.kdca.go.kr/knhanes/main.do).
NOTES
Fig. 1.Trends in kimchi consumption by gender among Korean adults, Korea National Health and Nutrition Examination Survey 2010–2024. The panels show the mean daily intake (g/day) of (A) total kimchi, (B) baechu kimchi, (C) kkakdugi, (D) yeolmu kimchi, (E) nabak kimchi, and (F) other kimchi. Values are presented as survey-weighted means. Blue lines indicate the total population, orange lines indicate men, and green lines indicate women. β-coefficients represent annual changes in intake estimated using survey-weighted linear regression (PROC SURVEYREG); P for trend values were obtained from the same models.
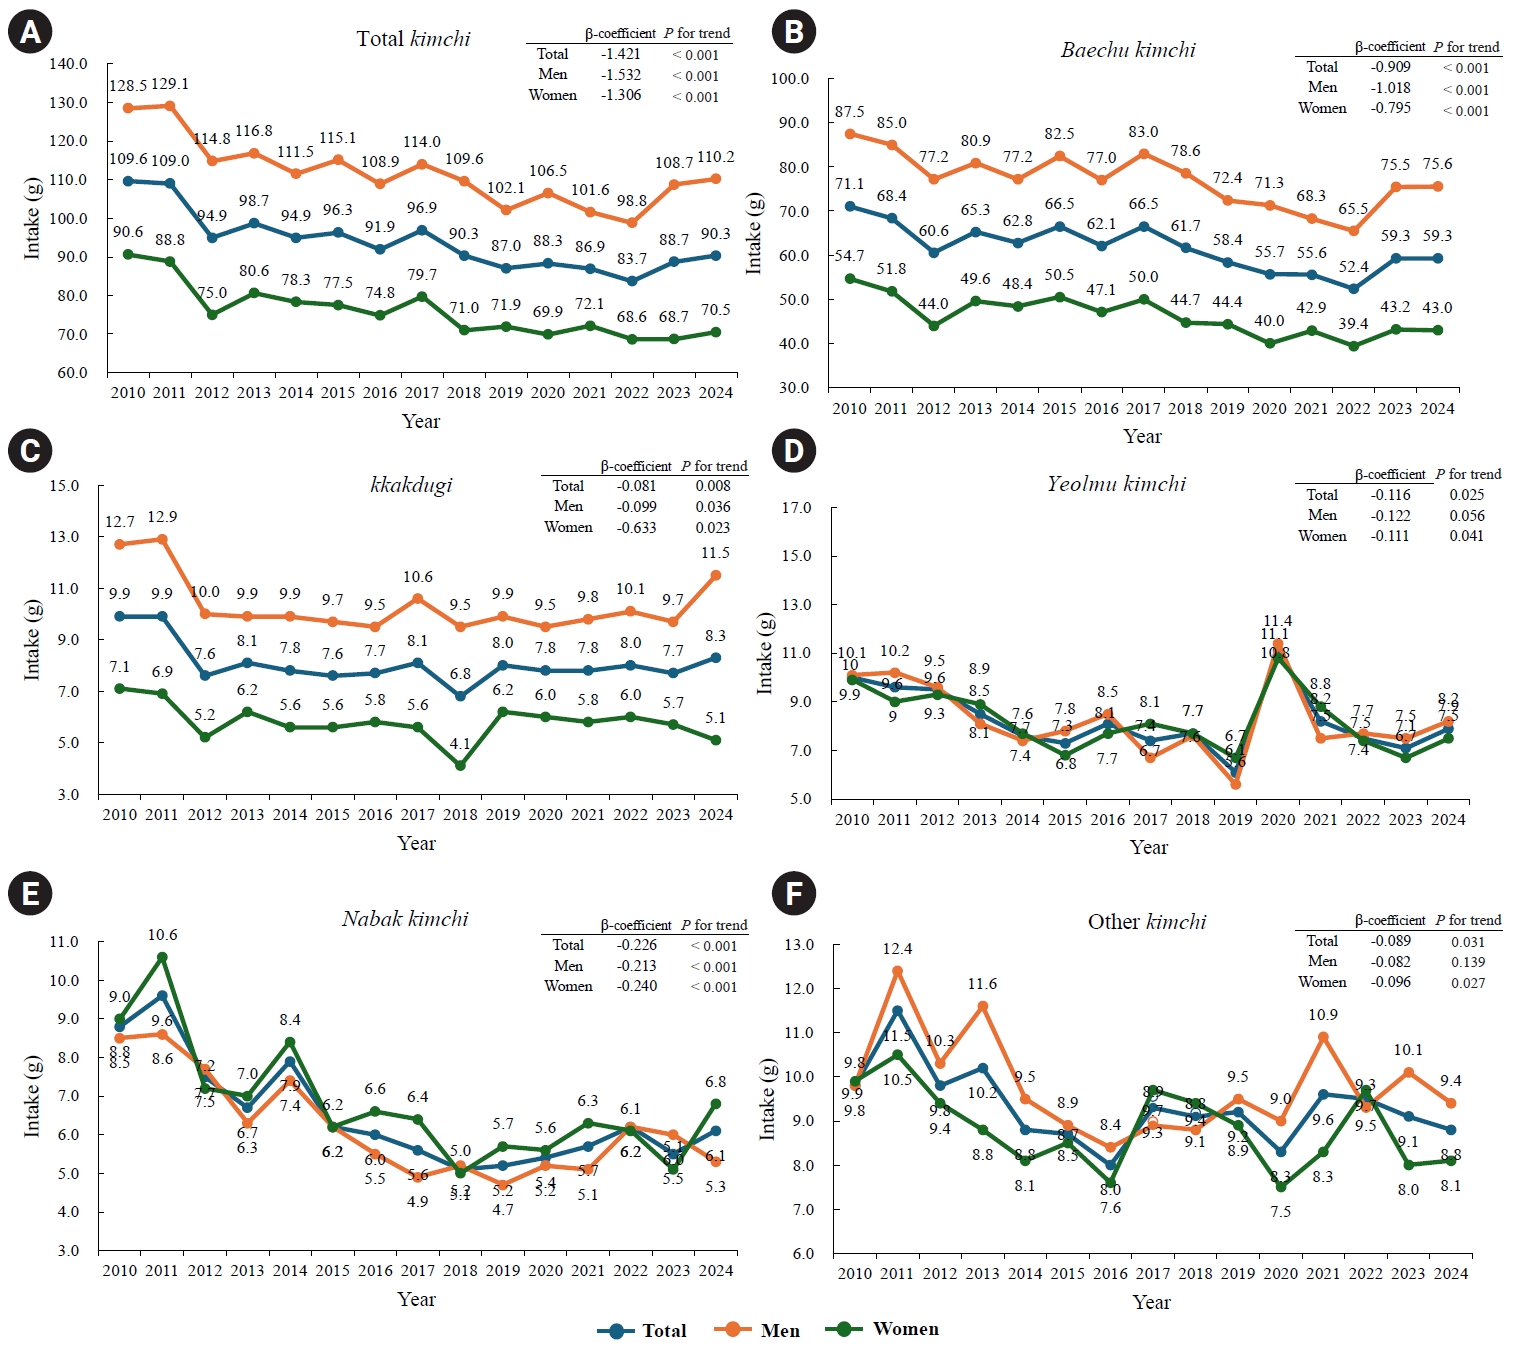
Fig. 2.Trends in kimchi consumption by gender among participants in the kimchi intake group, Korea National Health and Nutrition Examination Survey 2010–2024. The panels show the mean daily intake (g/day) of (A) total kimchi, (B) baechu kimchi, (C) kkakdugi, (D) yeolmu kimchi, (E) nabak kimchi, and (F) other kimchi. Values are presented as survey-weighted means. Blue lines indicate the total population, orange lines indicate men, and green lines indicate women. β-coefficients represent annual changes in intake estimated using survey-weighted linear regression (PROC SURVEYREG); P for trend values were obtained from the same models.
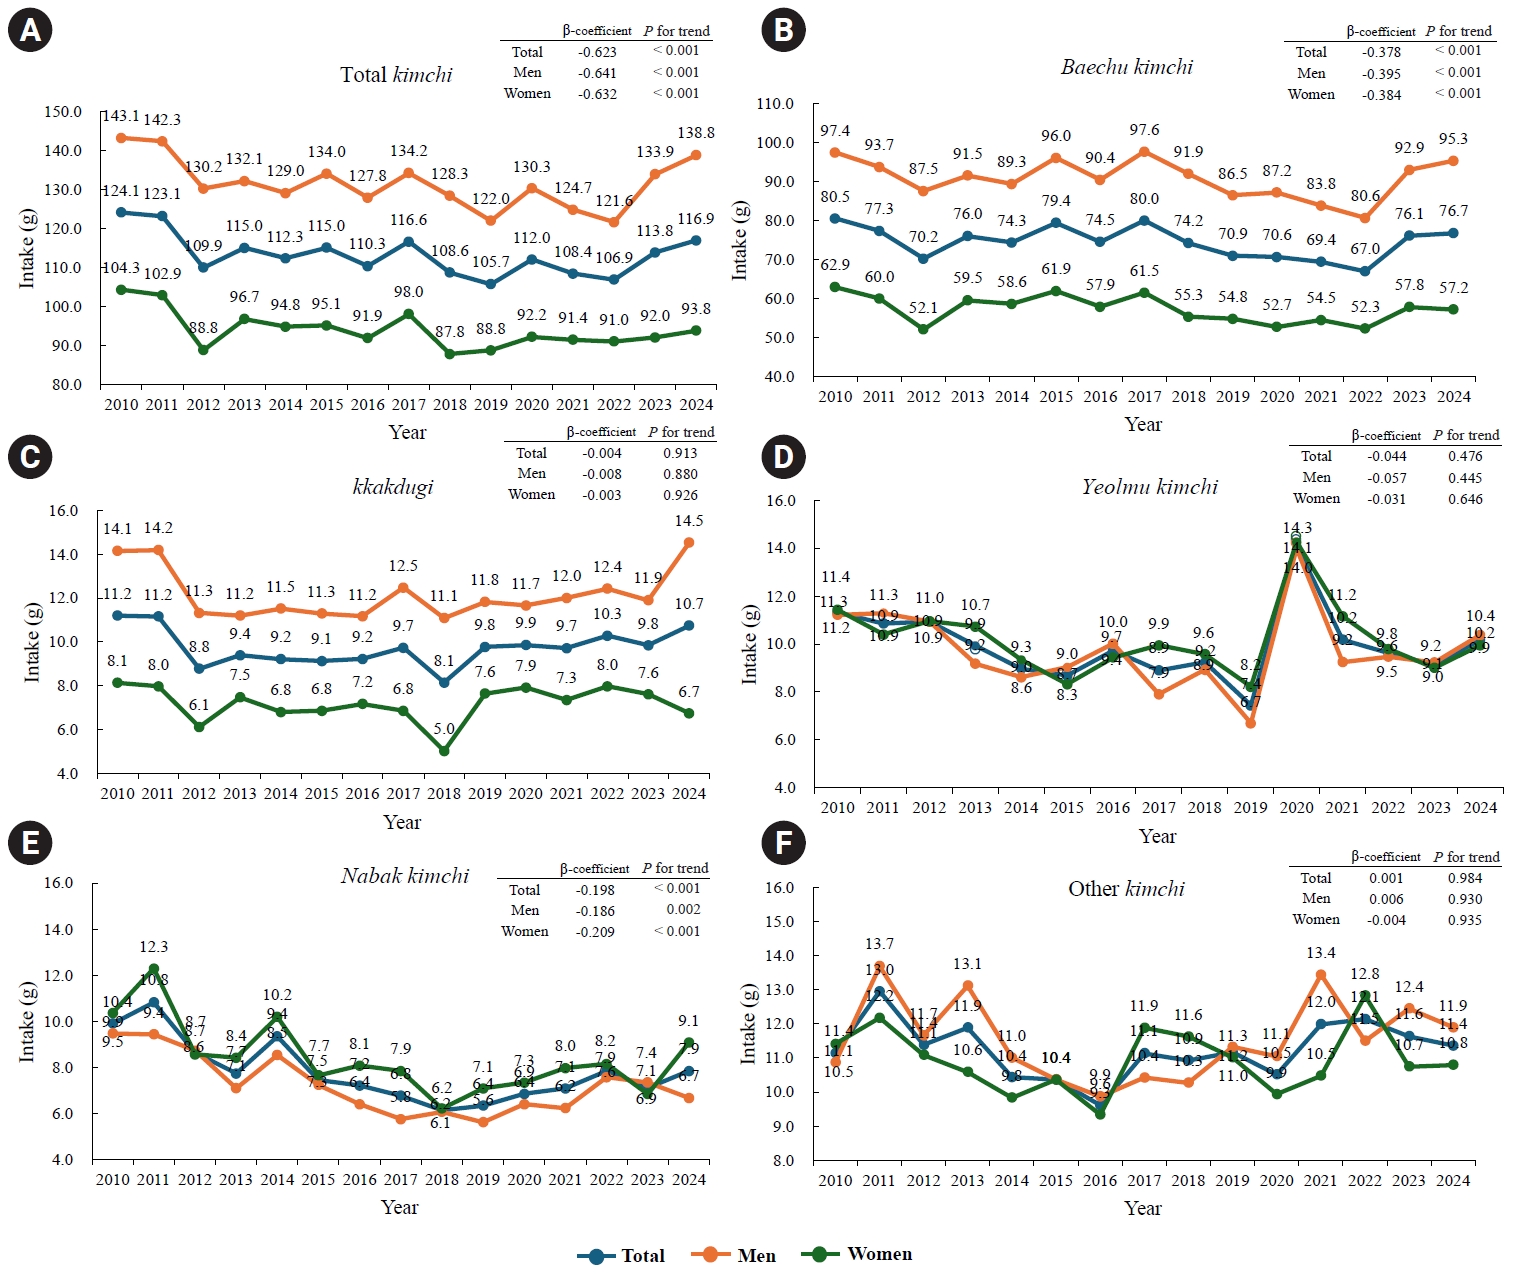
Fig. 3.Trends in the proportion of the kimchi non-intake group by gender among Korean adults, Korea National Health and Nutrition Examination Survey 2010–2024. Values are presented as survey-weighted percentages (%). Blue lines indicate the total population, orange lines indicate men, and green lines indicate women. The kimchi non-intake group was defined as participants reporting no kimchi consumption on the 24-hour dietary recall day.
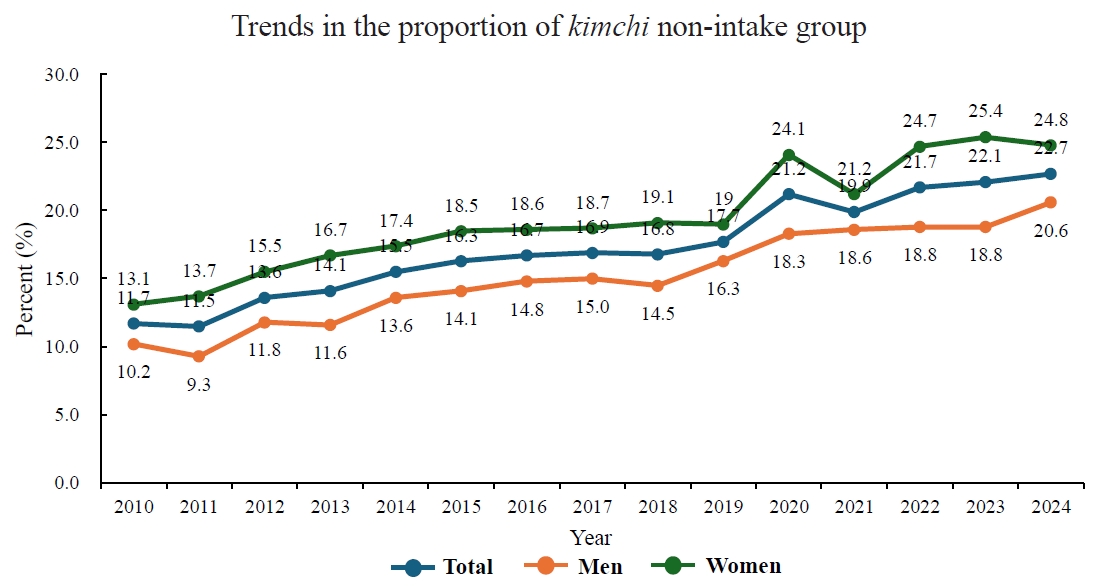
Fig. 4.Age-specific trends in kimchi consumption patterns among Korean adults, Korea National Health and Nutrition Examination Survey 2010–2024. The panels show the proportion (%) of kimchi consumed as a side dish (upper panel) and kimchi consumed in dish ingredient (lower panel). Lines represent age groups (0–9, 10–19, 20–39, 40–59, and ≥ 60 years). Values are presented as survey-weighted percentages. β-coefficients represent annual changes in intake proportion estimated using survey-weighted linear regression (PROC SURVEYREG); P for trend values were obtained from the same models.
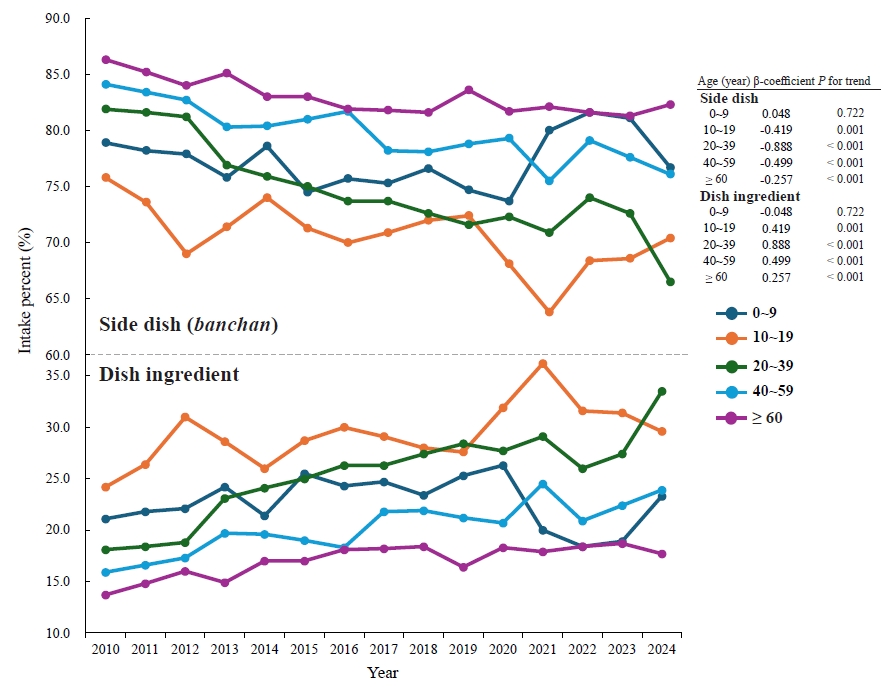
Fig. 5.Age-specific trends in kimchi consumption by meal location among Korean adults, Korea National Health and Nutrition Examination Survey 2010–2024. The panels show the mean daily intake (g/day) of kimchi consumed at home, school/workplace, and restaurants for each age group: (A) home, (B) school/workplace, and (C) restaurant. The values are presented as survey-weighted means. Lines represent age groups (0–9, 10–19, 20–39, 40–59, and ≥ 60 years). β-coefficients represent annual changes in intake estimated using survey-weighted linear regression (PROC SURVEYREG); P for trend values were obtained from the same models.
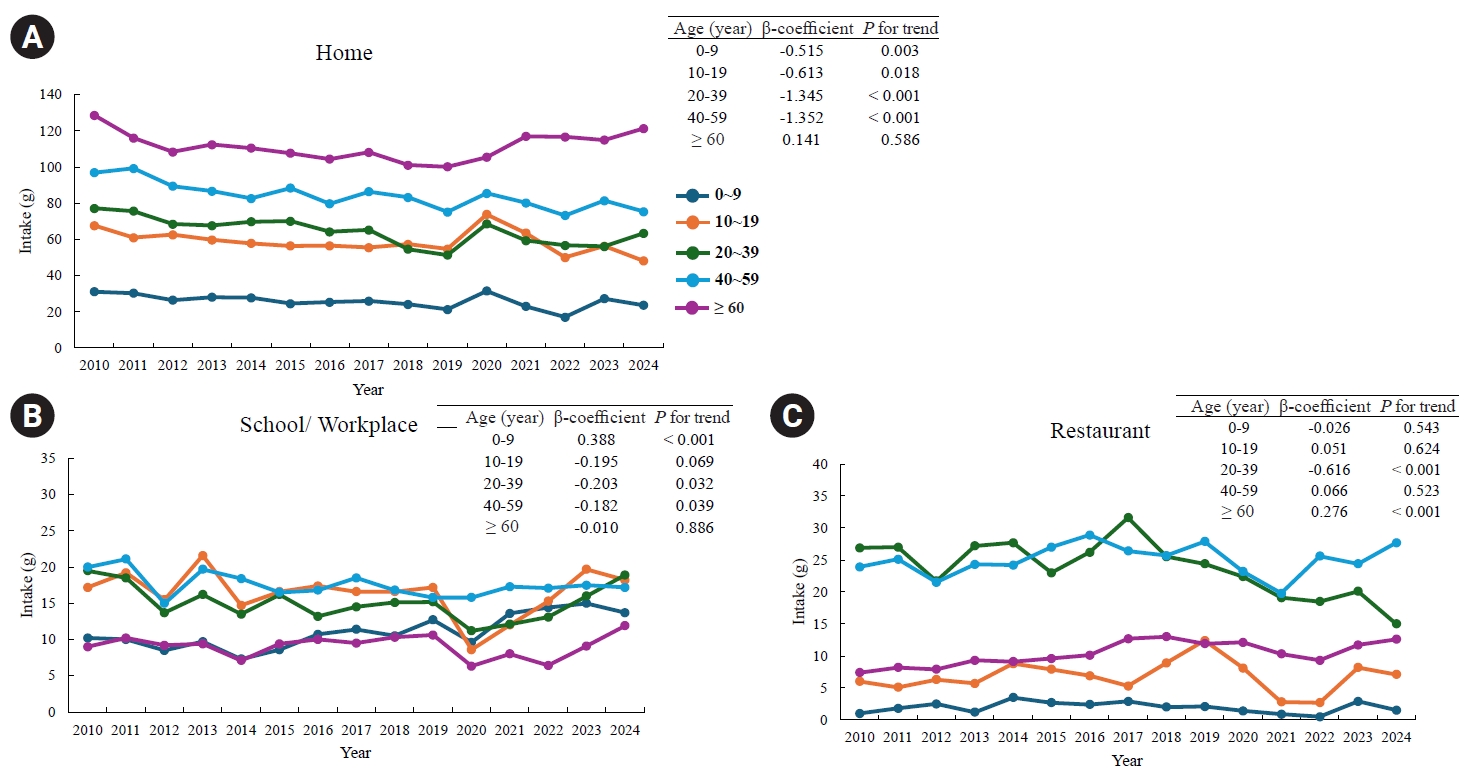
Table 1.
Kimchi consumption according to general factors
| Characteristics | n | Total kimchi | Baechu kimchi | Kkakduki | Yeolmu kimchi | Nabak kimchi | Other kimchi |
|---|---|---|---|---|---|---|---|
| 1. Socioeconomic characteristics | |||||||
| Income level | |||||||
| Low | 2,920 | 116.92 ± 3.04 | 71.18 ± 2.38 | 7.08 ± 0.71 | 12.90 ± 1.16 | 14.18 ± 1.37 | 11.58 ± 1.07 |
| Lower-middle | 3,484 | 107.16 ± 2.76 | 66.21 ± 1.95 | 9.34 ± 0.62 | 11.46 ± 1.32 | 8.25 ± 0.83 | 11.90 ± 0.81 |
| Upper-middle | 3,783 | 99.81 ± 2.16 | 64.73 ± 1.68 | 9.03 ± 0.56 | 9.19 ± 0.83 | 6.62 ± 0.72 | 10.23 ± 0.64 |
| High | 4,008 | 95.57 ± 1.99 | 60.79 ± 1.55 | 10.33 ± 0.68 | 7.77 ± 0.71 | 5.43 ± 0.67 | 11.25 ± 0.90 |
| P-value | < 0.001 | < 0.001 | 0.004 | < 0.001 | < 0.001 | 0.567 | |
| Education level | |||||||
| Middle school | 4,146 | 124.68 ± 2.68 | 73.13 ± 2.06 | 8.23 ± 0.60 | 15.11 ± 1.17 | 14.73 ± 1.12 | 13.49 ± 0.89 |
| Graduate or below high school graduate | 4,230 | 107.96 ± 2.07 | 68.12 ± 1.57 | 9.82 ± 0.58 | 9.89 ± 0.82 | 7.56 ± 0.66 | 12.56 ± 0.88 |
| University graduate or above | 5,450 | 87.08 ± 1.56 | 57.55 ± 1.19 | 9.20 ± 0.45 | 6.62 ± 0.54 | 4.43 ± 0.54 | 9.28 ± 0.54 |
| P-value | < 0.001 | < 0.001 | 0.307 | < 0.001 | < 0.001 | < 0.001 | |
| Residential area | |||||||
| Urban | 11,042 | 98.06 ± 1.42 | 61.35 ± 1.05 | 9.04 ± 0.36 | 9.43 ± 0.65 | 7.48 ± 0.47 | 10.77 ± 0.52 |
| Rural | 3,202 | 125.51 ± 4.19 | 81.45 ± 3.43 | 9.95 ± 0.73 | 11.76 ± 1.24 | 9.24 ± 1.05 | 13.11 ± 1.10 |
| P-value | < 0.001 | < 0.001 | 0.265 | 0.096 | 0.127 | 0.057 | |
| 2. Dietary factors | |||||||
| Eating alone | |||||||
| None | 3,847 | 125.34 ± 2.56 | 72.68 ± 1.79 | 9.95 ± 0.62 | 14.21 ± 1.12 | 13.77 ± 1.14 | 14.73 ± 0.95 |
| 1/day | 4,895 | 97.3 ± 1.78 | 63.88 ± 1.38 | 9.60 ± 0.54 | 8.22 ± 0.60 | 5.65 ± 0.50 | 9.95 ± 0.64 |
| ≥ 2/day | 5,502 | 94.5 ± 1.85 | 61.04 ± 1.42 | 8.33 ± 0.47 | 8.73 ± 0.78 | 6.20 ± 0.53 | 10.2 ± 0.51 |
| P-value | < 0.001 | < 0.001 | 0.019 | < 0.001 | < 0.001 | < 0.001 | |
| Dining out frequency | |||||||
| ≥ 1/day | 2,250 | 99.55 ± 2.69 | 66.66 ± 1.96 | 12.18 ± 0.81 | 8.05 ± 1.22 | 4.51 ± 0.73 | 8.15 ± 0.70 |
| 1–6/week | 7,243 | 96.57 ± 1.53 | 62.11 ± 1.21 | 8.71 ± 0.42 | 8.63 ± 0.57 | 5.72 ± 0.44 | 11.4 ± 0.56 |
| 1–3/month | 3,220 | 114.18 ± 2.68 | 66.81 ± 2.01 | 8.68 ± 0.69 | 13.36 ± 1.11 | 12.43 ± 1.05 | 12.90 ± 0.90 |
| Scarcely | 1,531 | 125.58 ± 4.36 | 74.28 ± 3.28 | 6.50 ± 0.78 | 13.71 ± 1.63 | 18.20 ± 2.07 | 12.90 ± 1.24 |
| P-value | < 0.001 | 0.030 | < 0.001 | < 0.001 | < 0.001 | < 0.001 | |
| Meal frequency | |||||||
| 3/day | 9,935 | 113.66 ± 1.68 | 68.97 ± 1.28 | 9.63 ± 0.40 | 12.37 ± 0.81 | 9.70 ± 0.58 | 12.98 ± 0.61 |
| 1–2/day | 4,309 | 82.23 ± 1.73 | 57.05 ± 1.36 | 8.36 ± 0.52 | 4.98 ± 0.45 | 4.11 ± 0.50 | 7.73 ± 0.49 |
| P-value | < 0.001 | < 0.001 | 0.044 | < 0.001 | < 0.001 | < 0.001 | |
| 3. Health-related factors | |||||||
| Alcohol consumption | |||||||
| No | 7,164 | 98.15 ± 1.73 | 58.33 ± 1.33 | 8.14 ± 0.43 | 11.12 ± 0.72 | 8.95 ± 0.59 | 11.60 ± 0.56 |
| Yes | 6,821 | 106.17 ± 1.65 | 70.04 ± 1.27 | 10.06 ± 0.44 | 8.39 ± 0.55 | 6.76 ± 0.53 | 10.91 ± 0.61 |
| P-value | < 0.001 | < 0.001 | 0.001 | < 0.001 | 0.002 | 0.326 | |
| Smoking status | |||||||
| Never smoker | 8,578 | 89.67 ± 1.42 | 53.6 ± 1.07 | 7.60 ± 0.35 | 9.53 ± 0.58 | 7.99 ± 0.50 | 10.95 ± 0.55 |
| Past smoker | 3,443 | 120.68 ± 2.35 | 77.6 ± 1.88 | 11.64 ± 0.67 | 10.93 ± 0.90 | 8.15 ± 0.73 | 12.36 ± 0.72 |
| Current smoker | 1,952 | 116.87 ± 2.93 | 81.57 ± 2.32 | 10.61 ± 0.81 | 7.89 ± 0.88 | 6.38 ± 0.84 | 10.42 ± 0.85 |
| P-value | < 0.001 | < 0.001 | < 0.001 | 0.375 | 0.128 | 0.876 | |
| Physical activity | |||||||
| No | 7,608 | 105.87 ± 1.78 | 66.39 ± 1.33 | 8.87 ± 0.46 | 10.02 ± 0.63 | 8.63 ± 0.61 | 11.95 ± 0.61 |
| Yes | 5,528 | 97.59 ± 1.72 | 61.55 ± 1.30 | 9.24 ± 0.44 | 9.32 ± 0.68 | 6.70 ± 0.57 | 10.78 ± 0.61 |
| P-value | < 0.001 | 0.004 | 0.540 | 0.349 | 0.012 | 0.128 | |
| Obesity1) | |||||||
| Underweight | 759 | 94.78 ± 4.95 | 56.29 ± 3.40 | 7.83 ± 1.10 | 11.37 ± 2.07 | 9.14 ± 1.94 | 10.15 ± 1.44 |
| Normal | 5,093 | 91.87 ± 1.68 | 57.58 ± 1.28 | 7.72 ± 0.48 | 9.66 ± 0.67 | 6.87 ± 0.58 | 10.04 ± 0.55 |
| Overweight | 3,280 | 106.72 ± 2.26 | 65.98 ± 1.74 | 10.21 ± 0.62 | 10.25 ± 0.88 | 8.35 ± 0.76 | 11.93 ± 0.75 |
| Obese | 5,112 | 111.91 ± 2.07 | 72.22 ± 1.57 | 10.14 ± 0.53 | 9.53 ± 0.87 | 8.10 ± 0.64 | 11.92 ± 0.81 |
| P-value | < 0.001 | < 0.001 | < 0.001 | 0.610 | 0.378 | 0.032 | |
| 4. Household factors | |||||||
| Marital status | |||||||
| Single | 3,692 | 95.54 ± 2.17 | 63.38 ± 1.75 | 7.39 ± 0.55 | 7.85 ± 0.65 | 6.81 ± 0.63 | 10.10 ± 0.73 |
| Married | 10,536 | 105.44 ± 1.53 | 65.42 ± 1.12 | 9.83 ± 0.40 | 10.5 ± 0.70 | 8.12 ± 0.51 | 11.56 ± 0.53 |
| P-value | < 0.001 | 0.270 | < 0.001 | 0.002 | 0.083 | 0.074 | |
| No. of household members | |||||||
| 1 | 2,407 | 107.15 ± 2.87 | 71.49 ± 2.13 | 9.25 ± 0.80 | 8.42 ± 0.78 | 6.96 ± 0.76 | 11.04 ± 0.96 |
| 2 | 5,594 | 111.48 ± 2.25 | 66.72 ± 1.55 | 8.76 ± 0.49 | 12.51 ± 0.9 | 11.16 ± 0.81 | 12.33 ± 0.7 |
| 3 | 3,278 | 96.86 ± 2.48 | 62.32 ± 1.88 | 8.99 ± 0.69 | 8.99 ± 0.79 | 5.76 ± 0.76 | 10.80 ± 0.84 |
| 4 | 2,340 | 93.35 ± 2.69 | 59.53 ± 1.93 | 10.44 ± 0.82 | 7.61 ± 1.29 | 4.92 ± 0.87 | 10.85 ± 1.13 |
| 5 | 489 | 98.8 ± 5.54 | 67.85 ± 4.36 | 7.27 ± 1.14 | 7.41 ± 1.61 | 9.34 ± 2.75 | 6.93 ± 2.14 |
| 6 | 136 | 96.72 ± 11.54 | 63.33 ± 6.69 | 11.77 ± 3.4 | 12.77 ± 7.01 | 3.53 ± 1.70 | 5.32 ± 1.69 |
| P-value | < 0.001 | < 0.001 | 0.386 | 0.042 | < 0.001 | 0.046 |
Values are presented as weighted means ± standard errors (SE) for continuous variables and weighted percentages for categorical variables, accounting for the complex sampling design. Integrated weights for the period of 2022–2024 were applied.
The numbers of missing values were as follows: education level (n = 418), household income (n = 49), alcohol consumption (n = 259), smoking status (n = 271), physical activity (n = 1,108), and marital status (n = 16).
P-values for differences among survey years were calculated using linear regression models (PROC SURVEYREG) for continuous variables and Rao–Scott chi‑square tests (PROC SURVEYFREQ) for categorical variables.
1)Obesity: Underweight (BMI < 18.5 kg/m2), normal (18.5 kg/m2 < BMI ≤ 23 kg/m2), overweight (23 kg/m2 < BMI ≤ 25 kg/m2), obese (≥ 25 kg/m2).
Table 2.Age-specific analysis of sociodemographic and health behavior factors associated with kimchi intake from 2022 to 2024
Numbers of missing values were as follows: education level (n = 418), household income (n = 49), alcohol consumption (n = 259), smoking status (n = 271), physical activity (n = 1,108), and marital status (n = 16).
Adjusting for age (continuous), total energy intake (continuous), and total food intake (continuous).
OR, odds ratio; CI, confidence interval; BMI, body mass index.
Table 3.Gender-specific analysis of sociodemographic and health behavior factors associated with kimchi intake from 2022 to 2024
Numbers of missing values were as follows: education level (n = 418), household income (n = 49), alcohol consumption (n = 259), smoking status (n = 271), physical activity (n = 1,108), and marital status (n = 16).
Adjusted for age (continuous), total energy intake (continuous), and total food intake (continuous).
OR, odds ratio; CI, confidence interval, BMI, body mass index.
Table 4.Multivariable-adjusted age-specific analysis of sociodemographic and health behavior factors associated with kimchi intake from 2022 to 2024
The number of missing values were as follows: education level (n = 418), household income (n = 49), alcohol consumption (n = 259), smoking status (n = 271), physical activity (n = 1,108), and marital status (n = 16).
Adjusting for age (continuous), total energy intake (continuous), total food intake (continuous), education level, household income, residential area, household composition (single-person household), smoking status, alcohol consumption, and physical activity.
OR, odds ratio; CI, confidence interval, BMI, body mass index.
Table 5.Multivariable-adjusted gender-specific analysis of sociodemographic and health behavior factors associated with kimchi intake from 2022 to 2024
The number of missing values were as follows: education level (n = 418), household income (n = 49), alcohol consumption (n = 259), smoking status (n = 271), physical activity (n = 1,108), and marital status (n = 16).
Adjusting for age (continuous), total energy intake (continuous), total food intake (continuous), education level, household income, residential area, household composition (single-person household), smoking status, alcohol consumption, and physical activity.
OR, odds ratio; CI, confidence interval, BMI, body mass index.
- 1. UNESCO. Kimjang, making and sharing kimchi in the Republic of Korea [Internet]. UNESCO; 2013 [cited 2026 Mar 1]. Available from: https://ich.unesco.org/en/decisions/8.COM/8.23
- 2. U.S. Department of Health and Human Services (HHS), United States Department of Agriculture (USDA). Dietary guidelines for Americans 2025–2030. HHS, USDA; 2026.
- 3. Sharma A, Lee HJ. Revisiting the potential anti-obesity effects of kimchi and lactic acid bacteria isolated from kimchi: a lustrum of evidence. J Ethn Food 2024; 11: 36.ArticlePDF
- 4. Park KY, Hong GH, Lee SY, Lee YJ. Kimchi and its antiobesity and anticancer functions. J Ethn Food 2024; 11: 37.ArticlePDF
- 5. Yang SJ, Lee JE, Lim SM, Kim YJ, Lee NK, Paik HD. Antioxidant and immune-enhancing effects of probiotic Lactobacillus plantarum 200655 isolated from kimchi. Food Sci Biotechnol 2018; 28(2): 491-499. ArticlePubMedPMCPDF
- 6. Kim HJ, Kwon MS, Hwang H, Choi HS, Lee WJ, Choi SP, et al. A review of the health benefits of kimchi functional compounds and metabolites. Microbiol Biotechnol Lett 2023; 51(4): 353-373. Article
- 7. Bae S, Park H. Age-stratified trends in nutrition and lifestyle transitions in Korea: findings from KNHANES 2013–2022. Nutrients 2025; 17(20): 3282.ArticlePubMedPMC
- 8. JipyoNuri. Average number of household members [Internet]. Ministry of Data and Statistics; 2025 Nov 3 [cited 2026 Mar 1]. Available from: https://www.index.go.kr/unity/potal/indicator/IndexInfo.do?cdNo=2&clasCd=10&idxCd=F0017
- 9. Oh SE, Kim SH, Park HS. Health behaviors, nutritional status, and mental health associated with eating alone in Korean adults: based on the 7th Korea National Health and Nutrition Examination Survey. Korean J Fam Pract 2022; 12(1): 28-34. Article
- 10. Bumbudsanpharoke N, Ko S. Packaging technology for home meal replacement: innovations and future prospective. Food Control 2022; 132: 108470.Article
- 11. Choi JG, Zhang YW, Xu SN. Detecting turning points and phases of expansions and recessions of the restaurant industry: subject to Korean restaurant industry business and its growth cycles. Glob Bus Finance Rev 2023; 28(7): 46-58. Article
- 12. Kim EK, Ha AW, Choi EO, Ju SY. Analysis of kimchi, vegetable and fruit consumption trends among Korean adults: data from the Korea National Health and Nutrition Examination Survey (1998-2012). Nutr Res Pract 2016; 10(2): 188-197. ArticlePubMedPMCLink
- 13. Jeong J, Park J, Lee YK, Hong SW, Shin S. Analysis of intake trends of kimchi, fruits and vegetables (1998-2020) and factors associated with the intake (2016-2020): based on the Korea National Health and Nutrition Examination Survey. J Nutr Health 2023; 56(4): 404-418. ArticleLink
- 14. Song Y, Park MJ, Paik HY, Joung H. Secular trends in dietary patterns and obesity-related risk factors in Korean adolescents aged 10–19 years. Int J Obes (Lond) 2010; 34: 48-56. ArticlePubMedPDF
- 15. Tan LJ, Oh SJ, Nasan-Ulzii B, Lee W, Hong SW, Shin S. Association between dietary patterns and obesity: a longitudinal prospective cohort study. Public Health 2024; 234: 217-223. ArticlePubMed
- 16. Kim HY, Park ES, Choi YS, Park SJ, Kim JH, Chang HK, et al. Kimchi improves irritable bowel syndrome: results of a randomized, double-blind placebo-controlled study. Food Nutr Res 2022; 66: 8268.ArticlePubMedPMCLink
- 17. Kwon JH, Shim JE, Park MK, Paik HY. Evaluation of fruits and vegetables intake for prevention of chronic disease in Korean adults aged 30 years and over: using the Third Korea National Health and Nutrition Examination Survey (KNHANES III), 2005. Korean J Nutr 2009; 42(2): 146-157. Article
- 18. Park J, Lee HJ. Shifts in kimchi consumption between 2005 and 2015 by region and income level in the Korean population: Korea National Health and Nutrition Examination Survey (2005, 2015). Korean J Community Nutr 2017; 22(2): 145-158. ArticleLink
- 19. The Korean Nutrition Society (KNS). 2025 Dietary reference intakes for Koreans [Internet]. Ministry of Health and Welfare, KNS; 2025 [cited 2026 Mar 1]. Available from: https://www.kns.or.kr/fileroom/fileroom_view.asp?idx=167&BoardID=Kdr
- 20. Kim H, Oh SY, Kang MH, Kim KN, Kim Y, Chang N. Association between kimchi intake and asthma in Korean adults: the fourth and fifth Korea National Health and Nutrition Examination Survey (2007–2011). J Med Food 2014; 17(1): 172-178. ArticlePubMedPMCLink
- 21. Kim HJ, Ju SY, Park CR, Park YK. Relationship between kimchi and metabolic syndrome in Korean adults : data from the Korea National Health and Nutrition Examination Surveys (KNHANES) 2007~2012. J Korean Diet Assoc 2016; 22(3): 151-162. Article
- 22. Haam JH, Kim BT, Kim EM, Kwon H, Kang JH, Park JH, et al. Diagnosis of obesity: 2022 update of clinical practice guidelines for obesity by the Korean Society for the Study of Obesity. J Obes Metab Syndr 2023; 32(2): 121-129. ArticlePubMedPMC
- 23. Korea Disease Control and Prevention Agency (KDCA). Guidelines for the use of raw data from the 2023 Korea National Health and Nutrition Examination Survey (KNHANES IX-1). KDCA; 2025.
- 24. Park KY, Kwon DY, Lee KW, Park S. Korean functional foods: composition, processing and health benefits. CRC Press; 2018.
- 25. Jung H, Yun YR, Hong SW, Shin S. Association between kimchi consumption and obesity based on BMI and abdominal obesity in Korean adults: a cross-sectional analysis of the Health Examinees study. BMJ Open 2024; 14(2): e076650.ArticlePubMedPMC
- 26. Korea Rural Economic Institute. 2025 Analysis report on the actual condition of the kimchi industry (based on 2024 data) [Internet]. KREI; 2024 [cited 2026 Mar 1]. Available from: https://www.atfis.or.kr/home/board/FB0003.do?act=read&bpoId=5807
- 27. Park WS. The present status and future prospects of kimchi industry in Korea. Food Sci Ind 2020; 53(2): 166-182. Article
- 28. Kim JH, Yoon HR. A survey on the nationwide customers’ usage of kimchi consumption. Korean J Food Nutr 2012; 25(2): 299-307. Article
- 29. Jang HC. Korean kimchi loved abroad [Internet]. Ministry of Culture, Sports and Tourism; 2024 [cited 2026 Mar 1]. Available from: https://www.korean-culture.org/koreanet/view.do?seq=1047280
- 30. Lee TH. K-Food captivating the world: “The global spread of Korean food culture” [Internet]. Environmental Monitoring News; 2024 [cited 2026 Mar 1]. Available from: https://www.sisadays.co.kr/news/311591
- 31. Min SH, Lee SH. Determinants of kimchi consumption behavior: a logit model analysis. J Agric Life Environ Sci 2023; 35(3): 191-201. Article
- 32. Ahn BC, Engelhardt K, Joung H. Diet variety is associated with socio-economic factors. Ecol Food Nutr 2006; 45(6): 417-430. Article
- 33. Ferguson CJ, Winegard B, Winegard BM. Who is the fairest one of all? How evolution guides peer and media influences on female body dissatisfaction. Rev Gen Psychol 2011; 15(1): 11-28. ArticleLink
- 34. Kang NY, Jung BM. Analysis of the difference in nutrients intake, dietary behaviors and food intake frequency of single-and non single-person households: the Korea National Health and Nutrition Examination Survey (KNHANES), 2014–2016. Korean J Community Nutr 2019; 24(1): 1-17. ArticleLink
- 35. Cho MS, Lee SJ. Dietary behavior, nutrient intake, and mental health of middle-aged single- and multi-person households in Korea: using data from the Korea National Health and Nutrition Examination Survey 2015-2019. J Korean Soc Food Cult 2023; 38(5): 283-292. Article
- 36. Yoo SE, An D. An analysis of the factors affecting the consumption of home meal replacement and eating out. Korean J Food Mark Econ 2023; 40(2): 47-64. Article
- 37. Chung IB, Chang N. Effects of alcohol drinking frequency and foods consumed along with alcohol on anthropometry, serum lipid levels, and blood pressure in male patients with type 2 diabetes mellitus. J Nutr Health 2008; 41(4): 317-326.
- 38. Chong MY, Han I. Analysis on the nutritional intake status by smoking, drinking, and obesity in adult over 19: insights from the 2019 Korean National Health and Nutrition Examination Survey. J Nutr Health 2025; 58(1): 41-58. ArticleLink
- 39. Schlesinger S, Neuenschwander M, Schwedhelm C, Hoffmann G, Bechthold A, Boeing H, et al. Food groups and risk of overweight, obesity, and weight gain: a systematic review and dose-response meta-analysis of prospective studies. Adv Nutr 2019; 10(2): 205-218. ArticlePubMedPMC
- 40. Choi J, Kim SY. Changes in the sodium content of different types of kimchi during storage: a preliminary study to assess the actual sodium intake and improv the food composition database. J Korean Soc Food Cult 2025; 40(2): 92-103. Article
REFERENCES
Figure & Data
REFERENCES
Citations
Citations to this article as recorded by 
 Cite
Cite XML Download
- Figure
-
- We recommend
- Related articles
-
- Differences in lunch nutrient intake and nutritional adequacy among Korean older adults by meal site: a cross-sectional analysis of the 2018–2021 Korea National Health and Nutrition Examination Survey data
- Association between nutrient intake and frailty status in Korean older adults: a cross-sectional study using the 9th (2022–2023) Korea National Health and Nutrition Examination Survey
- Comparison of dietary behaviors and nutrient intake by gender and household type among older Koreans: a cross-sectional study using data from the 8th Korea National Health and Nutrition Examination Survey
- Prevalence of coronary artery disease according to lifestyle characteristics, nutrient intake level, and comorbidities among Koreans aged 40 years and older: a cross-sectional study using data from the 7th (2016–2018) Korea National Health and Nutrition Examination Survey
- Ultra-processed food intake and dietary behaviors in Korean adolescents: a cross-sectional study based on the 2019–2023 Korea National Health and Nutrition Examination Survey
Changing patterns and related factors of kimchi consumption among Korean adults: a nationwide cross-sectional analysis of the Korea National Health and Nutrition Examination Survey, 2010–2024
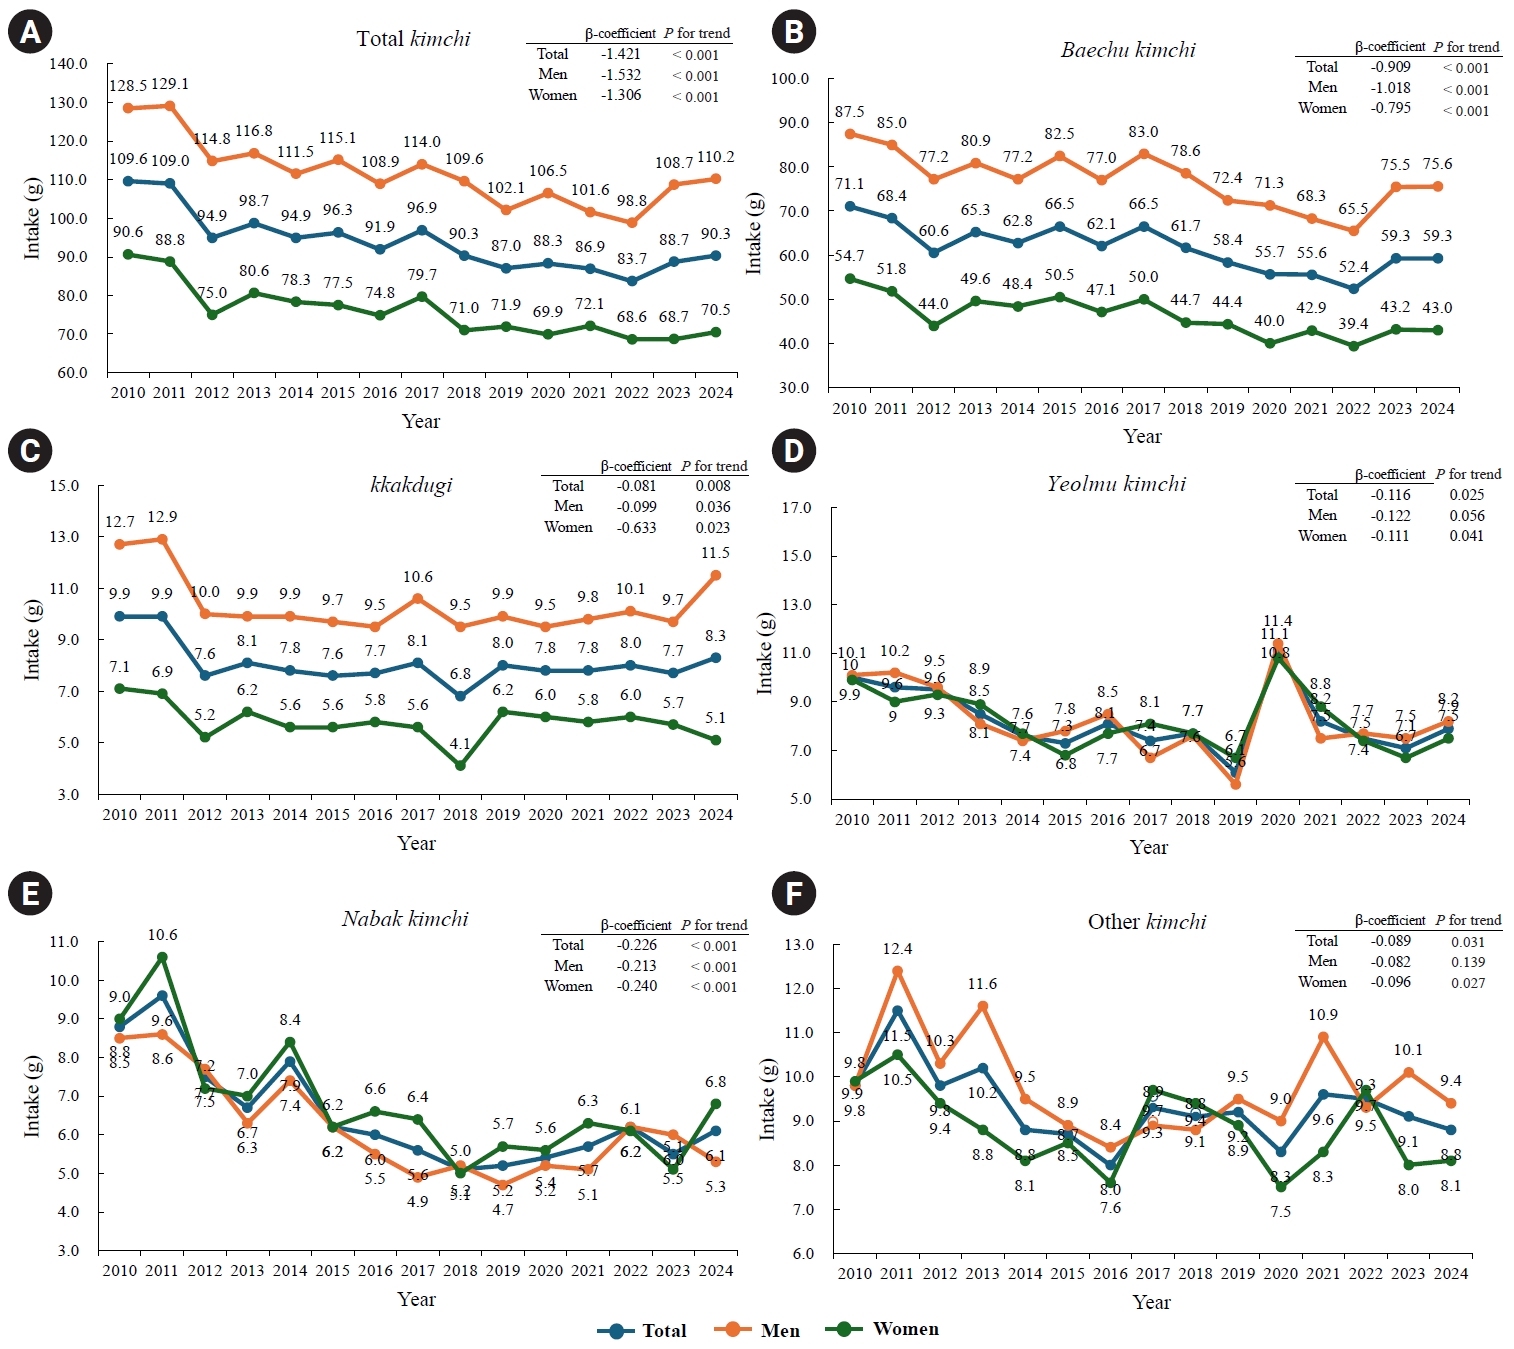
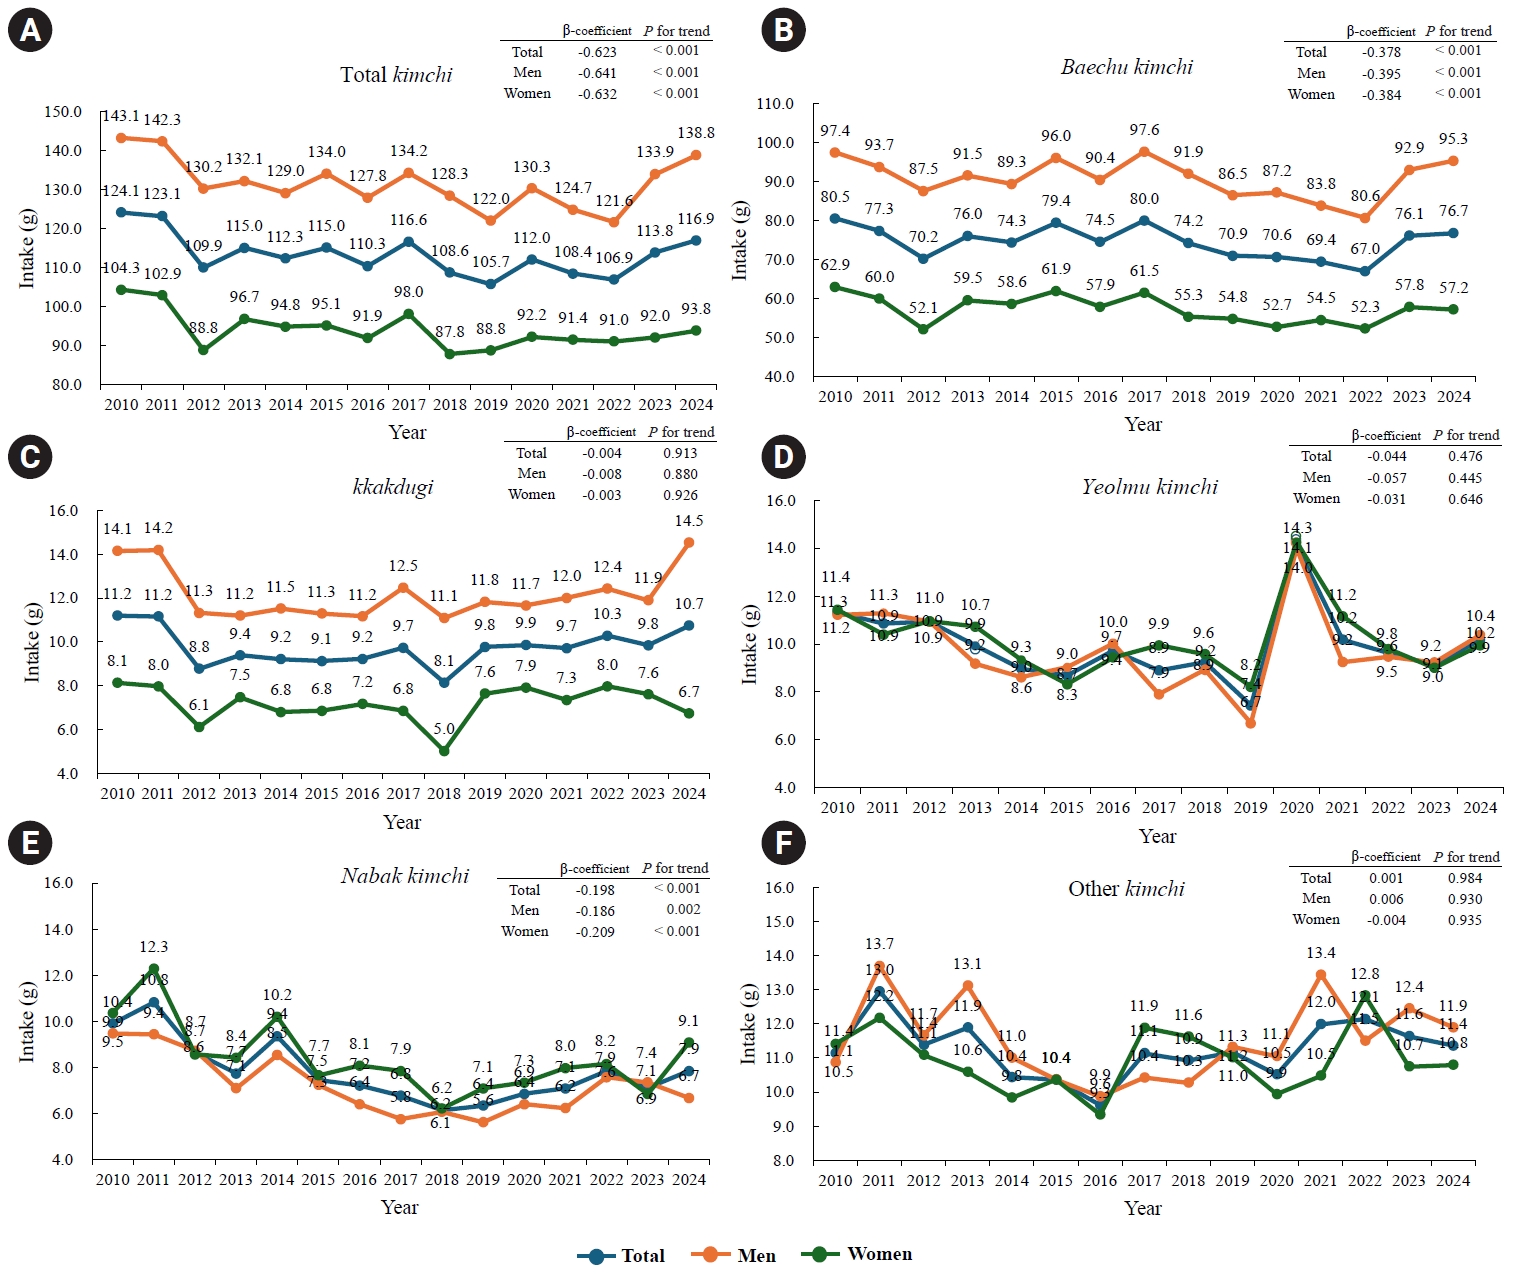
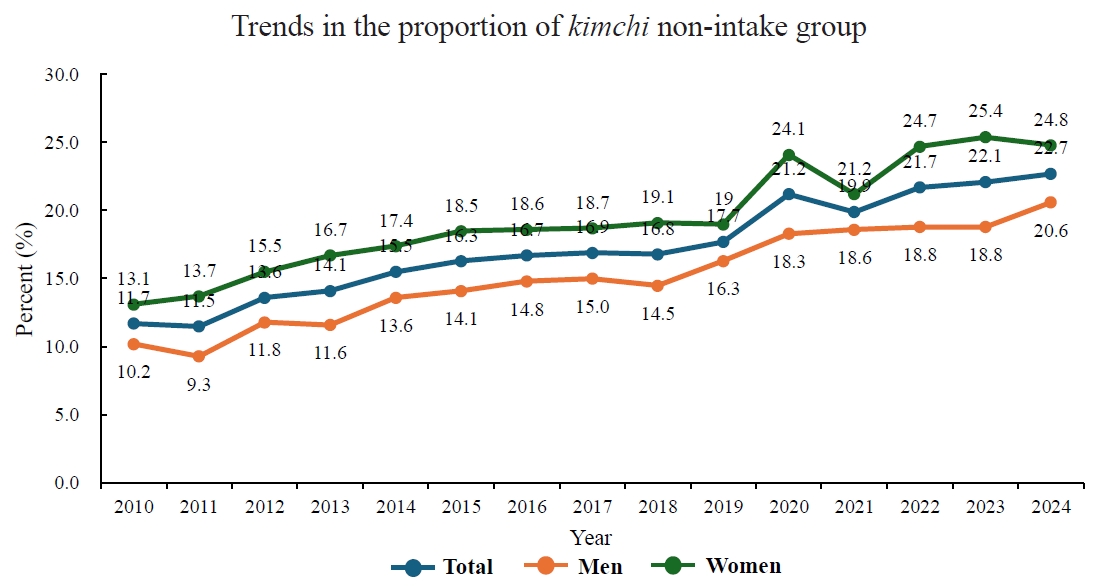
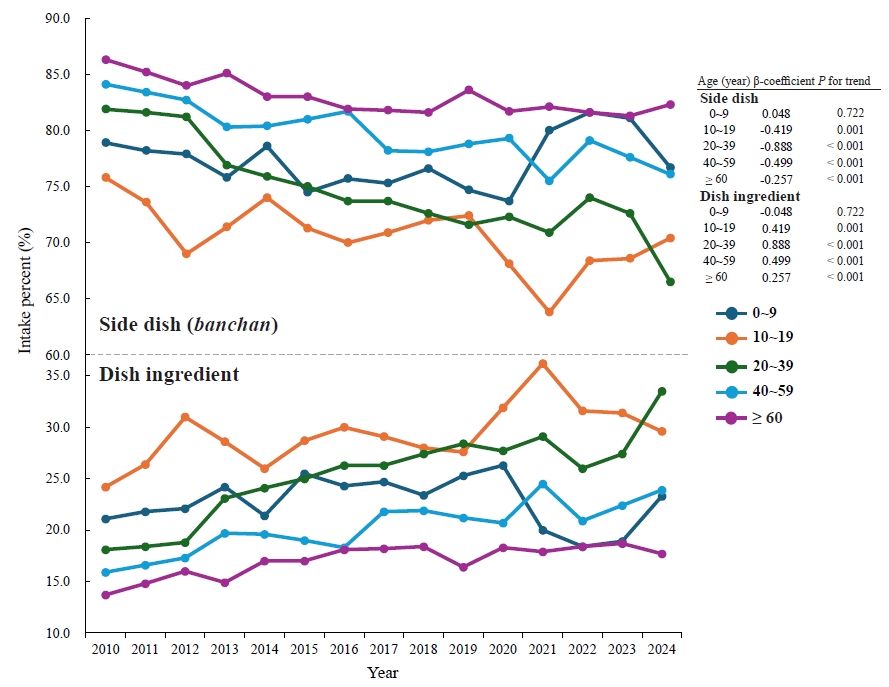
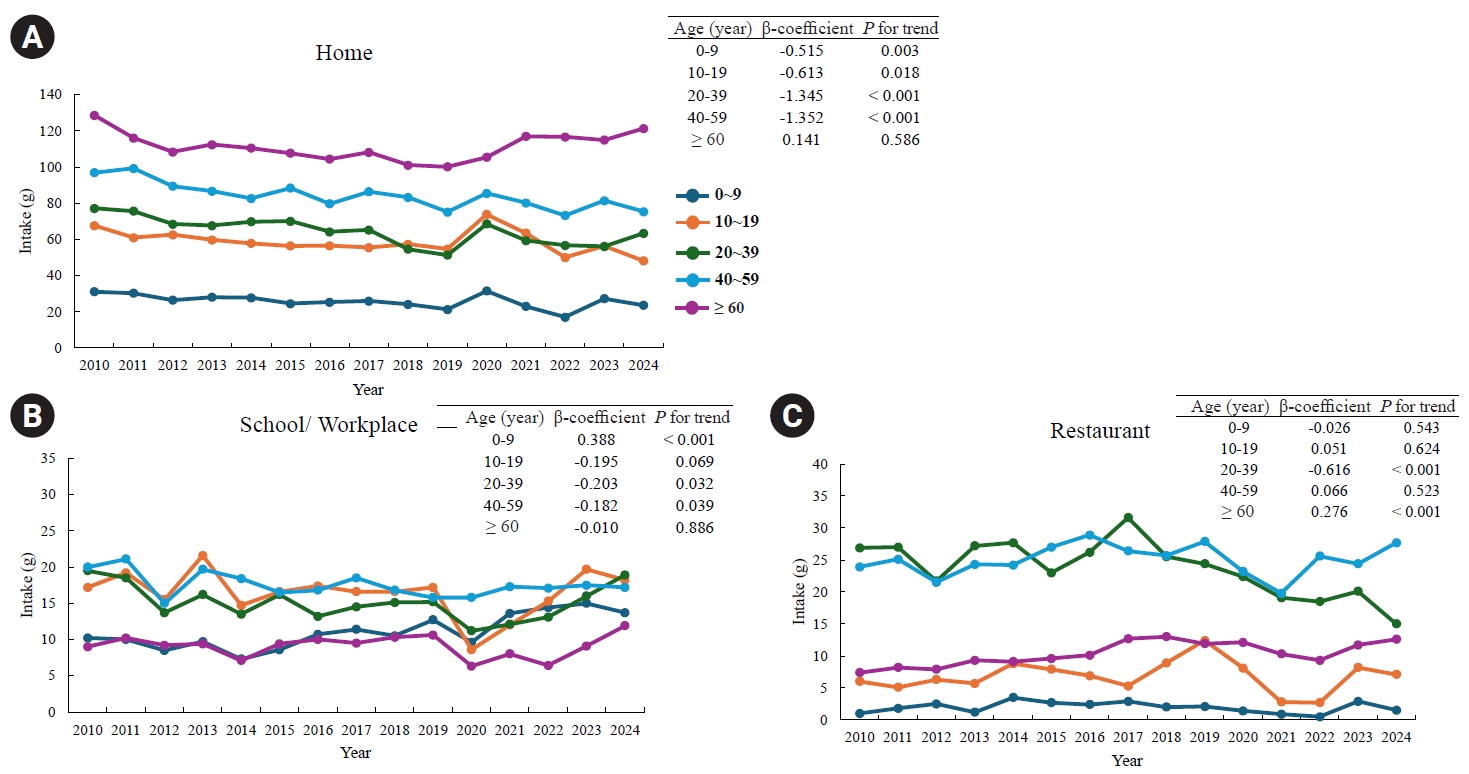
Fig. 1. Trends in kimchi consumption by gender among Korean adults, Korea National Health and Nutrition Examination Survey 2010–2024. The panels show the mean daily intake (g/day) of (A) total kimchi, (B) baechu kimchi, (C) kkakdugi, (D) yeolmu kimchi, (E) nabak kimchi, and (F) other kimchi. Values are presented as survey-weighted means. Blue lines indicate the total population, orange lines indicate men, and green lines indicate women. β-coefficients represent annual changes in intake estimated using survey-weighted linear regression (PROC SURVEYREG); P for trend values were obtained from the same models.
Fig. 2. Trends in kimchi consumption by gender among participants in the kimchi intake group, Korea National Health and Nutrition Examination Survey 2010–2024. The panels show the mean daily intake (g/day) of (A) total kimchi, (B) baechu kimchi, (C) kkakdugi, (D) yeolmu kimchi, (E) nabak kimchi, and (F) other kimchi. Values are presented as survey-weighted means. Blue lines indicate the total population, orange lines indicate men, and green lines indicate women. β-coefficients represent annual changes in intake estimated using survey-weighted linear regression (PROC SURVEYREG); P for trend values were obtained from the same models.
Fig. 3. Trends in the proportion of the kimchi non-intake group by gender among Korean adults, Korea National Health and Nutrition Examination Survey 2010–2024. Values are presented as survey-weighted percentages (%). Blue lines indicate the total population, orange lines indicate men, and green lines indicate women. The kimchi non-intake group was defined as participants reporting no kimchi consumption on the 24-hour dietary recall day.
Fig. 4. Age-specific trends in kimchi consumption patterns among Korean adults, Korea National Health and Nutrition Examination Survey 2010–2024. The panels show the proportion (%) of kimchi consumed as a side dish (upper panel) and kimchi consumed in dish ingredient (lower panel). Lines represent age groups (0–9, 10–19, 20–39, 40–59, and ≥ 60 years). Values are presented as survey-weighted percentages. β-coefficients represent annual changes in intake proportion estimated using survey-weighted linear regression (PROC SURVEYREG); P for trend values were obtained from the same models.
Fig. 5. Age-specific trends in kimchi consumption by meal location among Korean adults, Korea National Health and Nutrition Examination Survey 2010–2024. The panels show the mean daily intake (g/day) of kimchi consumed at home, school/workplace, and restaurants for each age group: (A) home, (B) school/workplace, and (C) restaurant. The values are presented as survey-weighted means. Lines represent age groups (0–9, 10–19, 20–39, 40–59, and ≥ 60 years). β-coefficients represent annual changes in intake estimated using survey-weighted linear regression (PROC SURVEYREG); P for trend values were obtained from the same models.
Fig. 1.
Fig. 2.
Fig. 3.
Fig. 4.
Fig. 5.
Changing patterns and related factors of kimchi consumption among Korean adults: a nationwide cross-sectional analysis of the Korea National Health and Nutrition Examination Survey, 2010–2024
| Characteristics | n | Total kimchi | Baechu kimchi | Kkakduki | Yeolmu kimchi | Nabak kimchi | Other kimchi |
|---|---|---|---|---|---|---|---|
| 1. Socioeconomic characteristics | |||||||
| Income level | |||||||
| Low | 2,920 | 116.92 ± 3.04 | 71.18 ± 2.38 | 7.08 ± 0.71 | 12.90 ± 1.16 | 14.18 ± 1.37 | 11.58 ± 1.07 |
| Lower-middle | 3,484 | 107.16 ± 2.76 | 66.21 ± 1.95 | 9.34 ± 0.62 | 11.46 ± 1.32 | 8.25 ± 0.83 | 11.90 ± 0.81 |
| Upper-middle | 3,783 | 99.81 ± 2.16 | 64.73 ± 1.68 | 9.03 ± 0.56 | 9.19 ± 0.83 | 6.62 ± 0.72 | 10.23 ± 0.64 |
| High | 4,008 | 95.57 ± 1.99 | 60.79 ± 1.55 | 10.33 ± 0.68 | 7.77 ± 0.71 | 5.43 ± 0.67 | 11.25 ± 0.90 |
| P-value | < 0.001 | < 0.001 | 0.004 | < 0.001 | < 0.001 | 0.567 | |
| Education level | |||||||
| Middle school | 4,146 | 124.68 ± 2.68 | 73.13 ± 2.06 | 8.23 ± 0.60 | 15.11 ± 1.17 | 14.73 ± 1.12 | 13.49 ± 0.89 |
| Graduate or below high school graduate | 4,230 | 107.96 ± 2.07 | 68.12 ± 1.57 | 9.82 ± 0.58 | 9.89 ± 0.82 | 7.56 ± 0.66 | 12.56 ± 0.88 |
| University graduate or above | 5,450 | 87.08 ± 1.56 | 57.55 ± 1.19 | 9.20 ± 0.45 | 6.62 ± 0.54 | 4.43 ± 0.54 | 9.28 ± 0.54 |
| P-value | < 0.001 | < 0.001 | 0.307 | < 0.001 | < 0.001 | < 0.001 | |
| Residential area | |||||||
| Urban | 11,042 | 98.06 ± 1.42 | 61.35 ± 1.05 | 9.04 ± 0.36 | 9.43 ± 0.65 | 7.48 ± 0.47 | 10.77 ± 0.52 |
| Rural | 3,202 | 125.51 ± 4.19 | 81.45 ± 3.43 | 9.95 ± 0.73 | 11.76 ± 1.24 | 9.24 ± 1.05 | 13.11 ± 1.10 |
| P-value | < 0.001 | < 0.001 | 0.265 | 0.096 | 0.127 | 0.057 | |
| 2. Dietary factors | |||||||
| Eating alone | |||||||
| None | 3,847 | 125.34 ± 2.56 | 72.68 ± 1.79 | 9.95 ± 0.62 | 14.21 ± 1.12 | 13.77 ± 1.14 | 14.73 ± 0.95 |
| 1/day | 4,895 | 97.3 ± 1.78 | 63.88 ± 1.38 | 9.60 ± 0.54 | 8.22 ± 0.60 | 5.65 ± 0.50 | 9.95 ± 0.64 |
| ≥ 2/day | 5,502 | 94.5 ± 1.85 | 61.04 ± 1.42 | 8.33 ± 0.47 | 8.73 ± 0.78 | 6.20 ± 0.53 | 10.2 ± 0.51 |
| P-value | < 0.001 | < 0.001 | 0.019 | < 0.001 | < 0.001 | < 0.001 | |
| Dining out frequency | |||||||
| ≥ 1/day | 2,250 | 99.55 ± 2.69 | 66.66 ± 1.96 | 12.18 ± 0.81 | 8.05 ± 1.22 | 4.51 ± 0.73 | 8.15 ± 0.70 |
| 1–6/week | 7,243 | 96.57 ± 1.53 | 62.11 ± 1.21 | 8.71 ± 0.42 | 8.63 ± 0.57 | 5.72 ± 0.44 | 11.4 ± 0.56 |
| 1–3/month | 3,220 | 114.18 ± 2.68 | 66.81 ± 2.01 | 8.68 ± 0.69 | 13.36 ± 1.11 | 12.43 ± 1.05 | 12.90 ± 0.90 |
| Scarcely | 1,531 | 125.58 ± 4.36 | 74.28 ± 3.28 | 6.50 ± 0.78 | 13.71 ± 1.63 | 18.20 ± 2.07 | 12.90 ± 1.24 |
| P-value | < 0.001 | 0.030 | < 0.001 | < 0.001 | < 0.001 | < 0.001 | |
| Meal frequency | |||||||
| 3/day | 9,935 | 113.66 ± 1.68 | 68.97 ± 1.28 | 9.63 ± 0.40 | 12.37 ± 0.81 | 9.70 ± 0.58 | 12.98 ± 0.61 |
| 1–2/day | 4,309 | 82.23 ± 1.73 | 57.05 ± 1.36 | 8.36 ± 0.52 | 4.98 ± 0.45 | 4.11 ± 0.50 | 7.73 ± 0.49 |
| P-value | < 0.001 | < 0.001 | 0.044 | < 0.001 | < 0.001 | < 0.001 | |
| 3. Health-related factors | |||||||
| Alcohol consumption | |||||||
| No | 7,164 | 98.15 ± 1.73 | 58.33 ± 1.33 | 8.14 ± 0.43 | 11.12 ± 0.72 | 8.95 ± 0.59 | 11.60 ± 0.56 |
| Yes | 6,821 | 106.17 ± 1.65 | 70.04 ± 1.27 | 10.06 ± 0.44 | 8.39 ± 0.55 | 6.76 ± 0.53 | 10.91 ± 0.61 |
| P-value | < 0.001 | < 0.001 | 0.001 | < 0.001 | 0.002 | 0.326 | |
| Smoking status | |||||||
| Never smoker | 8,578 | 89.67 ± 1.42 | 53.6 ± 1.07 | 7.60 ± 0.35 | 9.53 ± 0.58 | 7.99 ± 0.50 | 10.95 ± 0.55 |
| Past smoker | 3,443 | 120.68 ± 2.35 | 77.6 ± 1.88 | 11.64 ± 0.67 | 10.93 ± 0.90 | 8.15 ± 0.73 | 12.36 ± 0.72 |
| Current smoker | 1,952 | 116.87 ± 2.93 | 81.57 ± 2.32 | 10.61 ± 0.81 | 7.89 ± 0.88 | 6.38 ± 0.84 | 10.42 ± 0.85 |
| P-value | < 0.001 | < 0.001 | < 0.001 | 0.375 | 0.128 | 0.876 | |
| Physical activity | |||||||
| No | 7,608 | 105.87 ± 1.78 | 66.39 ± 1.33 | 8.87 ± 0.46 | 10.02 ± 0.63 | 8.63 ± 0.61 | 11.95 ± 0.61 |
| Yes | 5,528 | 97.59 ± 1.72 | 61.55 ± 1.30 | 9.24 ± 0.44 | 9.32 ± 0.68 | 6.70 ± 0.57 | 10.78 ± 0.61 |
| P-value | < 0.001 | 0.004 | 0.540 | 0.349 | 0.012 | 0.128 | |
| Obesity |
|||||||
| Underweight | 759 | 94.78 ± 4.95 | 56.29 ± 3.40 | 7.83 ± 1.10 | 11.37 ± 2.07 | 9.14 ± 1.94 | 10.15 ± 1.44 |
| Normal | 5,093 | 91.87 ± 1.68 | 57.58 ± 1.28 | 7.72 ± 0.48 | 9.66 ± 0.67 | 6.87 ± 0.58 | 10.04 ± 0.55 |
| Overweight | 3,280 | 106.72 ± 2.26 | 65.98 ± 1.74 | 10.21 ± 0.62 | 10.25 ± 0.88 | 8.35 ± 0.76 | 11.93 ± 0.75 |
| Obese | 5,112 | 111.91 ± 2.07 | 72.22 ± 1.57 | 10.14 ± 0.53 | 9.53 ± 0.87 | 8.10 ± 0.64 | 11.92 ± 0.81 |
| P-value | < 0.001 | < 0.001 | < 0.001 | 0.610 | 0.378 | 0.032 | |
| 4. Household factors | |||||||
| Marital status | |||||||
| Single | 3,692 | 95.54 ± 2.17 | 63.38 ± 1.75 | 7.39 ± 0.55 | 7.85 ± 0.65 | 6.81 ± 0.63 | 10.10 ± 0.73 |
| Married | 10,536 | 105.44 ± 1.53 | 65.42 ± 1.12 | 9.83 ± 0.40 | 10.5 ± 0.70 | 8.12 ± 0.51 | 11.56 ± 0.53 |
| P-value | < 0.001 | 0.270 | < 0.001 | 0.002 | 0.083 | 0.074 | |
| No. of household members | |||||||
| 1 | 2,407 | 107.15 ± 2.87 | 71.49 ± 2.13 | 9.25 ± 0.80 | 8.42 ± 0.78 | 6.96 ± 0.76 | 11.04 ± 0.96 |
| 2 | 5,594 | 111.48 ± 2.25 | 66.72 ± 1.55 | 8.76 ± 0.49 | 12.51 ± 0.9 | 11.16 ± 0.81 | 12.33 ± 0.7 |
| 3 | 3,278 | 96.86 ± 2.48 | 62.32 ± 1.88 | 8.99 ± 0.69 | 8.99 ± 0.79 | 5.76 ± 0.76 | 10.80 ± 0.84 |
| 4 | 2,340 | 93.35 ± 2.69 | 59.53 ± 1.93 | 10.44 ± 0.82 | 7.61 ± 1.29 | 4.92 ± 0.87 | 10.85 ± 1.13 |
| 5 | 489 | 98.8 ± 5.54 | 67.85 ± 4.36 | 7.27 ± 1.14 | 7.41 ± 1.61 | 9.34 ± 2.75 | 6.93 ± 2.14 |
| 6 | 136 | 96.72 ± 11.54 | 63.33 ± 6.69 | 11.77 ± 3.4 | 12.77 ± 7.01 | 3.53 ± 1.70 | 5.32 ± 1.69 |
| P-value | < 0.001 | < 0.001 | 0.386 | 0.042 | < 0.001 | 0.046 |
| Related factors | Total kimchi ≥ 40 g/day vs. < 40 g/day | |||
|---|---|---|---|---|
| 30–64 age group | ≥ 65 age group | |||
| n | OR (95% CI) | n | OR (95% CI) | |
| Gender | ||||
| Men | 3,797 | 1.00 | 2,206 | 1.00 |
| Women | 5,341 | 0.61 (0.56, 0.68) | 2,900 | 0.60 (0.52, 0.69) |
| BMI | ||||
| Low weight | 417 | 1.05 (0.84, 1.32) | 342 | 0.80 (0.60, 1.07) |
| Normal weight | 3,387 | 1.00 | 1,706 | 1.00 |
| Overweight | 1,987 | 1.19 (1.03, 1.37) | 1,293 | 1.03 (0.86, 1.24) |
| Obese | 3,347 | 1.22 (1.08, 1.36) | 1,765 | 1.10 (0.93, 1.29) |
| Education level | ||||
| Under middle school | 980 | 1.00 | 3,166 | 1.00 |
| High school | 3,158 | 0.88 (0.72, 1.06) | 1,072 | 1.04 (0.87, 1.25) |
| Beyond college | 4,883 | 0.83 (0.68, 1.01) | 567 | 0.77 (0.61, 0.97) |
| Household income | ||||
| Low | 687 | 1.00 | 2,233 | 1.00 |
| Middle-low | 1,986 | 1.22 (0.98, 1.53) | 1,498 | 1.06 (0.88, 1.26) |
| Middle-high | 2,919 | 1.16 (0.92, 1.45) | 864 | 0.93 (0.75, 1.14) |
| High | 3,518 | 1.10 (0.88, 1.36) | 490 | 0.86 (0.64, 1.15) |
| Alcohol consumption | ||||
| No | 3,885 | 1.00 | 3,279 | 1.00 |
| Yes | 5,170 | 1.30 (1.17, 1.44) | 1,651 | 1.29 (1.11, 1.49) |
| Smoking status | ||||
| Never smoker | 5,452 | 1.00 | 3,126 | 1.00 |
| Past smoker | 2,087 | 1.38 (1.22, 1.55) | 1,356 | 1.46 (1.24, 1.73) |
| Current smoker | 1,513 | 1.35 (1.18, 1.55) | 439 | 1.31 (1.00, 1.72) |
| Physical activity | ||||
| Inactive | 4,487 | 1.00 | 3,121 | 1.00 |
| Active | 4,063 | 0.95 (0.85, 1.05) | 1,465 | 1.02 (0.88, 1.19) |
| Residential area | ||||
| Urban | 7,505 | 1.00 | 3,537 | 1.00 |
| Rural | 1,633 | 1.28 (1.12, 1.46) | 1,569 | 1.28 (1.06, 1.54) |
| Marital status | ||||
| Single | 2,088 | 1.00 | 1,604 | 1.00 |
| Married | 7,043 | 0.99 (0.87, 1.11) | 3,493 | 1.38 (1.19, 1.62) |
| Eating alone | ||||
| None | 1,852 | 1.00 | 1,995 | 1.00 |
| 1/day | 3,854 | 0.78 (0.68, 0.90) | 1,041 | 0.90 (0.74, 1.08) |
| ≥ 2/day | 3,432 | 0.67 (0.58, 0.78) | 2,070 | 0.76 (0.65, 0.90) |
| Dining out frequency | ||||
| ≥ 1/day | 2,031 | 1.00 | 219 | 1.00 |
| 1–6/week | 5,397 | 0.84 (0.74, 0.94) | 1,846 | 0.85 (0.59, 1.22) |
| 1–3/month | 1,367 | 0.79 (0.67, 0.93) | 1,853 | 0.97 (0.68, 1.39) |
| Scarcely | 343 | 0.86 (0.64, 1.15) | 1,188 | 0.91 (0.63, 1.33) |
| Meal frequency | ||||
| 3/day | 5,630 | 1.00 | 4,305 | 1.00 |
| 1–2/day | 3,508 | 0.85 (0.76, 0.94) | 801 | 0.70 (0.59, 0.83) |
| Related factors | Total kimchi ≥ 40 g/day vs. < 40 g/day | |||||
|---|---|---|---|---|---|---|
| Total | Men | Women | ||||
| n | OR (95% CI) | n | OR (95% CI) | n | OR (95% CI) | |
| Age (year) | ||||||
| 30–64 | 9,138 | 1.00 | 3,797 | 1.00 | 5,341 | 1.00 |
| ≥ 65 | 5,106 | 1.52 (1.39, 1.66) | 2,206 | 1.57 (1.36, 1.82) | 2,900 | 1.50 (1.35, 1.66) |
| BMI | ||||||
| Low weight | 759 | 0.93 (0.78, 1.10) | 213 | 1.10 (0.74, 1.60) | 546 | 0.87 (0.71, 1.07) |
| Normal weight | 5,093 | 1.00 | 1,690 | 1.00 | 3,403 | 1.00 |
| Overweight | 3,280 | 1.07 (0.96, 1.20) | 1,564 | 1.09 (0.90, 1.31) | 1,716 | 1.10 (0.95, 1.27) |
| Obese | 5,112 | 1.09 (0.99, 1.20) | 2,536 | 1.18 (1.00, 1.39) | 2,576 | 1.08 (0.95, 1.22) |
| Education level | ||||||
| Under middle school | 4,146 | 1.00 | 1,428 | 1.00 | 2,718 | 1.00 |
| High school | 4,230 | 1.04 (0.92, 1.18) | 1,816 | 1.22 (0.99, 1.52) | 2,414 | 0.88 (0.75, 1.04) |
| Beyond college | 5,450 | 0.88 (0.77, 1.02) | 2,596 | 1.00 (0.80, 1.24) | 2,854 | 0.75 (0.63, 0.90) |
| Household income | ||||||
| Low | 2,920 | 1.00 | 1,072 | 1.00 | 1,848 | 1.00 |
| Middle-low | 3,484 | 1.26 (1.11, 1.44) | 1,396 | 1.41 (1.12, 1.79) | 2,088 | 1.16 (0.99, 1.36) |
| Middle-high | 3,783 | 1.19 (1.03, 1.37) | 1,673 | 1.41 (1.12, 1.78) | 2,110 | 1.05 (0.88, 1.24) |
| High | 4,008 | 1.14 (0.98, 1.32) | 1,848 | 1.36 (1.08, 1.70) | 2,160 | 0.99 (0.83, 1.18) |
| Alcohol consumption | ||||||
| No | 7,164 | 1.00 | 2,092 | 1.00 | 5,072 | 1.00 |
| Yes | 6,821 | 1.20 (1.10, 1.31) | 3,821 | 1.03 (1.02, 1.03) | 3,000 | 1.04 (0.94, 1.15) |
| Smoking status | ||||||
| Never smoker | 8,578 | 1.00 | 1,325 | 1.00 | 7,253 | 1.00 |
| Past smoker | 3,443 | 1.08 (0.95, 1.22) | 2,922 | 1.10 (0.93, 1.30) | 521 | 1.01 (0.82, 1.24) |
| Current smoker | 1,952 | 1.06 (0.92, 1.23) | 1,656 | 1.12 (0.94, 1.35) | 296 | 0.90 (0.69, 1.17) |
| Physical activity | ||||||
| Inactive | 7,608 | 1.00 | 3,076 | 1.00 | 4,532 | 1.00 |
| Active | 5,528 | 0.96 (0.88, 1.05) | 2,435 | 1.06 (0.92, 1.23) | 3,093 | 0.89 (0.80, 0.99) |
| Residential area | ||||||
| Urban | 11,042 | 1.00 | 4,595 | 1.00 | 6,447 | 1.00 |
| Rural | 3,202 | 1.24 (1.09, 1.40) | 1,408 | 1.25 (1.05, 1.50) | 1,794 | 1.23 (1.07, 1.41) |
| Marital status | ||||||
| Single | 3,692 | 1.00 | 1,225 | 1.00 | 2,467 | 1.00 |
| Married | 10,536 | 1.16 (1.06, 1.27) | 4,772 | 1.02 (0.87, 1.21) | 5,764 | 1.21 (1.08, 1.35) |
| Eating alone | ||||||
| None | 3,847 | 1.00 | 1,887 | 1.00 | 1,960 | 1.00 |
| 1/day | 4,895 | 0.83 (0.74, 0.92) | 2,313 | 0.79 (0.66, 0.94) | 2,582 | 0.88 (0.76, 1.02) |
| ≥ 2/day | 5,502 | 0.73 (0.65, 0.82) | 1,803 | 0.79 (0.66, 0.95) | 3,699 | 0.71 (0.62, 0.81) |
| Dining out frequency | ||||||
| ≥ 1/day | 2,250 | 1.00 | 1,435 | 1.00 | 815 | 1.00 |
| 1–6/week | 7,243 | 0.93 (0.83, 1.04) | 3,005 | 0.89 (0.76, 1.04) | 4,238 | 0.98 (0.83, 1.17) |
| 1–3/month | 3,220 | 0.96 (0.83, 1.10) | 1,110 | 0.74 (0.59, 0.94) | 2,110 | 1.14 (0.95, 1.37) |
| Scarcely | 1,531 | 0.87 (0.73, 1.05) | 453 | 0.65 (0.48, 0.89) | 1,078 | 1.10 (0.87, 1.39) |
| Meal frequency | ||||||
| 3/day | 9,935 | 1.00 | 4,166 | 1.00 | 5,769 | 1.00 |
| 1–2/day | 4,309 | 0.77 (0.70, 0.84) | 1,837 | 0.73 (0.63, 0.85) | 2,472 | 0.81 (0.72, 0.90) |
| Related factors | Total kimchi ≥ 40 g/day vs. < 40 g/day | |||
|---|---|---|---|---|
| 30–64 age group | ≥ 65 age group | |||
| n | OR (95% CI) | n | OR (95% CI) | |
| Gender | ||||
| Men | 3,797 | 1.00 | 2,206 | 1.00 |
| Women | 5,341 | 0.64 (0.56, 0.73) | 2,900 | 0.60 (0.47, 0.76) |
| BMI | ||||
| Low weight | 417 | 1.11 (0.87, 1.41) | 342 | 0.73 (0.54, 0.99) |
| Normal weight | 3,387 | 1.00 | 1,706 | 1.00 |
| Overweight | 1,987 | 1.11 (0.96, 1.29) | 1,293 | 0.99 (0.82, 1.20) |
| Obese | 3,347 | 1.12 (1.00, 1.26) | 1,765 | 1.04 (0.87, 1.24) |
| Education level | ||||
| Under middle school | 980 | 1.00 | 3,166 | 1.00 |
| High school | 3,158 | 0.87 (0.71, 1.07) | 1,072 | 0.99 (0.81, 1.21) |
| Beyond college | 4,883 | 0.83 (0.68, 1.03) | 567 | 0.77 (0.59, 1.00) |
| Household income | ||||
| Low | 687 | 1.00 | 2,233 | 1.00 |
| Middle-low | 1,986 | 1.25 (0.99, 1.58) | 1,498 | 0.96 (0.79, 1.15) |
| Middle-high | 2,919 | 1.18 (0.93, 1.50) | 864 | 0.87 (0.68, 1.12) |
| High | 3,518 | 1.16 (0.92, 1.47) | 490 | 0.79 (0.56, 1.44) |
| Alcohol consumption | ||||
| No | 3,885 | 1.00 | 3,279 | 1.00 |
| Yes | 5,170 | 1.23 (1.10, 1.37) | 1,651 | 1.22 (1.03, 1.45) |
| Smoking status | ||||
| Never smoker | 5,452 | 1.00 | 3,126 | 1.00 |
| Past smoker | 2,087 | 1.33 (1.16, 1.51) | 1,356 | 1.38 (1.14, 1.67) |
| Current smoker | 1,513 | 1.23 (1.06, 1.42) | 439 | 1.20 (0.88, 1.62) |
| Physical activity | ||||
| Inactive | 4,487 | 1.00 | 3,121 | 1.00 |
| Active | 4,063 | 0.96 (0.86, 1.07) | 1,465 | 1.05 (0.90, 1.22) |
| Residential area | ||||
| Urban | 7,505 | 1.00 | 3,537 | 1.00 |
| Rural | 1,633 | 1.29 (1.12, 1.50) | 1,569 | 1.36 (1.11, 1.66) |
| Marital status | ||||
| Single | 2,088 | 1.00 | 1,604 | 1.00 |
| Married | 7,043 | 0.98 (0.84, 1.14) | 3,493 | 1.32 (1.02, 1.69) |
| Eating alone | ||||
| None | 1,852 | 1.00 | 1,995 | 1.00 |
| 1/day | 3,854 | 0.77 (0.67, 0.89) | 1,041 | 0.97 (0.80, 1.19) |
| ≥ 2/day | 3,432 | 0.69 (0.59, 0.80) | 2,070 | 0.85 (0.69, 1.05) |
| Dining out frequency | ||||
| ≥ 1/day | 2,031 | 1.00 | 219 | 1.00 |
| 1–6/week | 5,397 | 0.86 (0.75, 0.97) | 1,846 | 0.85 (0.58, 1.25) |
| 1–3/month | 1,367 | 0.88, 0.73, 1.06) | 1,853 | 0.93 (0.63, 1.35) |
| Scarcely | 343 | 0.85 (0.62, 1.17) | 1,188 | 0.91 (0.61, 1.37) |
| Meal frequency | ||||
| 3/day | 5,630 | 1.00 | 4,305 | 1.00 |
| 1–2/day | 3,508 | 0.81 (0.72, 0.90) | 801 | 0.68 (0.56, 0.82) |
| Related factors | Total kimchi ≥ 40 g/day vs. < 40 g/day | |||||
|---|---|---|---|---|---|---|
| Total | Men | Women | ||||
| n | OR (95% CI) | n | OR (95% CI) | n | OR (95% CI) | |
| Age (year) | ||||||
| 30–64 | 9,138 | 1.00 | 3,797 | 1.00 | 5,341 | 1.00 |
| ≥ 65 | 5,106 | 1.33 (1.18, 1.51) | 2,206 | 1.42 (1.18, 1.71) | 2,900 | 1.09 (0.93, 1.28) |
| BMI | ||||||
| Low weight | 759 | 0.93 (0.78, 1.12) | 213 | 1.10 (0.73, 1.68) | 546 | 0.89 (0.72, 1.11) |
| Normal weight | 5,093 | 1.00 | 1,690 | 1.00 | 3,403 | 1.00 |
| Overweight | 3,280 | 1.09 (0.96, 1.22) | 1,564 | 1.03 (0.85, 1.24) | 1,716 | 1.07 (0.92, 1.24) |
| Obese | 5,112 | 1.10 (1.00, 1.21) | 2,536 | 1.09 (0.92, 1.29) | 2,576 | 1.03 (0.90, 1.17) |
| Education level | ||||||
| Under middle school | 4,146 | 1.00 | 1,428 | 1.00 | 2,718 | 1.00 |
| High school | 4,230 | 1.01 (0.88, 1.16) | 1,816 | 1.13 (0.89, 1.42) | 2,414 | 0.88 (0.74, 1.05) |
| Beyond college | 5,450 | 0.90 (0.77, 1.05) | 2,596 | 0.91 (0.71, 1.16) | 2,854 | 0.76 (0.63, 0.91) |
| Household income | ||||||
| Low | 2,920 | 1.00 | 1,072 | 1.00 | 1,848 | 1.00 |
| Middle-low | 3,484 | 1.17 (1.02, 1.36) | 1,396 | 1.33 (1.03, 1.73) | 2,088 | 1.07 (0.90, 1.26) |
| Middle-high | 3,783 | 1.13 (0.96, 1.32) | 1,673 | 1.35 (1.04, 1.76) | 2,110 | 0.98 (0.82, 1.19) |
| High | 4,008 | 1.12 (0.95, 1.32) | 1,848 | 1.34 (1.03, 1.75) | 2,160 | 0.95 (0.79, 1.15) |
| Alcohol consumption | ||||||
| No | 7,164 | 1.00 | 2,092 | 1.00 | 5,072 | 1.00 |
| Yes | 6,821 | 1.24 (1.13, 1.35) | 3,821 | 1.43 (1.23, 1.65) | 3,000 | 1.03 (0.93, 1.15) |
| Smoking status | ||||||
| Never smoker | 8,578 | 1.00 | 1,325 | 1.00 | 7,253 | 1.00 |
| Past smoker | 3,443 | 1.33 (1.19, 1.48) | 2,922 | 1.02 (0.85, 1.22) | 521 | 1.01 (0.81, 1.25) |
| Current smoker | 1,952 | 1.25 (1.09, 1.40) | 1,656 | 0.97 (0.80, 1.18) | 296 | 0.84 (0.64, 1.10) |
| Physical activity | ||||||
| Inactive | 7,608 | 1.00 | 3,076 | 1.00 | 4,532 | 1.00 |
| Active | 5,528 | 0.99 (0.90, 1.08) | 2,435 | 1.08 (0.93, 1.25) | 3,093 | 0.89 (0.80, 1.00) |
| Residential area | ||||||
| Urban | 11,042 | 1.00 | 4,595 | 1.00 | 6,447 | 1.00 |
| Rural | 3,202 | 1.32 (1.15, 1.50) | 1,408 | 1.38 (1.12, 1.69) | 1,794 | 1.24 (1.07, 1.44) |
| Marital status | ||||||
| Single | 3,692 | 1.00 | 1,225 | 1.00 | 2,467 | 1.00 |
| Married | 10,536 | 1.12 (1.00, 1.27) | 4,772 | 0.95 (0.76, 1.18) | 5,764 | 1.21 (1.06, 1.40) |
| Eating alone | ||||||
| None | 3,847 | 1.00 | 1,887 | 1.00 | 1,960 | 1.00 |
| 1/day | 4,895 | 0.83 (0.74, 0.93) | 2,313 | 0.77 (0.64, 0.92) | 2,582 | 0.93 (0.79, 1.08) |
| ≥ 2/day | 5,502 | 0.73 (0.64, 0.83) | 1,803 | 0.80 (0.65, 0.98) | 3,699 | 0.76 (0.65, 0.88) |
| Dining out frequency | ||||||
| ≥ 1/day | 2,250 | 1.00 | 1,435 | 1.00 | 815 | 1.00 |
| 1–6/week | 7,243 | 0.87 (0.77, 0.98) | 3,005 | 0.89 (0.75, 1.06) | 4,238 | 0.96 (0.80, 1.16) |
| 1–3/month | 3,220 | 0.90 (0.77, 1.05) | 1,110 | 0.79 (0.60, 1.02) | 2,110 | 1.11 (0.91, 1.37) |
| Scarcely | 1,531 | 0.84 (0.69, 1.03) | 453 | 0.65 (0.47, 0.92) | 1,078 | 1.09 (0.84, 1.41) |
| Meal frequency | ||||||
| 3/day | 9,935 | 1.00 | 4,166 | 1.00 | 5,769 | 1.00 |
| 1–2/day | 4,309 | 0.78 (0.71, 0.85) | 1,837 | 0.70 (0.60, 0.82) | 2,472 | 0.83 (0.74, 0.93) |
Table 1. Kimchi consumption according to general factors
Values are presented as weighted means ± standard errors (SE) for continuous variables and weighted percentages for categorical variables, accounting for the complex sampling design. Integrated weights for the period of 2022–2024 were applied. The numbers of missing values were as follows: education level (n = 418), household income (n = 49), alcohol consumption (n = 259), smoking status (n = 271), physical activity (n = 1,108), and marital status (n = 16). Obesity: Underweight (BMI < 18.5 kg/m2), normal (18.5 kg/m2 < BMI ≤ 23 kg/m2), overweight (23 kg/m2 < BMI ≤ 25 kg/m2), obese (≥ 25 kg/m2).
Table 2. Age-specific analysis of sociodemographic and health behavior factors associated with kimchi intake from 2022 to 2024
Numbers of missing values were as follows: education level (n = 418), household income (n = 49), alcohol consumption (n = 259), smoking status (n = 271), physical activity (n = 1,108), and marital status (n = 16). Adjusting for age (continuous), total energy intake (continuous), and total food intake (continuous). OR, odds ratio; CI, confidence interval; BMI, body mass index.
Table 3. Gender-specific analysis of sociodemographic and health behavior factors associated with kimchi intake from 2022 to 2024
Numbers of missing values were as follows: education level (n = 418), household income (n = 49), alcohol consumption (n = 259), smoking status (n = 271), physical activity (n = 1,108), and marital status (n = 16). Adjusted for age (continuous), total energy intake (continuous), and total food intake (continuous). OR, odds ratio; CI, confidence interval, BMI, body mass index.
Table 4. Multivariable-adjusted age-specific analysis of sociodemographic and health behavior factors associated with kimchi intake from 2022 to 2024
The number of missing values were as follows: education level (n = 418), household income (n = 49), alcohol consumption (n = 259), smoking status (n = 271), physical activity (n = 1,108), and marital status (n = 16). Adjusting for age (continuous), total energy intake (continuous), total food intake (continuous), education level, household income, residential area, household composition (single-person household), smoking status, alcohol consumption, and physical activity. OR, odds ratio; CI, confidence interval, BMI, body mass index.
Table 5. Multivariable-adjusted gender-specific analysis of sociodemographic and health behavior factors associated with kimchi intake from 2022 to 2024
The number of missing values were as follows: education level (n = 418), household income (n = 49), alcohol consumption (n = 259), smoking status (n = 271), physical activity (n = 1,108), and marital status (n = 16). Adjusting for age (continuous), total energy intake (continuous), total food intake (continuous), education level, household income, residential area, household composition (single-person household), smoking status, alcohol consumption, and physical activity. OR, odds ratio; CI, confidence interval, BMI, body mass index.



