
 KSCN
KSCN
Articles
- Page Path
- HOME > Korean J Community Nutr > Volume 31(3); 2026 > Article
-
Research Article
지역사회 거주 노인 대상 사회인지이론의 구성요소와 범이론적 모델 기반 상담을 반영한 지역사회 영양중재의 효과: 비동등성 대조군 전후 설계 연구 -
신혜원1),2)
 , 이승민3),†
 - Effect of a community-based nutrition intervention incorporating social cognitive theory constructs and transtheoretical model-based counseling among community-dwelling elderly in Korea: a quasi-experimental study
-
Hyewon Shin1),2), Seungmin Lee3),†
-
Korean Journal of Community Nutrition 2026;31(3):264-275.
DOI: https://doi.org/10.5720/kjcn.2026.00073
Published online: June 30, 2026
1)성신여자대학교 일반대학원 식품영양학과 박사
2)가천대학교 식품영양학과 연구교수
3)성신여자대학교 식품영양학과 교수
1)Ph. D., Department of Food and Nutrition, Graduate School, Sungshin Women’s University, Seoul, Korea
2)Research Professor, Department of Food and Nutrition, Gachon University, Seongnam, Korea
3)Professor, Department of Food and Nutrition, Sungshin Women’s University, Seoul, Korea
- †Corresponding author: Seungmin Lee Department of Food and Nutrition, Sungshin Women’s University, 55 Dobong-ro 76-gil, Gangbuk-gu, Seoul 01133, Korea Tel: +82-2-920-7671 Fax: +82-2-920-2076 Email: smlee@sungshin.ac.kr
• Received: February 10, 2026 • Revised: April 1, 2026 • Accepted: May 12, 2026
© 2026 The Korean Society of Community Nutrition
This is an Open-Access article distributed under the terms of the Creative Commons Attribution Non-Commercial License (https://creativecommons.org/licenses/by-nc/4.0) which permits unrestricted non-commercial use, distribution, and reproduction in any medium, provided the original work is properly cited.
- 397 Views
- 20 Download


Abstract
-
Objectives
- This study evaluated the effects of a 7-week nutrition intervention based on the personal and environmental constructs of social cognitive theory (SCT) and the transtheoretical model (TTM) on dietary behavior-related factors, dietary behavior outcomes, and stages of dietary behavior change among community-dwelling older adults.
-
Methods
- A quasi-experimental nonequivalent control group pretest–posttest design was conducted from May to December 2024 at seven senior facilities in Seoul and Gyeonggi, Korea. Older adults aged ≥ 65 years were assigned by facility to either an intervention group (n = 66; four facilities) or a control group (n = 65; three facilities). The intervention group completed a 7-week program consisting of baseline assessment, five weekly group education sessions, individualized nutrition counseling, and post-intervention assessment. The control group received one general nutrition education session. Outcomes included dietary knowledge, outcome expectations, value expectations, self-efficacy, environmental factors (food accessibility and household food availability and social support), dietary behavior outcomes assessed using the Nutrition Quotient for the Elderly (NQ-E), and stage of change. Program effects were analyzed using ANCOVA adjusted for age, family composition, education, baseline dietary knowledge, and value expectations.
-
Results
- Compared with the control group, the intervention group demonstrated significantly greater improvements in dietary knowledge (P < 0.001), outcome expectations (P = 0.018), self-efficacy (P < 0.001), environmental factors (P < 0.001), and NQ-E total score (P = 0.011). No significant between-group difference was observed for value expectations. The proportion of participants in the action stage increased from 9.1% to 93.9% in the intervention group, and post-intervention stage distribution differed significantly between groups (P < 0.001). Program satisfaction was high (4.69 ± 0.41).
-
Conclusion
- A 7-week nutrition intervention incorporating SCT-based personal and environmental constructs and TTM-based stage-matched counseling improved dietary behavior-related factors, dietary behavior outcomes, and stage distribution among community-dwelling older adults.
INTRODUCTION
METHODS
1) 사회인지이론의 개인적·환경적 요인
2) 행동변화단계
3) 식행동 결과 지표
RESULTS
DISCUSSION
-
CONFLICT OF INTEREST
There are no financial or other issues that might lead to conflict of interest.
-
FUNDING
This study was supported by the Pulmuone Foundation.
-
DATA AVAILABILITY
The data that support the findings of this study are available from the corresponding author upon reasonable request.
NOTES
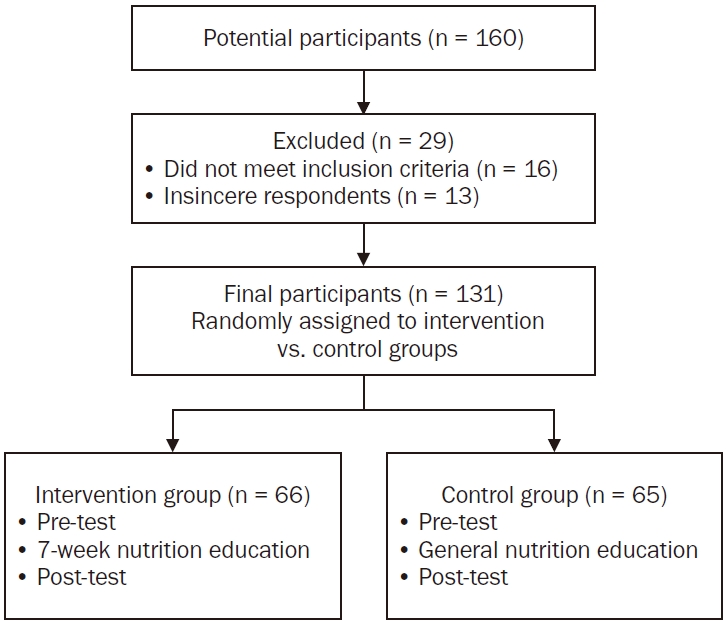
Fig. 2.Changes in stages of dietary behavior change before and after the intervention in the intervention (n = 66) and control groups (n = 65). Behavioral stages were reclassified into three categories: precontemplation/contemplation (C), preparation (P), and action (A). The figure presents the distributional change in behavioral stages before and after the intervention in each group. Within-group pre–post changes in stage distribution were examined using cross-tabulation, and the McNemar-Bowker test was applied when the reclassified distribution formed a square table. Between-group differences in post-intervention stage distribution were compared using the chi‑square test, and the consistency of the result was additionally confirmed using the Fisher-Freeman-Halton exact test.
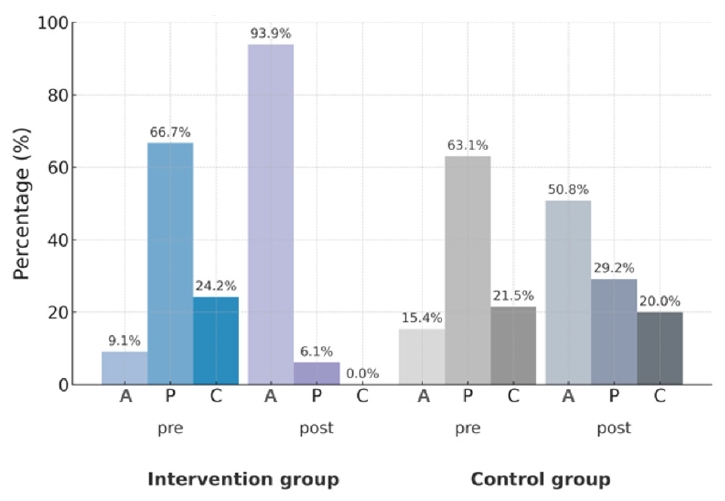
Table 1.Homogeneity test for general characteristics of participants (n = 131)
Table 2.Changes in cognitive factors related to dietary behavior after the nutrition intervention
| Variables/group | Pre | Post | Adjusted change ([post–pre] ± SE1)) | P-value2) |
|---|---|---|---|---|
| Dietary knowledge total score | < 0.001 | |||
| Intervention (n = 66) | 10.03 ± 1.99 | 12.67 ± 1.24 | 2.80 ± 0.19 | |
| Control (n = 65) | 9.11 ± 2.13 | 10.14 ± 2.01 | 0.87 ± 0.19 | |
| Outcome expectation total score | 0.018 | |||
| Intervention (n = 66) | 20.68 ± 2.61 | 21.86 ± 2.49 | 1.54 ± 0.39 | |
| Control (n = 65) | 20.09 ± 2.65 | 20.60 ± 2.36 | 0.14 ± 0.39 | |
| Value expectation total score | 0.194 | |||
| Intervention (n = 66) | 22.45 ± 2.16 | 22.59 ± 2.31 | 0.66 ± 0.30 | |
| Control (n = 65) | 21.05 ± 2.26 | 21.63 ± 2.53 | 0.06 ± 0.31 | |
| Self-efficacy total score | < 0.001 | |||
| Intervention (n = 66) | 22.12 ± 2.60 | 24.33 ± 2.75 | 2.33 ± 0.36 | |
| Control (n = 65) | 22.42 ± 2.97 | 22.86 ± 2.81 | 0.33 ± 0.36 |
Mean ± SD.
Dietary knowledge scores ranged from 0 to 14, with 1 point assigned for each correct response. Outcome and value expectations ranged from 5 to 25, and self-efficacy ranged from 6 to 30. Higher scores indicate greater dietary knowledge, more positive expectations, and higher self-efficacy.
SE, standard error.
1)Adjusted mean differences (post–pre) were estimated using analysis of covariance (ANCOVA), adjusted for age, family type, education level, baseline dietary knowledge, and baseline value expectations.
2)P-values indicate differences between the intervention and control groups after adjustment.
Table 3.Changes in environmental factors related to dietary behavior after the nutrition intervention
| Variables/group | Pre | Post | Adjusted change ([post–pre] ± SE1)) | P-value2) |
|---|---|---|---|---|
| Food accessibility/availability | 0.006 | |||
| Intervention (n = 66) | 14.47 ± 2.30 | 15.61 ± 1.88 | 1.29 ± 0.23 | |
| Control (n = 65) | 13.88 ± 2.36 | 14.35 ± 2.39 | 0.33 ± 0.23 | |
| Social support | 0.011 | |||
| Intervention (n = 66) | 6.56 ± 1.22 | 7.26 ± 1.32 | 0.71 ± 0.17 | |
| Control (n = 65) | 6.60 ± 1.47 | 6.68 ± 1.29 | 0.06 ± 0.17 | |
| Environmental factors total score | < 0.001 | |||
| Intervention (n = 66) | 21.03 ± 2.88 | 22.86 ± 2.60 | 2.00 ± 0.28 | |
| Control (n = 65) | 20.48 ± 2.91 | 21.03 ± 3.03 | 0.39 ± 0.29 |
Mean ± SD.
Food accessibility/availability scores ranged from 4 to 20, social support scores ranged from 2 to 10, and total environmental factor scores ranged from 6 to 30. Higher scores indicate more favorable environmental conditions.
SE, standard error.
1)Adjusted mean differences (post–pre) were estimated using analysis of covariance (ANCOVA), adjusted for age, family type, education level, baseline dietary knowledge, and baseline value expectations.
2)P-values indicate differences between the intervention and control groups after adjustment.
Table 4.Changes in NQ-E index by subdomains after the nutrition intervention
| Variables/group | Pre | Post | Adjusted change ([post–pre] ± SE1)) | P-value2) |
|---|---|---|---|---|
| Balance domain | 0.013 | |||
| Intervention (n = 66) | 60.51 ± 13.47 | 65.78 ± 13.68 | 5.68 ± 1.89 | |
| Control (n = 65) | 61.00 ± 15.98 | 59.87 ± 17.01 | –1.54 ± 1.91 | |
| Moderation domain | 0.412 | |||
| Intervention (n = 66) | 65.96 ± 31.18 | 74.76 ± 28.06 | 5.44 ± 3.57 | |
| Control (n = 65) | 59.64 ± 30.99 | 66.12 ± 30.37 | 9.89 ± 3.60 | |
| Practice domain | 0.047 | |||
| Intervention (n = 66) | 66.61 ± 12.54 | 71.15 ± 12.54 | 4.53 ± 1.24 | |
| Control (n=65) | 65.32 ± 13.94 | 66.08 ± 13.39 | 0.77 ± 1.25 | |
| NQ-E total score | 0.011 | |||
| Intervention (n = 66) | 63.18 ± 10.58 | 68.54 ± 10.53 | 5.25 ± 1.24 | |
| Control (n = 65) | 62.37 ± 12.27 | 62.66 ± 12.12 | 0.40 ± 1.25 |
Mean ± SD.
NQ-E domain and total scores were calculated using the official scoring system and converted to a 0–100 scale. Higher scores indicate more favorable dietary behavior outcomes.
NQ-E, Nutrition Quotient for the Elderly; SE, standard error.
1)Adjusted mean differences (post–pre) were estimated using analysis of covariance (ANCOVA), adjusted for age, family type, education level, baseline dietary knowledge, and baseline value expectations.
2)P-values indicate differences between the intervention and control groups after adjustment.
Table 5.Comparison of pre-program interest and post-program perceived helpfulness (n = 66)
| Topics | Pre-program interest | Post-program helpfulness | P-value1) |
|---|---|---|---|
| Individual nutrition counseling | 4.15 ± 0.68 | 4.64 ± 0.48 | 0.001 |
| Meal planning for regular and balanced diets | 4.08 ± 0.77 | 4.45 ± 0.56 | 0.001 |
| Prevention and management of chewing and swallowing difficulties | 3.95 ± 0.79 | 4.29 ± 0.65 | 0.001 |
| Safe food purchasing and storage practices | 4.24 ± 0.66 | 4.48 ± 0.56 | 0.015 |
| Selection of foods beneficial for health | 4.36 ± 0.60 | 4.52 ± 0.53 | 0.105 |
- 1. Chen QF, Ni C, Jiang Y, Chen L, Liao H, Gao J, et al. Global burden of disease and its risk factors for adults aged 70 and older across 204 countries and territories: a comprehensive analysis of the Global Burden of Disease Study 2021. BMC Geriatr 2025; 25(1): 462.ArticlePubMedPMCPDF
- 2. World Health Organization (WHO). World health statistics 2025. WHO; 2025.
- 3. The Lancet Regional Health-Western Pacific. South Korea’s population shift: challenges and opportunities. Lancet Reg Health West Pac 2023; 36: 100865.ArticlePubMedPMC
- 4. Kang EN, Kim HS, Jung CH, Kim SJ, Lee SH, Joo BH, et al. 2023 National survey of older Koreans. Ministry of Health and Welfare, Korea Institute for Health and Social Affairs; 2023 Nov. Report No. 2023-84.
- 5. Kim SK, Yun HJ, Shin HR, Kim YS. Association between chronic diseases and health-related quality of life among the elderly for elderly welfare: focusing on the moderating effect of nutrition labeling utilization. Proceedings of the 2019 Spring Conference of the Korean Gerontological Society; 2019 Jun 14-15; Gunsan: p. 289-300.
- 6. Lee S, Lee S. Association of dietary quality with subjective health-related perception and chronic diseases according to age segmentation of korean elderly. Korean J Community Nutr 2021; 26(5): 363.ArticleLink
- 7. Ma X, Liu Y, Zhang P, Qi R, Meng F. Understanding online health information seeking behavior of older adults: a social cognitive perspective. Front Public Health 2023; 11: 1147789.ArticlePubMedPMC
- 8. Kim J, Jung B. Comparison of the health behavioral and nutrient intake of the Korean elderly before and after the start of the COVID-19 pandemic: data from the 8th Korea National Health and Nutrition Examination Survey (2019–2020). Korean J Community Living Sci 2023; 34(3): 353-364. Article
- 9. Choi SK. Women’s dietary problems over the life course. Health Welf Policy Forum 2021; 299: 6-18.
- 10. Maeng A, Lee J, Yoon E. Health and nutrition intake status of the Korean elderly according to their food security level: data from the 7th Korea National Health and Nutrition Examination Survey (KNHANES VII), 2016–2018. J Nutr Health 2021; 54(2): 179-198. ArticleLink
- 11. Ministry of Health and Welfare, Korea Health Promotion Institute (KHPI). The 5th comprehensive national health promotion plan (Health Plan 2030, 2021–2030): revised edition. KHPI; 2022 Apr. Report No. Policy-04-2022-008-01.
- 12. Ministry of Health and Welfare (MOHW), Korea Health Promotion Institute (KHPI). 2025 Community integrated health promotion project guide: nutrition. MOHW, KHPI; 2025 Jan. Report No. Policy-03-2024-054-10.
- 13. Shin H, Lee I, Kim J, Shin Y. Effects of nutrition education on dietary knowledge, dietary attitudes and dietary behavior of elderly. Korean J Food Nutr 2023; 36(2): 153-162.
- 14. Yun S, An J, Kim K. Current status of nutrition education media and its utilization in providing customized nutrition information for older adults in Korea: a scoping review based on the transtheoretical model and food literacy. Korean J Community Nutr 2025; 30(3): 175-182. ArticlePubMedPMCPDF
- 15. Bandura A. Social learning theory. Prentice-Hall; 1977.
- 16. Bandura A. Health promotion by social cognitive means. Health Educ Behav 2004; 31(2): 143-164. ArticlePubMedPMCLink
- 17. Contento IR. Nutrition education: linking research, theory & practice. Lee KE, Kim KW, Kim JM, Woo TJ, Lee SM, Lee HW, translators. Gyomoonsa; 2018. p. 101-125.
- 18. Bandura A. Self-efficacy: toward a unifying theory of behavioral change. Psychol Rev 1977; 84(2): 191-215. ArticlePubMedPMC
- 19. Evans RI, Bandura A. Albert Bandura, the man and his ideas--a dialogue. Praeger; 1989.
- 20. Prochaska JO, DiClemente CC. Stages and processes of self-change of smoking: toward an integrative model of change. J Consult Clin Psychol 1983; 51(3): 390-395. ArticlePubMedPMC
- 21. Prochaska JO, DiClemente CC, Norcross JC. In search of how people change: applications to addictive behaviors. Am Psychol 1992; 47(9): 1102-1114. ArticlePubMedPMC
- 22. Prochaska JO, Velicer WF. The transtheoretical model of health behavior change. Am J Health Promot 1997; 12(1): 38-48. ArticlePubMedPMCLink
- 23. Seo EH. Effects of an intervention of nutrition education program based on social cognitive theory for the elderly visiting a public health center in Jinhae-province. Korean J Food Nutr 2016; 29(3): 313-326. Article
- 24. Choi J, Yoo H, Chung H, Lee H, Lee M, Chang H, et al. Evaluation of effectiveness of food safety education program based on social cognitive theory for elderly in the middle class. J Korean Soc Food Sci Nutr 2018; 47(8): 838-846. Article
- 25. Lim Y, Lee J, Hwang J, Kim K, Hwang H, Kwon S, et al. Revision of nutrition quotient for elderly in assessment of dietary quality and behavior. J Nutr Health 2022; 55(1): 155-173. ArticleLink
- 26. Tavakoly Sany SB, Ahangari H, Rasoulifar A, Salimi M, Jamali J, Tehrani H. Nutrition self-efficacy intervention to improve nutritional status of Iranian older adults. J Health Popul Nutr 2024; 43(1): 22.ArticlePubMedPMC
- 27. Baek JY, Yi HY, Hwang JY, Kim K. Effects of nutrition education program based on social cognitive theory for low sodium consumption among housewives living in certain regions of Seoul. J Korean Soc Food Sci Nutr 2017; 46(10): 1243-1252.
- 28. Teggart K, Ganann R, Sihota D, Moore C, Keller H, Senson C, et al. Group-based nutrition interventions to promote healthy eating and mobility in community-dwelling older adults: a systematic review. Public Health Nutr 2022; 25(10): 2920-2951. ArticlePubMedPMC
- 29. Gham M, Um M, Kye S. Evaluation of dietary quality and nutritional status based on nutrition quotient and health functional food intake in the Korea elderly. J Korean Soc Food Cult 2019; 34(4): 474-485.
- 30. Park HJ, Lee JY, Cho W. Dietary habits and factors associated with depression in Yangpyeong-gun elderly. J Korean Soc Food Cult 2023; 38(6): 381-391.
REFERENCES
Figure & Data
REFERENCES
Citations
Citations to this article as recorded by 
 Cite
Cite XML Download
Effect of a community-based nutrition intervention incorporating social cognitive theory constructs and transtheoretical model-based counseling among community-dwelling elderly in Korea: a quasi-experimental study
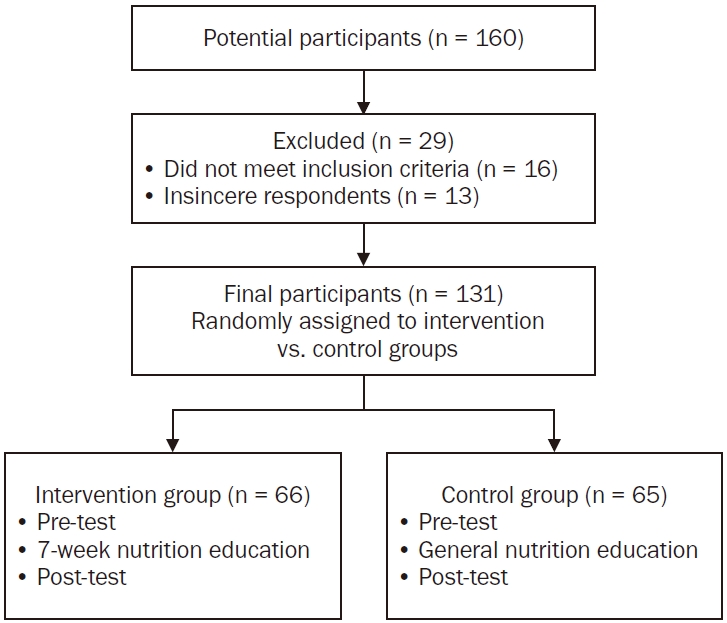
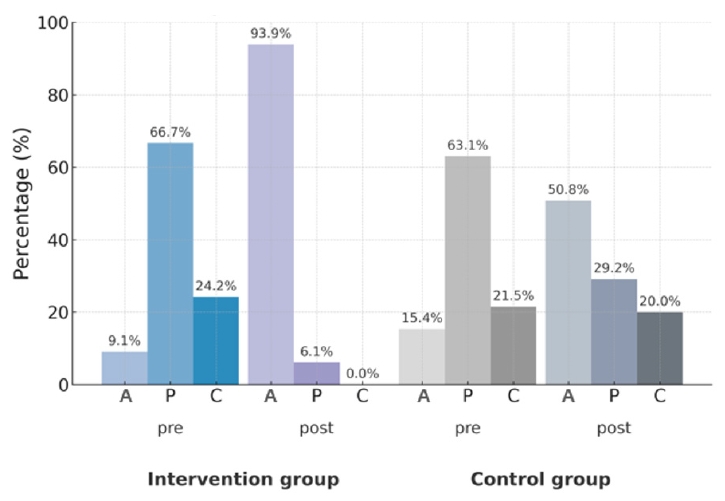
Fig. 1. Flowchart of participant recruitment, allocation, and analysis.
Fig. 2. Changes in stages of dietary behavior change before and after the intervention in the intervention (n = 66) and control groups (n = 65). Behavioral stages were reclassified into three categories: precontemplation/contemplation (C), preparation (P), and action (A). The figure presents the distributional change in behavioral stages before and after the intervention in each group. Within-group pre–post changes in stage distribution were examined using cross-tabulation, and the McNemar-Bowker test was applied when the reclassified distribution formed a square table. Between-group differences in post-intervention stage distribution were compared using the chi‑square test, and the consistency of the result was additionally confirmed using the Fisher-Freeman-Halton exact test.
Fig. 1.
Fig. 2.
Effect of a community-based nutrition intervention incorporating social cognitive theory constructs and transtheoretical model-based counseling among community-dwelling elderly in Korea: a quasi-experimental study
| Characteristics | Intervention (n = 66) | Control (n = 65) | P-value |
|---|---|---|---|
| Sex | 0.006 | ||
| Male | 9 (13.6) | 0 (0.0) | |
| Female | 57 (86.4) | 65 (100) | |
| Age (year) | 73.39 ± 6.02 | 78.82 ± 6.16 | 0.025 |
| Family type | 0.012 | ||
| Living alone | 16 (24.2) | 30 (46.2) | |
| Living with spouse | 24 (36.4) | 18 (27.7) | |
| Living with children | 7 (10.6) | 11 (16.9) | |
| Living with spouse and children | 15 (22.7) | 5 (7.7) | |
| Others | 4 (6.1) | 1 (1.5) | |
| Education level | < 0.001 | ||
| ≤ Elementary school | 8 (12.1) | 18 (27.7) | |
| Middle school | 7 (10.6) | 15 (23.1) | |
| High school | 22 (33.3) | 24 (36.9) | |
| ≥ University | 29 (43.9) | 8 (12.3) | |
| Economic support status | 0.478 | ||
| NBLS recipient | 4 (6.1) | 7 (10.8) | |
| Low-income | 5 (7.6) | 7 (10.8) | |
| None | 57 (86.4) | 51 (78.5) |
| Variables/group | Pre | Post | Adjusted change ([post–pre] ± SE |
P-value |
|---|---|---|---|---|
| Dietary knowledge total score | < 0.001 | |||
| Intervention (n = 66) | 10.03 ± 1.99 | 12.67 ± 1.24 | 2.80 ± 0.19 | |
| Control (n = 65) | 9.11 ± 2.13 | 10.14 ± 2.01 | 0.87 ± 0.19 | |
| Outcome expectation total score | 0.018 | |||
| Intervention (n = 66) | 20.68 ± 2.61 | 21.86 ± 2.49 | 1.54 ± 0.39 | |
| Control (n = 65) | 20.09 ± 2.65 | 20.60 ± 2.36 | 0.14 ± 0.39 | |
| Value expectation total score | 0.194 | |||
| Intervention (n = 66) | 22.45 ± 2.16 | 22.59 ± 2.31 | 0.66 ± 0.30 | |
| Control (n = 65) | 21.05 ± 2.26 | 21.63 ± 2.53 | 0.06 ± 0.31 | |
| Self-efficacy total score | < 0.001 | |||
| Intervention (n = 66) | 22.12 ± 2.60 | 24.33 ± 2.75 | 2.33 ± 0.36 | |
| Control (n = 65) | 22.42 ± 2.97 | 22.86 ± 2.81 | 0.33 ± 0.36 |
| Variables/group | Pre | Post | Adjusted change ([post–pre] ± SE |
P-value |
|---|---|---|---|---|
| Food accessibility/availability | 0.006 | |||
| Intervention (n = 66) | 14.47 ± 2.30 | 15.61 ± 1.88 | 1.29 ± 0.23 | |
| Control (n = 65) | 13.88 ± 2.36 | 14.35 ± 2.39 | 0.33 ± 0.23 | |
| Social support | 0.011 | |||
| Intervention (n = 66) | 6.56 ± 1.22 | 7.26 ± 1.32 | 0.71 ± 0.17 | |
| Control (n = 65) | 6.60 ± 1.47 | 6.68 ± 1.29 | 0.06 ± 0.17 | |
| Environmental factors total score | < 0.001 | |||
| Intervention (n = 66) | 21.03 ± 2.88 | 22.86 ± 2.60 | 2.00 ± 0.28 | |
| Control (n = 65) | 20.48 ± 2.91 | 21.03 ± 3.03 | 0.39 ± 0.29 |
| Variables/group | Pre | Post | Adjusted change ([post–pre] ± SE |
P-value |
|---|---|---|---|---|
| Balance domain | 0.013 | |||
| Intervention (n = 66) | 60.51 ± 13.47 | 65.78 ± 13.68 | 5.68 ± 1.89 | |
| Control (n = 65) | 61.00 ± 15.98 | 59.87 ± 17.01 | –1.54 ± 1.91 | |
| Moderation domain | 0.412 | |||
| Intervention (n = 66) | 65.96 ± 31.18 | 74.76 ± 28.06 | 5.44 ± 3.57 | |
| Control (n = 65) | 59.64 ± 30.99 | 66.12 ± 30.37 | 9.89 ± 3.60 | |
| Practice domain | 0.047 | |||
| Intervention (n = 66) | 66.61 ± 12.54 | 71.15 ± 12.54 | 4.53 ± 1.24 | |
| Control (n=65) | 65.32 ± 13.94 | 66.08 ± 13.39 | 0.77 ± 1.25 | |
| NQ-E total score | 0.011 | |||
| Intervention (n = 66) | 63.18 ± 10.58 | 68.54 ± 10.53 | 5.25 ± 1.24 | |
| Control (n = 65) | 62.37 ± 12.27 | 62.66 ± 12.12 | 0.40 ± 1.25 |
| Topics | Pre-program interest | Post-program helpfulness | P-value |
|---|---|---|---|
| Individual nutrition counseling | 4.15 ± 0.68 | 4.64 ± 0.48 | 0.001 |
| Meal planning for regular and balanced diets | 4.08 ± 0.77 | 4.45 ± 0.56 | 0.001 |
| Prevention and management of chewing and swallowing difficulties | 3.95 ± 0.79 | 4.29 ± 0.65 | 0.001 |
| Safe food purchasing and storage practices | 4.24 ± 0.66 | 4.48 ± 0.56 | 0.015 |
| Selection of foods beneficial for health | 4.36 ± 0.60 | 4.52 ± 0.53 | 0.105 |
Table 1. Homogeneity test for general characteristics of participants (n = 131)
n (%) or Mean ± SD. NBLS, national basic livelihood security.
Table 2. Changes in cognitive factors related to dietary behavior after the nutrition intervention
Mean ± SD. Dietary knowledge scores ranged from 0 to 14, with 1 point assigned for each correct response. Outcome and value expectations ranged from 5 to 25, and self-efficacy ranged from 6 to 30. Higher scores indicate greater dietary knowledge, more positive expectations, and higher self-efficacy. SE, standard error. Adjusted mean differences (post–pre) were estimated using analysis of covariance (ANCOVA), adjusted for age, family type, education level, baseline dietary knowledge, and baseline value expectations.
Table 3. Changes in environmental factors related to dietary behavior after the nutrition intervention
Mean ± SD. Food accessibility/availability scores ranged from 4 to 20, social support scores ranged from 2 to 10, and total environmental factor scores ranged from 6 to 30. Higher scores indicate more favorable environmental conditions. SE, standard error. Adjusted mean differences (post–pre) were estimated using analysis of covariance (ANCOVA), adjusted for age, family type, education level, baseline dietary knowledge, and baseline value expectations.
Table 4. Changes in NQ-E index by subdomains after the nutrition intervention
Mean ± SD. NQ-E domain and total scores were calculated using the official scoring system and converted to a 0–100 scale. Higher scores indicate more favorable dietary behavior outcomes. NQ-E, Nutrition Quotient for the Elderly; SE, standard error. Adjusted mean differences (post–pre) were estimated using analysis of covariance (ANCOVA), adjusted for age, family type, education level, baseline dietary knowledge, and baseline value expectations.
Table 5. Comparison of pre-program interest and post-program perceived helpfulness (n = 66)
Mean ± SD. Scores were rated on a 5-point Likert scale, with higher scores indicating greater interest or perceived helpfulness.



