
Articles
- Page Path
- HOME > Korean J Community Nutr > Volume 18(4); 2013 > Article
-
Original Article
- Comparison of Serum Adiponectin Levels According to Body Mass Index and Dietary Behaviors of Female University Students in Seoul
- Mi Joung Kim, Hyun Young Jun, Hye Bog Rha
-
Korean Journal of Community Nutrition 2013;18(4):354-364.
DOI: https://doi.org/10.5720/kjcn.2013.18.4.354
Published online: August 31, 2013
Department of Food and Nutrition, College of Natural Sciences, Seoul Women's University, Seoul, Korea.
- Corresponding author: Hye Bog Rha, Department of Food and Nutrition, College of Natural Sciences, Seoul Women's University, #126 Kongneung 2-dong, Nowon-gu, Seoul 139-774, Korea. Tel: (02) 970-5645, Fax: (02) 976-4049, hbna@swu.ac.kr
• Received: December 21, 2012 • Revised: February 1, 2013 • Accepted: July 3, 2013
Copyright © 2013 The Korean Society of Community Nutrition
This is an Open-Access article distributed under the terms of the Creative Commons Attribution Non-Commercial License (http://creativecommons.org/licenses/by-nc/3.0/) which permits unrestricted non-commercial use, distribution, and reproduction in any medium, provided the original work is properly cited.
- 383 Views
- 0 Download
- 2 Crossref
Abstract
- This study was conducted to determine whether dietary factors could be related with serum adiponectin concentrations in 243, year-three female university students living in Seoul. The mean of body mass index (BMI) and adiponectin levels of all subjects were 20.17 kg/m2 and 11.07 µg/ml, respectively. When the subjects were divided into 3 groups based on BMI (underweight: < 18.5, normal: 18.5 ≤ < 23, overweight and obesity: ≥ 23), serum adiponectin levels in underweight group was significantly higher than that in 'normal' or 'overweight and 'obesity' groups. Also when the subjects were divided into two groups by mean adequacy ratio (MAR), serum adiponectin concentration of the high MAR group (MAR > 75) was slightly higher than that the low MAR group (MAR ≤ 75). Serum adiponectin levels showed a negative correlation with body weight (p < 0.01) or BMI (p < 0.001) and a positive correlation with intakes of of animal or total protein (please clarify) or vegetable protein.Among the dietary behaviors, serum adiponectin levels of females who answered 'yes' to the question about 'eating breakfast' was significantly higher than that of those who answered 'sometimes' or 'No' (p < 0.05) and serum adiponectin levels were higher among those who reported higher fruit intakes. Overall, our results suggested that healthy lifestyle including acceptable BMI, eating breakfast and higher fruit consumption might play an important role in the prevention of obesity and enhancement of blood adiponectin levels.
- 1. Adamczak M, Wiecek A, Funahashi T, Chudek J, Kokot F, Matsuzawa Y. Decreased plasma adiponectin concentration in patients with essential hypertension. Am J Hypertens 2003; 16(1): 72-75.ArticlePubMed
- 2. Albu J, Allison D, Boozer CN, Heymsfield S, Kissileff H, Kretser A, Krumhar K, Leibei R, Nonas C, Pi-Sunyer X, Vanltallie T, Wedral E. Besity solutions: report of ameeting. Nutr Rev 1997; 55(5): 150-156.PubMed
- 3. Arita Y, Kihara S, Ouchi N, Takahashi M, Maeda K, Miyagawa J, Hotta K, Shimomura I, Nakamura T, Miyaoka K, Kuriyama H, Nishida M, Yamashita S, Okubo K, Matsubara K, Muraguchi M, Ohmoto Y, Funahashi T, Matsuzawa Y. Paradoxical decrease of an adipose-specific protein, adiponectin in obesity. Biochem Biophys Res Commun 1999; 257(1): 79-83.ArticlePubMed
- 4. Cheong SH, Kwon WJ, Chang KJ. A comparative syudyon the dietary attitudes, dietary behaviors and diet qualities of food and nutrition major non-major female university students. Korean J Community Nutr 2002; 7(3): 293-303.
- 5. Chin JH, Chang KJ. College student's attitude toward body weight control, health-related lifestyle and dietary behavior by self-perception on body image and obesity index. J Korean Soc Food Sci Nutr 2005; 34(10): 1559-1565.Article
- 6. Choi KM, Lee J, Lee KW, Seo JA, Oh JH, Kim SG, Kim NH, Choi DS, Baik SH. Serum adiponectin concentrations predict the developments of type 2 diabetes and the metabolic syndrome in elderly Koreans. Clin Endocrinol (Oxf) 2004; 61(1): 75-80.ArticlePubMed
- 7. Choi MY, Park DY, Rhie SG. Rice preference differences in subjects taking breakfast regularly and skipping breakfast in Kyeonggi-do residence. Korean J Community Nutr 2003; 8(4): 547-555.
- 8. Corbetta S, Bulfamante G, Cortelazzi D, Barresi V, Cetin I, Mantovani G, Bondioni S, Beck-Peccoz P, Spada A. Adiponectin expression in human fetal tissues during mid- and late gestation. J Clin Endocrinol Metab 2005; 90(4): 2397-2402.ArticlePubMedPDF
- 9. Franzoi SL, Koehler V. Age and gender differences in body attitudes: a comparison of young and elderly adults. Int J Aging Hum Dev 1998; 47(1): 1-10.ArticlePubMedPDF
- 10. Garaulet M, Viguerie N, Porubsky S, Klimcakova E, Clement K, Langin D, Stich V. Adiponectin gene expression and plasma values in obese women during very-low-calorie diet. Relationship with cardiovascular risk factors and insulin resistance. J Clin Endocrinol Metab 2004; 89(2): 756-760.ArticlePubMedPDF
- 11. Grundy SM. Multifactorial causation of obesity: implications for prevention. Am J Clin Nutr 1998; 67(3): 563S-572S.ArticlePubMed
- 12. Huang KC, Chen CL, Chuang LM, Ho SR, Tai TY, Yang WS. Plasma adiponectin levels and blood pressures in nondiabetic adolescent females. J Clin Endocrinol Metab 2003; 88(9): 4130-4134.ArticlePubMed
- 13. Jung YM, Chung KS, Lee SE. Comparison of health behavior, body composition and body image in college women by BMI (Body Mass Index). Korean J Health Educ Promot 2005; 22(1): 87-102.
- 14. Kamari Y, Grossman E, Oron-Herman M, Peleg E, Shabtay Z, Shamiss A, Sharabi Y. Metabolic stress with a high carbohydrate diet increases adiponectin levels. Horm Metab Res 2007; 39(5): 384-388.ArticlePubMed
- 15. Kasim-Karakas SE, Tsodikov A, Singh U, Jialal I. Responses of inflammatory markers to a low-fat, high-carbohydrate diet: effects of energy intake. Am J Clin Nutr 2006; 83(4): 774-779.ArticlePubMed
- 16. Koo JO, Kim JH, Byun KW, Sohn CM, Lee JW, Lee JH, Choi YS. Nutrition through the life cycle. Seoul: Powerbook; 2011. p. 266-304.
- 17. Korean Society for the Study of Obesity. Diagnosis and therapy of obesity: the Asia-Pacific area guideline. Seoul: 2000.
- 18. Kumada M, Kihara S, Sumitsuji S, Kawamoto T, Matsumoto S, Ouchi N, Arita Y, Okamoto Y, Shimomura I, Hiraoka H, Nakamura T, Funahashi T, Matsuzawa Y. Association of hypoadiponectinemia with coronary artery disease in men. Arterioscler Thromb Vasc Biol 2003; 23(1): 85-89.ArticlePubMed
- 19. Lee JH, Kim JS, Lee MY, Chung SH, Chang KJ. A study on weight-control experience eating disorder and nutrient intake of college students attending web class via the internet. Korean J Community Nutr 2001; 6(4): 604-616.
- 20. Lee JW, Lee MS, Kim JH, Son SM, Lee BS. Nutritional assessment. Paju: Kyomunsa; 2006. p. 68-191.
- 21. Lee MS, Woo MK. Changes in food habit, nutritional knowledge and nutrition attitude of university students during nutrition course. Korean J Nutr 1999; 32(6): 735-745.
- 22. Lee MY, Kim JH. Association of serum lipids and dietary intakes with serum adiponectin level in overweight and obese Korean women. Korean J Community Nutr 2010; 15(1): 27-35.
- 23. Lee SH, Hyun MH. The effects of obesity, body image satisfaction, and binge eating on depression in middle school girls. Korean J Health Psychol 2001; 6(1): 195-207.
- 24. Lee YN, Choi HM. A study on the relationship between body mass index and the food habits of collage students. Korean J Diet Cult 1994; 9(1): 1-10.
- 25. Mantzoros CS, Williams CJ, Manson JE, Meigs JB, Hu FB. Adherence to the Mediterranean dietary pattern is positively associated with plasma adiponectin concentrations in diabetic women. Am J Clin Nutr 2006; 84(2): 328-335.ArticlePubMed
- 26. Matsuzawa Y, Funahashi T, Kihara S, Shimomura I. Adiponectin and metabolic syndrome. Arterioscler Thromb Vasc Biol 2004; 24(1): 29-33.ArticlePubMed
- 27. Ministry of Health and Welfare. Report of 2009 Korean National Health and Nutritional Examination Survey, KNHANES IV. 2010; cited 2011 April 13]. Available from http://www.mw.go.kr/front_new/jb/sjb030301vw.jsp?PAR_MENU_ID=03&MENU_ID=031604&CONT_SEQ=264574&page=1.
- 28. Motoshima H, Wu X, Sinha MK, Hardy VE, Rosato EL, Barbot DJ, Rosato FE, Goldstein BJ. Differential regulation of adiponectin secretion from cultured human omental and subcutaneous adipocytes: effects of insulin and rosiglitazone. J Clin Endocrinol Metab 2002; 87(12): 5662-5667.ArticlePubMed
- 29. Ohashi K, Kihara S, Ouchi N, Kumada M, Fujita K, Hiuge A, Hibuse T, Ryo M, Nishizawa H, Maeda N, Maeda K, Shibata R, Walsh K, Funahashi T, Shimomura I. Adiponectin replenishment ameliorates obesity-related hypertension. Hypertension 2006; 47(6): 1108-1116.ArticlePubMed
- 30. Okamoto Y, Kihara S, Ouchi N, Nishida M, Arita Y, Kumada M, Ohashi K, Sakai N, Shimomura I, Kobayashi H, Terasaka N, Inaba T, Funahashi T, Matsuzawa Y. Adiponectin reduces atherosclerosis in apolipoprotein e-deficient mice. Circulation 2002; 106(22): 2767-2770.ArticlePubMed
- 31. Pi-Sunyer FX. Medical hazards of oesity. Ann Intern Med 1993; 119(7 Pt 2): 655-660.ArticlePubMed
- 32. Qi L, Rimm E, Liu S, Rifai N, Hu FB. Dietary glycemic index, glycemic load, cereal fiber, and plasma adiponectin concentration in diabetic men. Diabetes Care 2005; 28(5): 1022-1028.ArticlePubMedPDF
- 33. Ryo M, Nakamura T, Kihara S, Kumada M, Shibazaki S, Takahashi M, Nagai M, Matsuzawa Y, Funahashi T. Adiponectin as a biomarker of the metabolic syndrome. Circ J 2004; 68(11): 975-981.ArticlePubMed
- 34. Ryu ST, Park SO, Kim SH. The relation of serum adiponectin and resistin concentrations with metabolic risk factors. J Korean Soc Endocrinol 2005; 20(5): 444-451.Article
- 35. Schlundt DG, Hill JO, Sbrocco T, Pope-Cordle J, Kasser T. Obesity: A biogenetic or biobehavioral problem. Int J Obes 1990; 14(9): 815-828.PubMed
- 36. Seo DH, Park GS, Shin YJ. The dietary habits and preference of food on skin types of women college students. Korean J Food Cult 2005; 20(1): 15-20.
- 37. Shigeta H, Shigeta M, Nakazawa A, Nakamura N, Yoshikawa T. Lifestyle, obesity, and insulin resistance. Diabetes care 2001; 24(3): 608.ArticlePDF
- 38. Williams CJ, Fargnoli JL, Hwang JJ, van Dam RM, Blackburn GL, Hu FB, Mantzoros CS. Coffee consumption is associated with higher plasma adiponectin concentrations in women with or without type 2 diabetes: a prospective cohort study. Diabetes Care 2008; 31(3): 504-507.PubMed
- 39. Yamauchi T, Kamon J, Minokoshi Y, Ito Y, Waki H, Uchida S, Yamashita S, Noda M, Kita S, Ueki K, Eto K, Akanuma Y, Froguel P, Foufelle F, Ferre P, Carling D, Kimura S, Nagai R, Kahn BB, Kadowaki T. Adiponectin stimulates glucose utilization and fatty-acid oxidation by activating AMP-activated protein kinase. Nat Med 2002; 8(11): 1288-1295.ArticlePubMedPDF
- 40. Yamauchi T, Kamon J, Waki H, Terauchi Y, Kubota N, Hara K, Mori Y, Ide T, Murakami K, Tsuboyama-Kasaoka N, Ezaki O, Akanuma Y, Gavrilova O, Vinson C, Reitman Ml, Kagechika H, Shudo K, Yoda M, Nakano Y, Tobe K, Nagai R, Kimura S, Tomita M, Froguel P, Kadowaki T. The fat derived hormone adiponectin reverses insulin resistance associated with both lipoatrophy and obesity. Nat Med 2001; 7(8): 941-946.ArticlePubMedPDF
- 41. Yang WS, Lee WJ, Funahashi T, Tanaka S, Matsuzawa Y, Chao CL, Chen CL, Tai TY, Chuang LM. Plasma adiponectin levels in overweight and obese Asians. Obes Res 2002; 10(11): 1104-1110.ArticlePubMed
- 42. Yeon JY, Bae YJ. Evaluation of nutrient and food intake status, and dietary quality -Focused on comparison with overweight and normal female university students-. Korean J Food Nutr 2010; 23(4): 453-461.
REFERENCES
Table 1Comparison of anthropometric characteristics and blood biochemical indices on BMI groups in female university students

1) Underweight: body mass index is less than 18.5
2) Normal: 18.5 ≤ body mass index < 23
3) Overweight & Obesity: body mass index ≥ 23
4) Mean ± SD
5) BMI: Body mass index
6) SBP: systolic blood pressure
7) DBP: diastolic blood pressure
NS: not significant
abc: Means with the different superscripts are significantly different at p < 0.05 by Duncan's multiple range test.
Table 2Correlation coefficient among adiponectin level, antrophometric and biochemical indices in university students

Table 3Comparison of serum adiponectin level and antrophometric and biochemical indices by low and high mean adequacy ratio (MAR) groups in female university students
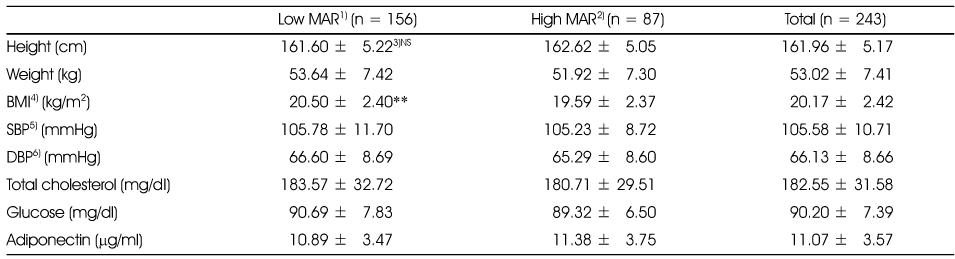


Figure & Data
REFERENCES
Citations
Citations to this article as recorded by 
- A Study on Food Habits and Nutrient Intakes according to BMI in Food and Nutrition Major and Non-major Female Students in Kyungnam University
Eun-Hee Seo
Korean Journal of Community Nutrition.2014; 19(4): 297. CrossRef - Relationships among Serum Adiponectin, Leptin and Vitamin D Concentrations and the Metabolic Syndrome in Farmers
Seo-Eun Yeon, Hee-Ryoung Son, Jung-Sook Choi, Eun-Kyung Kim
Korean Journal of Community Nutrition.2014; 19(1): 12. CrossRef
 PubReader
 Cite
CiteComparison of Serum Adiponectin Levels According to Body Mass Index and Dietary Behaviors of Female University Students in Seoul
Comparison of Serum Adiponectin Levels According to Body Mass Index and Dietary Behaviors of Female University Students in Seoul
Comparison of anthropometric characteristics and blood biochemical indices on BMI groups in female university students
1) Underweight: body mass index is less than 18.5
2) Normal: 18.5 ≤ body mass index < 23
3) Overweight & Obesity: body mass index ≥ 23
4) Mean ± SD
5) BMI: Body mass index
6) SBP: systolic blood pressure
7) DBP: diastolic blood pressure
NS: not significant
abc: Means with the different superscripts are significantly different at p < 0.05 by Duncan's multiple range test.
Correlation coefficient among adiponectin level, antrophometric and biochemical indices in university students
1) BMI: body mass index, 2) T-chol: total cholesterol, 3) SBP: systolic blood pressure, 4) DBP: diastolic blood pressure
*: p < 0.05, **: p < 0.01, ***: p < 0.001 by pearson's correlation coefficient
Comparison of serum adiponectin level and antrophometric and biochemical indices by low and high mean adequacy ratio (MAR) groups in female university students
1) Low MAR; low mean adequacy ratio group (≤ 0.75)
2) High MAR; high mean adequacy ratio group (> 0.75)
3) Mean ± SD
4) BMI: Body mass index
5) SBP: systolic blood pressure
6) DBP: diastolic blood pressure
NS; not significant by t-test, **: p < 0.01
Correlation coefficient among nutritional intakes and serum adiponectin levels in female university students
*: p < 0.05, **: p < 0.01 by pearson's correlation coefficient
Comparison of serum adiponectin levels according to dietary behaviors in female university students
1) Mean ± SD
ab: Means with the different superscripts are significantly different among dietary behavior groups at p < 0.05 by Duncan's multiple range test
Table 1
Comparison of anthropometric characteristics and blood biochemical indices on BMI groups in female university students
1) Underweight: body mass index is less than 18.5 2) Normal: 18.5 ≤ body mass index < 23 3) Overweight & Obesity: body mass index ≥ 23 4) Mean ± SD 5) BMI: Body mass index 6) SBP: systolic blood pressure 7) DBP: diastolic blood pressure NS: not significant abc: Means with the different superscripts are significantly different at p < 0.05 by Duncan's multiple range test.
Table 2
Correlation coefficient among adiponectin level, antrophometric and biochemical indices in university students
1) BMI: body mass index, 2) T-chol: total cholesterol, 3) SBP: systolic blood pressure, 4) DBP: diastolic blood pressure *: p < 0.05, **: p < 0.01, ***: p < 0.001 by pearson's correlation coefficient
Table 3
Comparison of serum adiponectin level and antrophometric and biochemical indices by low and high mean adequacy ratio (MAR) groups in female university students
1) Low MAR; low mean adequacy ratio group (≤ 0.75) 2) High MAR; high mean adequacy ratio group (> 0.75) 3) Mean ± SD 4) BMI: Body mass index 5) SBP: systolic blood pressure 6) DBP: diastolic blood pressure NS; not significant by t-test, **: p < 0.01
Table 4
Correlation coefficient among nutritional intakes and serum adiponectin levels in female university students
*: p < 0.05, **: p < 0.01 by pearson's correlation coefficient
Table 5
Comparison of serum adiponectin levels according to dietary behaviors in female university students
1) Mean ± SD ab: Means with the different superscripts are significantly different among dietary behavior groups at p < 0.05 by Duncan's multiple range test


