Articles
- Page Path
- HOME > Korean J Community Nutr > Volume 18(4); 2013 > Article
-
Original Article
- Survey on Dietary Behaviors and Intakes of Instant Noodle (Ramyeon) Soup among College Students
- Hyung-Sook Kim, Eun-Young Lee, Kyungmin Kim, Kyung Won Kim, Jinwon Pyun, Sang-Jin Chung, Young Hye Kwon, Ikhyun Yeo, Sangyun Lee, Kisun Nam
-
Korean Journal of Community Nutrition 2013;18(4):365-371.
DOI: https://doi.org/10.5720/kjcn.2013.18.4.365
Published online: August 31, 2013
Department of Food and Nutrition, University of Suwon, Gyeonggi, Korea.
1Division of Diet Research, Institute of Food & Culture, Pulmuone Holdings Co., Ltd. Seoul, Korea.
2Department of Food and Nutrition, Baewha Women's University, Seoul, Korea.
3Department of Food and Nutrition, Seoul Women's University, Seoul, Korea.
4Department of Food and Nutrition, Suwon Women's College, Gyeonggi, Korea.
5Department of Food and Nutrition, Kookmin University, Seoul, Korea.
6Department of Food and Nutrition, Seoul National University, Seoul, Korea.
- Corresponding author: Kisun Nam, Division of Diet Research, Institute of Food & Culture, Pulmuone Holdings Co., Ltd., Seodaemun P.O. Box 146, Seodaemun-Gu, Seoul 120-600, Korea. Tel: (02) 3277-8516, Fax: (02) 6499-0129, ksnama@pulmuone.com
Copyright © 2013 The Korean Society of Community Nutrition
This is an Open-Access article distributed under the terms of the Creative Commons Attribution Non-Commercial License (http://creativecommons.org/licenses/by-nc/3.0/) which permits unrestricted non-commercial use, distribution, and reproduction in any medium, provided the original work is properly cited.
- 1,697 Views
- 7 Download
- 16 Crossref
Abstract
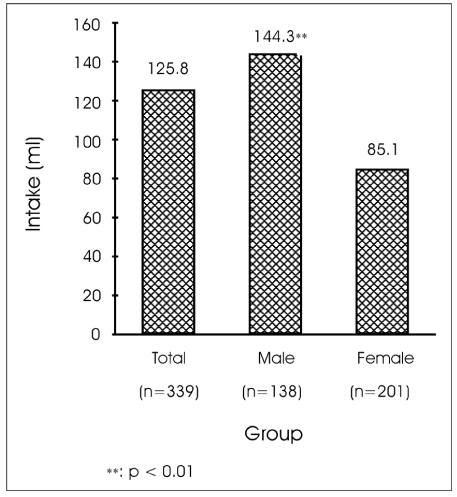
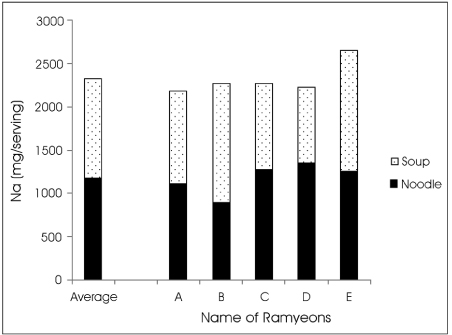
- High intakes of sodium may increase the risk of hypertension or cardiovascular diseases. According to the 2010 Korea National Health and Nutrition Survey, the average intake of sodium was 4,878 mg/day with salt, kimchi, soy sauce, fermented soybean paste and Ramyeon being the five main sources of sodium. In order to identify solutions to reduce the intake of sodium, we investigated the intake patterns and eating behaviors of Ramyeon among 347 college students (male 146, female 201) using survey questionnaires. The average age of study subjects was 23.7 years for males and 20.5 years for females. The average Body Mass Index (kg/m2) was 21.9 for males and 20.1 for females. The average frequency of Ramyeon intake was 2.0 times/week. The main reason for eating Ramyeon was convenience (56%), followed by good taste (27%), low price (11%) and other reasons (9%). The criteria for choosing Ramyeon were taste (72%), convenience (14%), price (7%), nutrition (1%), and the other factors (2%). Males' average intake of Ramyeon soup (61%) was higher than that of the females (36%). The estimated intake of Ramyeon soup by survey showed a positive correlation with the measured intake of Ramyeon soup. Sodium contents of Ramyeon were measured separately for the noodles and the soup, which were 1,185 mg/serving and 1,148 mg/serving each. Therefore, the amount of sodium intake can be reduced if students eat less Ramyeon soup. Also, we observed that dietary behaviors and soup intakes of Ramyeon between the sexes were different. Appropriate nutritional education for proper eating habits may help decrease the intake of sodium.
- 1. Kim SK, Lee AR. Survey on consumption pattern of Ramyon in Seoul area. Korean J Dietary Culture 1989; 4(4): 395-404.
- 2. Korea Food and Drug Administration. Korean food standard codex. 2010; cited 2010 September 1]. Available from http://www.kfda.go.kr.
- 3. Korea Health Industry Development Institute. In-depth analysis on the 3rd (2005) Korea health and nutrition examination survey-nutrition survey-. 2007a; cited 2013 February 28]. Available from http://www.khidi.or.kr.
- 4. Korea Health Industry Development Institute. Development of food and nutrient database -Food portion/weight database-. 2007b; cited 2013 March 28]. Available from http://www.khidi.or.kr.
- 5. Korean Nutrition Society. Dietary reference intakes for Koreans 2010. 2010.
- 6. Korean Society for Study of Obesity. Management of obesity 2012. Seoul: 2012. p. 17-22.
- 7. Korean Society of Community Nutrition. Questionnaires for dietary survey. 2000.
- 8. Lee JS, Km J, Hong KH, Jang YA, Park SH, Sohn YA, Chung HR. A comparison of food and nutrient intakes between instant noodle consumers and non-consumers among Korean children and adolescents. Korean J Nutr 2009; 42(8): 723-731.Article
- 9. Lee JW, Lee YH. Frequency of instant noodle (Ramyeon) intake and food value recognition, and their relationship to blood lipid levels of male adolescents in rural area. Korean J Community Nutr 2003; 8(4): 485-494.
- 10. Lee YN, Choi H. A study on the relationship between body mass index and the food habits of college students. Korean J Diet Cult 1994; 9(1): 1-10.
- 11. Lottemart. Food labels. 2013; cited 2013 April 29]. Available from http://www.lottemart.com.
- 12. Ministry of Health and Welfare. Korea National Health and Nutrition Examination Survey (KNHANES V-1). Korea Health Statistics 2010. Korea Centers for Disease Control & Prevention; 2011.
- 13. National Academy of Agricultural Science. Standard food composition table 8th revision. 2011; cited 2013 March 28]. Available from http://koreanfood.rda.go.kr.
- 14. Nielsen Company. Nielsen market information diegest. 2013; cited 2013 Feb 28]. Available from http://kr.nielsen.com.
- 15. World Health Organization, Food and Agriculture Organization of the United Nations. Diet, nutrition and the prevention of chronic diseases. Geneva: World Health Organization; 2003.
REFERENCES
Figure & Data
REFERENCES
Citations

- Evaluating food portion estimation accuracy with multi-angle photographs
In-Young Choi, Mi-Hyun Kim
Nutrition Research and Practice.2025; 19(4): 605. CrossRef - Comparison of the nutrition quotient by types of eating behavior among male and female university students in Gwangju
Geum-Bi Ryu, Young-Ran Heo
Journal of Nutrition and Health.2023; 56(3): 277. CrossRef - Effects from the Use of Nutrition Labels and the Levels of Sodium-related Nutrition Knowledge on the Consumption of Instant Noodles (Ramyeon) by Middle School Students in the Incheon Area
Yang-Hee Kwon, Hyung-Sook Kim
Korean Journal of Community Nutrition.2022; 27(5): 397. CrossRef - A Qualitative Study on the Dietary Experience with the Children’s Meal Card : Focused on College Students Living in Busan
Soo Jin Lee, Ho Kyung Ryu
The Korean Journal of Community Living Science.2022; 33(2): 205. CrossRef - Flavor principle as an implicit frame: Its effect on the acceptance of instant noodles in a cross-cultural context
Meng Li, Seo-Jin Chung
Food Quality and Preference.2021; 93: 104293. CrossRef - Comparison of Sodium-Related Dietary Behavior and Low-Salt Dietary Attitude Based on the Gender and Salty Taste Assessment of Chinese International Students in the Jeonbuk Area
Qi Li, Ji Eun Lee, Jeong Ok Rho
Journal of the East Asian Society of Dietary Life.2021; 31(2): 91. CrossRef - A Cross-National Study on Selection Attributes of Instant Noodle between China and Korea
Seong Soo Cha, Xiao-Wu Wang
Journal of Food Products Marketing.2020; 26(1): 1. CrossRef - Comparison of the sodium content of Korean soup-based dishes prepared at home, restaurants, and schools in Seoul
Yanghee Park, Jihyun Yoon, Sang-Jin Chung
Journal of Nutrition and Health.2020; 53(6): 663. CrossRef - Development of a database of capsaicinoid contents in foods commonly consumed in Korea
Hoyoun Cho, Youngjoo Kwon
Food Science & Nutrition.2020; 8(8): 4611. CrossRef - Analysis of Sodium Content and Tastes of Ramyeon Cooked Using Different Recipes
Chang-Hwan Oh, Chung Ha-Yull
Korean Journal of Food and Cookery Science.2018; 34(5): 450. CrossRef - Development and User Satisfaction of a Mobile Phone Application for Image-based Dietary Assessment
Seo-Yoon Kim, Sang-Jin Chung
Korean Journal of Community Nutrition.2017; 22(6): 485. CrossRef - Association of instant noodle intake with metabolic factors in Korea: Based on 2013~2014 Korean National Health and Nutrition Examination Survey
Jee-Young Yeon, Yun-Jung Bae
Journal of Nutrition and Health.2016; 49(4): 247. CrossRef - Differences in Sodium-Intake Related Dietary Behaviors and Correlation Analysis According to Salty Taste Preference of University Students in Busan Area
Min-Ji Kang, Ki-Bo Choi, Eun-Soon Lyu
Korean journal of food and cookery science.2015; 31(4): 477. CrossRef - Study on Sodium Reduction: 'Healthy Restaurant for Sodium Reduction'
Soon Myung Hong, Jee Hye Lee, Hye-Kyung Kim, Rina Yu, Jeong Hee Seo, Eun Jeong Huh, Seong Suk Cho, Jeongah Yang
Journal of the Korean Dietetic Association.2014; 20(3): 174. CrossRef - A Study on Food Habits and Nutrient Intakes according to BMI in Food and Nutrition Major and Non-major Female Students in Kyungnam University
Eun-Hee Seo
Korean Journal of Community Nutrition.2014; 19(4): 297. CrossRef - Diet-Related Health Risk Appraisal for Cardiometabolic Diseases of the College Students in Gyunggi-do
Hyung-Sook Kim
The Korean Journal of Community Living Science.2014; 25(1): 89. CrossRef


Fig. 1
Fig. 2
General characteristics of study subjects
1) Mean ± SD
2) BMI classification is defined by Korean Society for Study of Obesity: underweight: BMI < 18.5, normal weight: 18.5 - 22.9, overweight: 23 - 24.9, Obese class 1: 25 - 29.9
3) N (%)
BMI: Body mass index, body weight (kg) / [height (m)]2
***: p < 0.001 by χ2-test
Reasons for eating, criteria for choosing, and frequency of Ramyeon intake
1) Multiple reply (total response: 355)
2) N (%)
3) Mean ± SD
4) Significance as determined by t-test, NS: Not Significant
***: p < 0.01 by χ2-test
Intake frequency of Ramyeon and estimated intake of Ramyeon soup by type of residence
1) Mean ± SD
*: p < 0.05 by ANOVA
Intake time of Ramyeon
1) Multiple reply
2) N (%)
*: p < 0.05 by χ2-test
Correlations of Body Mass Index, estimated intake of Ramyeon soup by questionnaire, measured intake of Ramyeon soup
***: p < 0.001
1) Mean ± SD 2) BMI classification is defined by Korean Society for Study of Obesity: underweight: BMI < 18.5, normal weight: 18.5 - 22.9, overweight: 23 - 24.9, Obese class 1: 25 - 29.9 3) N (%) BMI: Body mass index, body weight (kg) / [height (m)]2 ***: p < 0.001 by χ2-test
1) Multiple reply (total response: 355) 2) N (%) 3) Mean ± SD 4) Significance as determined by t-test, NS: Not Significant ***: p < 0.01 by χ2-test
1) Mean ± SD *: p < 0.05 by ANOVA
1) Multiple reply 2) N (%) *: p < 0.05 by χ2-test
***: p < 0.001

 KSCN
KSCN


 Cite
Cite


