
Articles
- Page Path
- HOME > Korean J Community Nutr > Volume 16(4); 2011 > Article
-
Original Article
- Analysis of BMI, Body Composition, Weight Control, Dietary Behaviors of Adult Women
- Jae Ok Koo, Seoyun Park
-
Korean Journal of Community Nutrition 2011;16(4):454-465.
DOI: https://doi.org/10.5720/kjcn.2011.16.4.454
Published online: August 31, 2011
Department of Home Economics, Korea National Open University, Seoul, Korea.
1)Department of Food and Nutrition, Catholic University, Pucheon, Korea.
- Corresponding author: Jae Ok Koo, Department of Home Economic Korea National Open University, Dongsungdong 169, Seoul 110-791, Korea. Tel: (02) 3668-4643, Fax: (02) 3668-4188, cokoo@knou.ac.kr
• Received: July 12, 2011 • Revised: August 4, 2011 • Accepted: August 20, 2011
Copyright © 2011 The Korean Society of Community Nutrition
- 2,205 Views
- 7 Download
- 19 Crossref
Abstract
- This study was carried out to investigate distribution of obesity, body composition, weight control and dietary behaviors, and to analyze the relationship between Body Mass Index (BMI) and physical characteristics, body composition and dietary behaviors by anthropmetric measurement and questionnaires. The 199 study subjects were divided into 3 age groups; 30's (78), 40's (77) and 50's (44) and 4 groups by BMI ; under weight (4.5%), normal (51.3%), over weight (26.1%) and obese (18.1%). Amount of skeletal muscle, body water, mineral and body fat were significantly increased with BMI. There were especially significant increase skeletal muscle 5.3 kg (19.1 → 23.5 kg), body water 5.3 kg (26.3 → 31.6 kg) and fat 15.2 kg (11.2 → 26.4 kg) from under weight to obesity group, respectively (p < 0.01). There were significantly decreased in the ratio of body water (10.3%), protein (2.7%) and body mineral (1.1%) from under weight to obesity, but significant increase 14.1% in body fat (p < 0.001). About 44.4% of under weight group and 40.1% of normal group and 50% of over and obesity group had dissatisfaction on their body images. Most of the women were concerned about their body images and experienced weight control. Dietary behavior scores of obesity group were significant lower than the other four groups (p < 0.001). There were significant positive correlation between BMI and body water (r = 0.62), protein (r = 0.52), skeletal muscle (r = 0.63), body fat (r = 0.91) and WH ratio (r = 0.91), respectively (p < 0.001). The correlation between BMI and body fat and WH ratio were much higher than the correlation between weight and fat and WH ratio.
- 1. Balkau B, Deanfield JE, Desprs JP, Bassand JP, Fox KAA, Smith SC, Barter P, Tan CE, Gaal LV, Wittchen HU, Massien C, Haffner SM. International Day for the Evaluation of Abdominal obesity (IDEA): A study of waist circumference, cardiovascular disease, and diabetes mellitus in 168,000 primary care patients in 63 countries. Circulation. 2007; 116(17): 1942-1951.Article
- 2. Biospace. User's manual (Inbody 230). 2008; Seoul: Biospace Co., Ltd.
- 3. Chang HS. A study on weight control behavior, eating habits and health-related life habits according to obesity degree by body fat percentage among middle-aged women in Gunsan city. Korean J Community Nutr. 2010; 15(2): 227-239.
- 4. Haroun D, Taylor SJC, Viner RM, Hayward RS, Darch TS, Eaton S, Cole TJ, Wells JCK. Validation of bioelectrical impedance analysis in adolescents across different ethnic groups. Obesity. 2010; 18: 1252-1259.
- 5. Heymsfield S, Loham T, Wang Z-M, Going S. Body composition second edition. 2005; USA: Human Kinetics; 18.
- 6. Hwang IC, Jo YM, Kim KK. The usefulness of waist to hip ratio estimated by bioelectric impedance analysis in diagnosing metabolic syndrome based on NCEP-ATP III guideline. Korean J Obes. 2009; 18(3): 79-86.
- 7. Jang MR, Kim MH. Job satisfaction of dietitians between elementary school and high school. J Korean Diet Assoc. 2003; 9(1): 13-21.
- 8. Jensen MD. Role of body fat distribution and the metabolic complications of obesity. J Clin Endocrinol Metab. 2008; 93: 11 Suppl 1. S57-S63.
- 9. Kang JK. Lifestyle disease. J Korean Med Assoc. 2004; 47(3): 188-194.
- 10. Kim HS. Evaluation of simple methods to estimate body composition in female. J Korean Soc Study Obes. 2002; 11(4): 398-405.
- 11. Kim MS, Ahn HS. Dietary intakes and serum component in middle aged abdominal obese women. J Korean Soc Study Obes. 2003; 12(2): 124-136.
- 12. Kim YH, Kim Y. A study on body mass index and associated factors of the middle aged women in small city. Korean J Community Nutr. 2002; 7(4): 506-515.
- 13. Kim YH, Ou SW, Kim YS, Chun JH, Yang J, Yoon YS, Lee ES. The factors affecting the fat distribution in the abdomen of obese women. Korean J Obes. 2005; 14(1): 39-46.
- 14. Kim YJ. Comarisons of obesity-related psychosocial factors and food behavior according to percentage of body fat among adolescent girls. 1998; graduate School of Suwon University: MS thesis.
- 15. Koo JO, Park SY. Analysis of BMI menopose, blood pressure and dietary habits affecting born mineral density of 30~60 years women. Korean J Community Nutr. 2010; 15(3): 403-414.
- 16. Major health issue in Korea. Korea Centers for Disease Control & Prevention. 2007; cited 2011 Jun 20. Available from http://www.mohw.go.kr/front/al/sal0301vw.jsp.
- 17. The statistics of life table 2008. Korean National Statistical Office. 2009; cited 2011 March 1. Available from http://www.kosis.kr.
- 18. Korean women's health conditions and policy agenda. Korean Women's Development Institute. 2008; cited 2011 Jun. Available from http://www.kwdi.re.kr/.
- 19. Kuczmarski MF, Kuczmarski RJ, Najjar M. Effects of age on validity of self-reported height, weight, and body mass index: Findings from the third National Health and Nutrition Examination Survey. J Am Diet Assoc. 2001; 101(1): 28-34.
- 20. Lee SE, Jung YM, Jung KS. A study on the validation of somatotype drawing as a instrument of measuring obesity level by body component analysis. J Korea Community Health Nurs Acad Soc. 2004; 18(2): 299-311.
- 21. Lee HJ, Choi MR, Koo JO. A study of body image, weight control and dietary habits with different BMI in female high school students. Korean J Community Nutr. 2005; 10(6): 805-813.
- 22. Legido A, Sarria A, Bueno M, Garagorri J, Fleta J, Ramos F, Abos MD, Perez-Gonzalez J. Relationship of body fat distribution to metabolic complications in obese prepubertal boys: gender related differences. Acta Paediatr Scand. 1989; 78(3): 440-446.
- 23. Lukaski HC, Johnson PE, Bolonchuk WW, Lykken GI. Assessment of fat-free mass using bioelectrical impedance measurements of the human body. Am J Clin Nutr. 1985; 41(4): 810-817.
- 24. Major chronic disease management business information. Ministry of Health & Welfare. 2010; cited 2011 March 1. Available from http://www.kwdi.re.kr/.
- 25. Insured health promotion business model development. National Health Insurance Corporation. 2009; cited 2011 Jun 1. Available from http://www.nhic.or.kr/portal/site/main/menuitem.
- 26. Oh YA, Shim KW, Lee HS, Lee SW, Kim SA. Correlation between abdominal fat measured by bia and fat. Korean J Clin Geriatr. 2006; 7(2): 225-237.
- 27. Park SY. Nutritional status of anemic adolescent females, screening tools and the effect of nutrition education on improvement of iron status. 2002; graduate school of Catholic University; MS thesis.
- 28. Sharpe JK, Byrne NM, Stedman TJ, Hills AP. Bioelectric impedance is a better indicator of obesity in men with schizophrenia than body mass index. Psychiatry Res. 2008; 159(1-2): 121-126.
- 29. Son SM, Lee JH, Yim KS, Cho YO. Diet & body shaping. 2006; Seoul: Kyomunsa; 17.
- 30. Stamler J. The Intersalt study: background, method, findings, and implications. Am J Clin Nutr. 1997; 65: 2 Suppl. 626S-642S.
- 31. Whitney EN, Pinna K, Rolfes SR. Understanding normal and clinical nutrition. 2002; USA: Wadsworth; 254.
REFERENCES
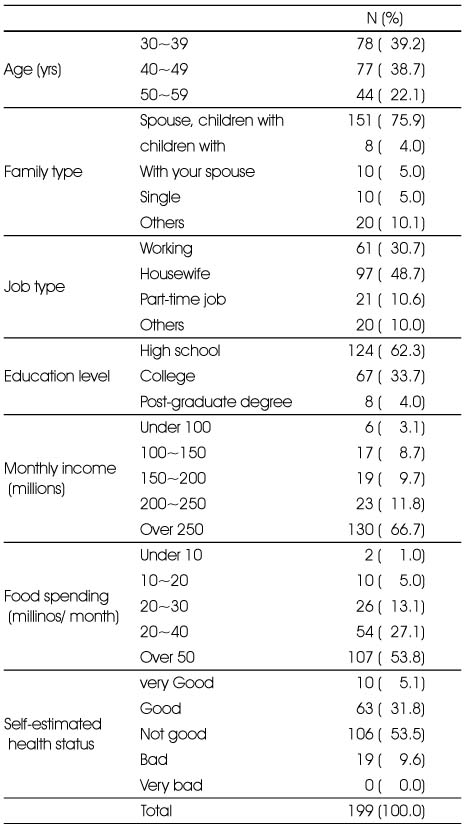
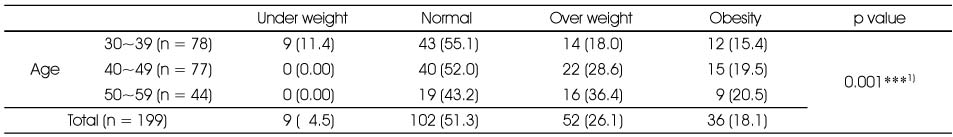
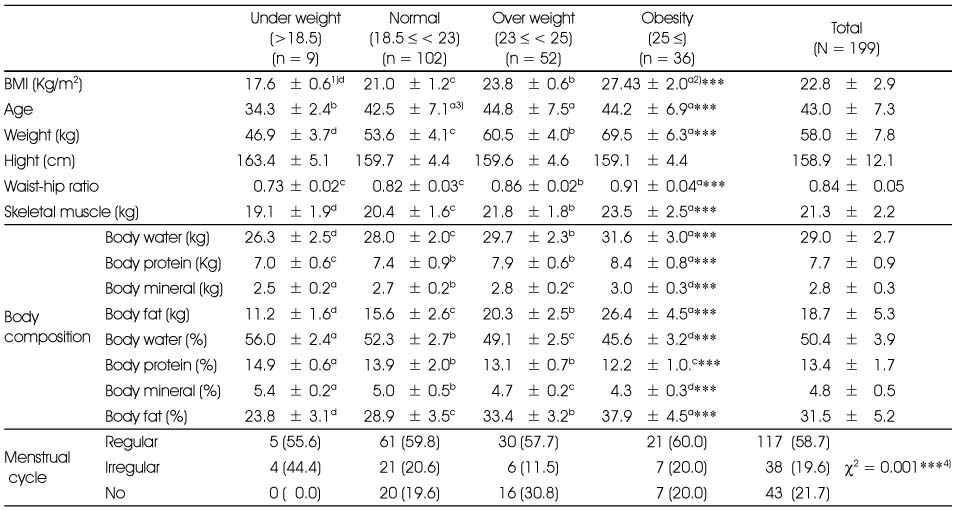
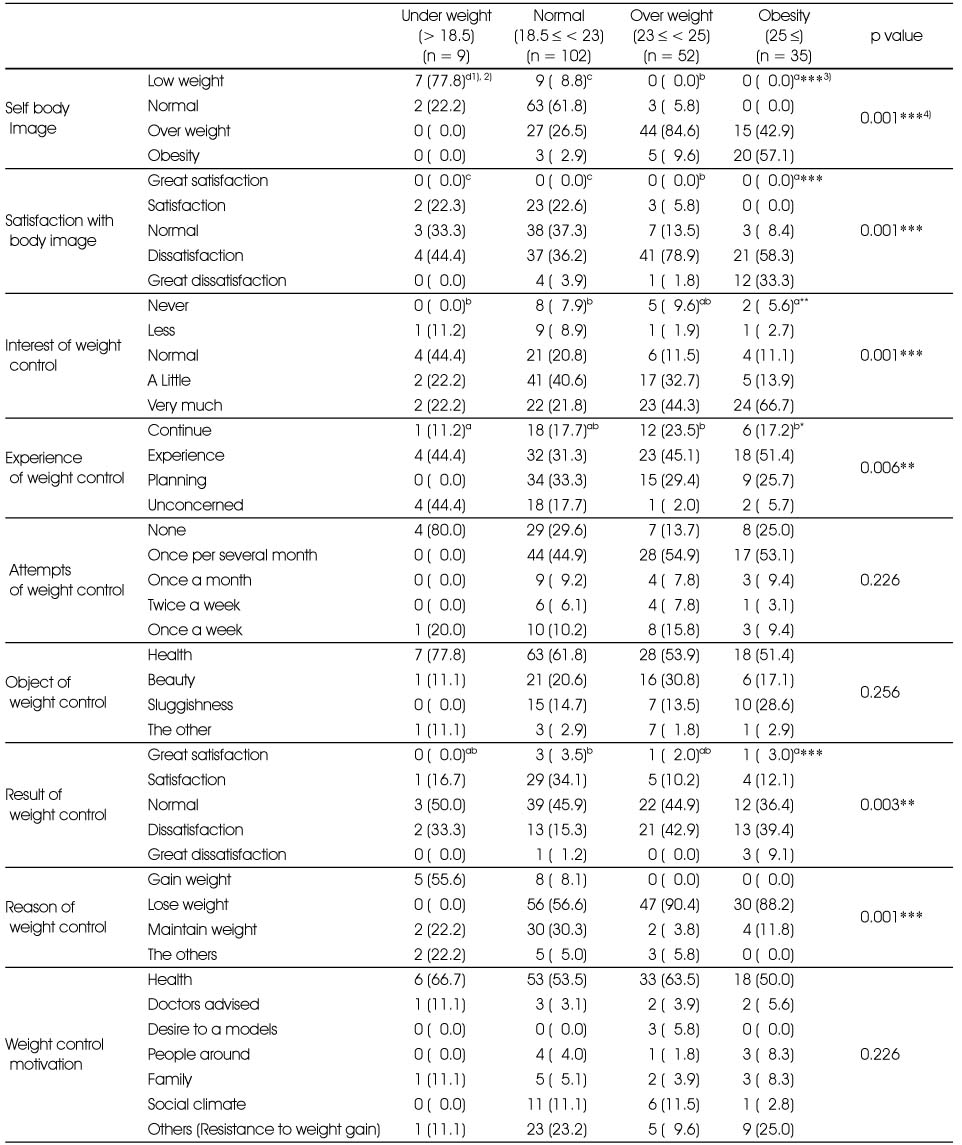
Table 5Mean of Obesity behavior in each group by BMI
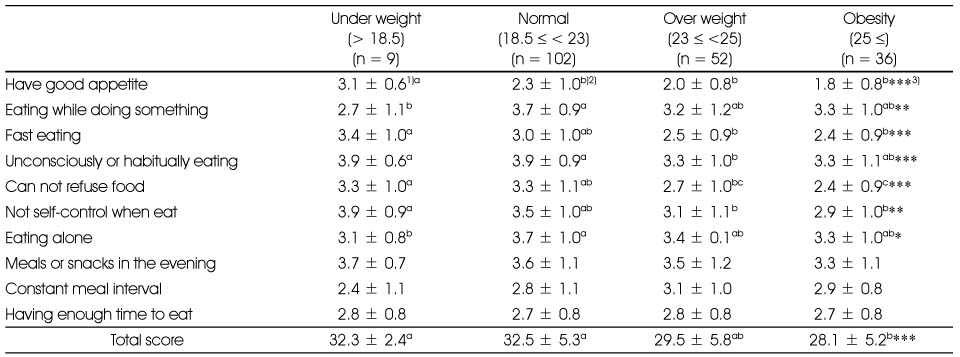
1) The lowes score means having more obesity tendency (Yes : 1, Mostly Yes: 2 Normal: 3, Mostly Not: 4, No: 5)
2) Means with superscripts (a> b) within a row are significantly from each at p = 0.05 by Duncan's multiple range test.
3) Significance as determined by GLM test
*: p < 0.05, **: p < 0.01, ***: p < 0.001
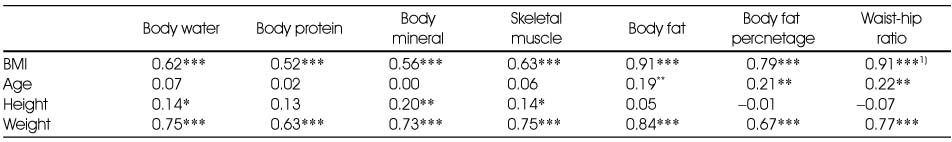
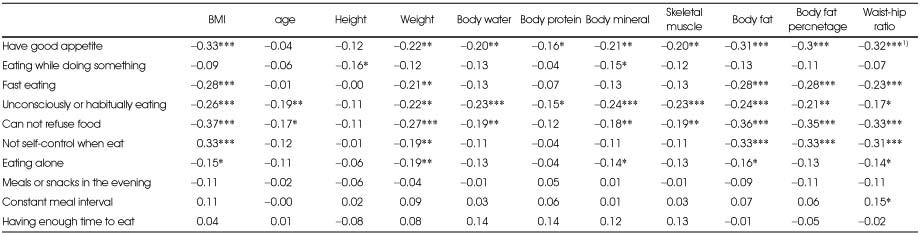
Figure & Data
REFERENCES
Citations
Citations to this article as recorded by 
- Comparison of Health Behaviors and Nutrient Intake according to Work Type among Women Aged 30-60 Years: Using Data from the Korea National Health and Nutrition Survey (2015-2018)
Sol Lee, Bok-Mi Jung
The Korean Journal of Community Living Science.2024; 35(1): 61. CrossRef - Negative emotion‐related eating behaviours in young women with underweight status, overweight status, anorexia nervosa, and bulimia nervosa in Korea
Zhen An, Kyung Hee Kim, Mirihae Kim, Youl‐Ri Kim
European Eating Disorders Review.2022; 30(4): 401. CrossRef - Influence of Different Exercise Types on Health-Related Quality-of-Life in Men With Depressive Disorder in South Korea
Kyungjin Kim, Kyo-Man Koo
Frontiers in Public Health.2022;[Epub] CrossRef - Understanding Body Image and Appearance Management Behaviors Among Adult Women in South Korea Within a Sociocultural Context: A Review
Kathy L. Lin, Vaishali V. Raval
International Perspectives in Psychology.2020; 9(2): 96. CrossRef - Relationships between Obesity, Body Image Perception, and Weight Control in Adult Women
Hyunju Chae
Korean Journal of Women Health Nursing.2019; 25(2): 129. CrossRef - Development of Health Indices and Market Segmentation Strategies for Senior Health Services
Jeong-Hun Shin
Journal of Industrial Distribution & Business.2018; 9(11): 7. CrossRef - Determinants of binge eating disorder among normal weight and overweight female college students in Korea
Youl-Ri Kim, Bo In Hwang, Gi Young Lee, Kyung Hee Kim, Mirihae Kim, Kwang Kee Kim, Janet Treasure
Eating and Weight Disorders - Studies on Anorexia, Bulimia and Obesity.2018; 23(6): 849. CrossRef - Dietary Habits and Nutritional Status of Young Women according to Breakfast Frequency in Seoul
Da-Mee Kim, Youl-Ri Kim, Kyung-Hee Kim
Korean Journal of Community Nutrition.2018; 23(2): 102. CrossRef - Body Image Perception and Eating Behaviors among Male Middle and High School Students according to Weight Status in Seoul
Bo-Mi Kim, Kyung-Hee Kim
Journal of the East Asian Society of Dietary Life.2018; 28(2): 123. CrossRef - Effects of the difference between actual body condition and body image perception on nutrient intake, weight control and mental health in Korean adults: Based on the 5th Korea National Health and Nutrition Examination Survey
Jihyun Seo, Hyesun Ma, Sunghee Kim, Jiyoung Kim, Minseo Shin, Yoon Jung Yang
Journal of Nutrition and Health.2016; 49(3): 153. CrossRef - Health and nutritional status of Korean underweight women in their twenties: Based on the 2010~2012 Korea National Health and Nutrition Examination Survey
Sa Rang Jeong, Sunghee Kim, Yoon Jung Yang
Journal of Nutrition and Health.2016; 49(2): 99. CrossRef - A Study on Weight Control Behaviour, Eating Habits and Health-related Life Habits According to Obesity Degree of University Students in Jeonbuk
Hye-Soon Chang
Korean Journal of Human Ecology.2016; 25(1): 73. CrossRef - Associations between Weight Control Behavior and Health Behaviors in Korean Young Women: 2013 Community Health Survey
Jae-Hee Kim
Journal of the Korea Academia-Industrial cooperation Society.2015; 16(7): 4734. CrossRef - A Study on Weight Control Behaviour, Eating Habits and Health-related Life Habits According to Obesity Degree of Teacher in Jeonbuk Province, Korea
Hye-Soon Chang
Journal of The Korean Society of Food Culture.2015; 30(1): 105. CrossRef - Analysis of Weight Control Behaviors by Body Image Perception among Korean Women in Different Age Groups: Using the 2010 Korea National Health and Nutrition Examination Survey Data
Young-Suk Lim, Na-Ri Park, Su-Bin Jeon, So-Yeon Jeong, Zuunnast Tserendejid, Hae-Ryun Park
Korean Journal of Community Nutrition.2015; 20(2): 141. CrossRef - The Relationship between Obesity Degree and Psychological Factors, Dietary Behaviors and Health-Related Quality of Life in Adult Women in their Twenties in Seoul and Kyungin Area
Sang-Yeon Kim
The Korean Journal of Food And Nutrition.2013; 26(3): 535. CrossRef - A Study on Dietary Behaviors, Health-Related Lifestyle of Adult Visitors at Public Health Centers in Gyeonggi Urban Area
Jong-Sook Kwon, Kyungmin Kim, Hyun-Chang Seo, Yoonna Lee, Seunggeon Lim, Young-Sug Choi
Korean Journal of Community Nutrition.2013; 18(6): 611. CrossRef - Body Mass Index and Weight Loss in Overweight and Obese Korean Women: The Mediating Role of Body Weight Perception
Sunjoo Boo
Asian Nursing Research.2013; 7(4): 191. CrossRef - Analysis of Body Composition, Dietary Behaviors and Life style of 30~50 year old Women Living in Seoul
Jae Ok Koo, Seoyun Park
Korean Journal of Community Nutrition.2012; 17(4): 440. CrossRef
 Cite
CiteAnalysis of BMI, Body Composition, Weight Control, Dietary Behaviors of Adult Women
Analysis of BMI, Body Composition, Weight Control, Dietary Behaviors of Adult Women
General characteristics of the subjects
BMI distribution by age
1) Significance as determined by χ2-test
***: p < 0.001
Anthropometric characteristics of the subjects by BMI
1) Mean ± SD
2) Means with different superscripts (a> b> c> d) within a row are significantly different from each at p = 0.05 by Duncan's multiple range test.
3) Significance as determined by GLM test
4) Significance as determined by χ2-test
***: p<0.001
Weight control in experience, reasons, methods, object and result of each group by BMI
1) N (%)
2) Means with different superscripts (d> c> b> a) within a row are significantly different from each at p = 0.05 by Duncan's multiple range test.
3) Significance as determined by GLM test
4) Significance as determined by χ2-test
**: p < 0.01, ***: p < 0.001
Mean of Obesity behavior in each group by BMI
1) The lowes score means having more obesity tendency (Yes : 1, Mostly Yes: 2 Normal: 3, Mostly Not: 4, No: 5)
2) Means with superscripts (a> b) within a row are significantly from each at p = 0.05 by Duncan's multiple range test.
3) Significance as determined by GLM test
*: p < 0.05, **: p < 0.01, ***: p < 0.001
Correlation coefficients between physical characteristics and bioelectrical impedance analysis
1) Significance as determined by Pearson's correlation coefficient (r)
*: p < 0.05, **: p < 0.01, ***: p < 0.001
Correlation coefficients between obesity behavior and Anthropometric characteristics and body composition analysis
1) Significance as determined by Pearson's correlation coefficient (r)
*: p < 0.05, **: p < 0.01, ***: p < 0.001
Table 1
General characteristics of the subjects
Table 2
BMI distribution by age
1) Significance as determined by χ2-test ***: p < 0.001
Table 3
Anthropometric characteristics of the subjects by BMI
1) Mean ± SD 2) Means with different superscripts (a> b> c> d) within a row are significantly different from each at p = 0.05 by Duncan's multiple range test. 3) Significance as determined by GLM test 4) Significance as determined by χ2-test ***: p<0.001
Table 4
Weight control in experience, reasons, methods, object and result of each group by BMI
1) N (%) 2) Means with different superscripts (d> c> b> a) within a row are significantly different from each at p = 0.05 by Duncan's multiple range test. 3) Significance as determined by GLM test 4) Significance as determined by χ2-test **: p < 0.01, ***: p < 0.001
Table 5
Mean of Obesity behavior in each group by BMI
1) The lowes score means having more obesity tendency (Yes : 1, Mostly Yes: 2 Normal: 3, Mostly Not: 4, No: 5) 2) Means with superscripts (a> b) within a row are significantly from each at p = 0.05 by Duncan's multiple range test. 3) Significance as determined by GLM test *: p < 0.05, **: p < 0.01, ***: p < 0.001
Table 6
Correlation coefficients between physical characteristics and bioelectrical impedance analysis
1) Significance as determined by Pearson's correlation coefficient (r) *: p < 0.05, **: p < 0.01, ***: p < 0.001
Table 7
Correlation coefficients between obesity behavior and Anthropometric characteristics and body composition analysis
1) Significance as determined by Pearson's correlation coefficient (r) *: p < 0.05, **: p < 0.01, ***: p < 0.001


