
Articles
- Page Path
- HOME > Korean J Community Nutr > Volume 23(1); 2018 > Article
-
Research Article
- Association between Sodium Excretion and Obesity of Adults in Gwangju
-
Mijin Jo, Young-Ran Heo

-
Korean Journal of Community Nutrition 2018;23(1):38-47.
DOI: https://doi.org/10.5720/kjcn.2018.23.1.38
Published online: February 28, 2018
1Department of Food and Nutrition, Chonnam National University Graduate School, Gwangju, Korea.
2Division of Food and Nutrition, Research Institute for Human Ecology, Chonnam National University, Gwangju, Korea.
- Corresponding author: Young-Ran Heo. Division of Food and Nutrition, Research Institute for Human Ecology, Chonnam National University, 77 Yongbongro, Buk-gu, Gwangju, Korea. Tel: (062) 530-1338, Fax: (062) 530-1339, yrhuh@jnu.ac.kr
• Received: January 31, 2018 • Revised: February 14, 2018 • Accepted: February 14, 2018
Copyright © 2018 The Korean Society of Community Nutrition
This is an Open-Access article distributed under the terms of the Creative Commons Attribution Non-Commercial License (http://creativecommons.org/licenses/by-nc/3.0/) which permits unrestricted non-commercial use, distribution, and reproduction in any medium, provided the original work is properly cited.
- 1,633 Views
- 1 Download
- 1 Crossref
Abstract
-
Purpose
- The aim of this study was to analyze the association between sodium excretion and obesity for healthy adults in the Gwangju area.
-
Methods
- The participants included 80 healthy adults aged 19 to 69 years in Gwangju. The dietary intake and sodium excretion were obtained using the 24-hour recall method and 24 hour urine collection. The participants were classified into two groups according to the amount of urinary sodium excretion: (≤ 141.75 mmol/dL, > 141.75 mmol/dL).
-
Results
- After adjusting for sex, age, smoking history, and income, the high excretion of sodium group was significantly higher for weight, body mass index, body fat mass, percent body fat, visceral fat area (VFA), waist circumference, hip circumference, and WHR. The energy and nutrients intake were significant after adjusting for sex, age, smoking history, and income. The LSE group had a significantly higher fat intake and Na/K intake ratio. The HSE group had significantly higher fiber intake, and K intake. As the amount of urinary sodium excretion increased, the risk of obesity before correction was 3.57 (95% CI: 1.13–11.25) times greater, and the risk of obesity of T3 increased significantly by 3.33 times (95% CI: 1.05–10.59). After correcting for sex and age, the obesity risk of T2 increased significantly by 4.23 times (95% CI: 1.11–16.06), and after correcting for sex, age, smoking history, and income, the obesity risk of T2 increased significantly by 6.81 times (95% CI: 1.44–32.19) the risk of obesity.
-
Conclusions
- An association exists between sodium excretion and obesity in Korean adults. In this study, the high excretion of sodium group was obese and the risk of obesity was higher than the low excretion of sodium group.
Acknowledgments
Acknowledgments
- 1. Song HJ, Cho YG, Lee HJ. Dietary sodium intake and prevalence of overweight in adults. Metabolism 2013; 62(5): 703-708.ArticlePubMed
- 2. Kang JS, Kim HS. A study on the evaluation of a nutritional education program for the middle aged obese women. Korean J Food Nutr 2004; 17(4): 356-367.
- 3. WHO. Fact sheets in obesity [Internet]. WHO; 2014; cited 2017 Oct 15]. Available from: http://www.wpro.who.int/mediacentre/factsheets/obesity/en/.
- 4. Prevalence of obesity [Internet]. Ministry of Health & Welfare; 2016; cited 2017 Oct 15]. Available from: http://www.index.go.kr/potal/main/EachDtlPageDetail.do?idx_cd=2705.
- 5. Lew EA, AM F. Mortality and weight: insured lives and the American Cancer Society studies. Women 1985; 80(1.20): 1-19.Article
- 6. Hida K, Wada J, Eguchi J, Zhang H, Baba M, Seida A, et al. Visceral adipose tissue-derived serine protease inhibitor: a unique insulin-sensitizing adipocytokine in obesity. Proc Natl Acad Sci USA 2005; 102(30): 10610-10615.ArticlePubMedPMC
- 7. Kunitomi M, Wada J, Takahashi K, Tsuchiyama Y, Mimura Y, Hida K, et al. Relationship between reduced serum IGF-I levels and accumulation of visceral fat in Japanese men. Int J Obes Relat Metab Disord 2002; 26(3): 361-369.ArticlePubMedPDF
- 8. Flachs P, Mohamed-Ali V, Horakova O, Rossmeisl M, Hosseinzadeh-Attar MJ, Hensler M, et al. Polyunsaturated fatty acids of marine origin induce adiponectin in mice fed a high-fat diet. Diabetologia 2006; 49(2): 394-397.ArticlePubMedPDF
- 9. Park JA, Yoon JS. Dietary behaviors and status of nutrient intakes by the obesity levels of housewives in Daegu. Korean J Community Nutr 2005; 10(5): 623-632.
- 10. Cheon SY, Wang HW, Lee HJ, Hwang KM, Yoon HS, Kang YJ. Relationship of sodium consumption with obesity in Korean adults based on Korea National Health and Nutrition Examination Survey 2010~2014. J Nutr Health 2017; 50(1): 64-73.ArticleLink
- 11. He FJ, Marrero NM, MacGregor GA. Salt intake is related to soft drink consumption in children and adolescents a link to obesity? Hypertension 2008; 51(3): 629-634.ArticlePubMed
- 12. Grimes CA, Riddell LJ, Campbell KJ, Nowson CA. Dietary salt intake, sugar-sweetened beverage consumption, and obesity risk. Pediatrics 2013; 131(1): 14-21.ArticlePubMedPDF
- 13. Libuda L, Kersting M, Alexy U. Consumption of dietary salt measured by urinary sodium excretion and its association with body weight status in healthy children and adolescents. Public Health Nutr 2012; 15(3): 433-441.ArticlePubMed
- 14. Hoffmann IS, Cubeddu LX. Salt and the metabolic syndrome. Nutr Metab Cardiovasc Dis 2009; 19(2): 123-128.ArticlePubMed
- 15. Ma Y, He FJ, MacGregor GA. High salt intake independent risk factor for obesity? Hypertension 2015; 66(4): 843-849.ArticlePubMed
- 16. Choi HM, Kim JH, Lee JH, Kim CI, Song GH, Jang GJ, et al. Nutrition. 4th ed. Paju: Kyomunsa; 2012. p. 316-317.
- 17. Simon G. Experimental evidence for blood pressure-independent vascular effects of high sodium diet. Am J hypertens 2003; 16(12): 1074-1078.ArticlePubMed
- 18. de Wardener HE, MacGregor GA. Harmful effects of dietary salt in addition to hypertension. J Hum Hypertens 2002; 16(4): 213-223.ArticlePubMedPDF
- 19. Nagata C, Takatsuka N, Shimizu N, Shimizu H. Sodium intake and risk of death from stroke in Japanese men and women. Stroke 2004; 35(7): 1543-1547.ArticlePubMed
- 20. Tsugane S. Salt, salted food intake, and risk of gastric cancer: Epidemiologic evidence. Cancer Sci 2005; 96(1): 1-6.ArticlePubMedPMC
- 21. Itoh R, Suyama Y, Oguma Y, Yokota F. Dietary sodium, an independent determinant for urinary deoxypyridinoline in elderly women. A cross-sectional study on the effect of dietary factors on deoxypyridinoline excretion in 24-h urine specimens from 763 free-living healthy Japanese. Eur J Clin Nutr 1999; 53(11): 886-890.ArticlePubMedPDF
- 22. Yoon JS, Lee MJ. Calcium status and bone mineral density by the level of sodium intake in young women. Korean J Community Nutr 2013; 18(2): 125-133.Article
- 23. He FJ, Marrero N, MacGregor GA. Salt intake is related to soft drink consumption in children and adolescents: a link to obesity? Hypertension 2008; 51(3): 629-634.ArticlePubMed
- 24. Larsen SC, Ängquist L, Sørensen TI, Heitmann BL. 24h urinary sodium excretion and subsequent change in weight, waist circumference and body composition. PloS one 2013; 8(7): e69689.ArticlePubMedPMC
- 25. Yoon YS, Oh SW. Sodium density and obesity: the Korea National Health and Nutrition Examination Survey 2007–2010. Eur J Clin Nutr 2013; 67(2): 141-146.ArticlePubMedPDF
- 26. Gibson S, Neate D. Sugar intake, soft drink consumption and body weight among British children: further analysis of National Diet and Nutrition Survey data with adjustment for under-reporting and physical activity. Int J Food Sci Nutr 2007; 58(6): 445-460.ArticlePubMed
- 27. Kim HH, Lee YK. Analysis of presumed sodium intake of office workers using 24-hour urine analysis and correlation matrix between variables. Korean J Nutr 2013; 46(1): 26-33.Article
- 28. Seo JS, Lee JH, Yoon JS, Cho SH, Choi YS. Nutritional Assessment. 3rd ed. Goyang: Powerbook; 2011. p. 101-135.
- 29. Bailey RL, Mitchell DC, Miller C, Smiciklas-Wright H. Assessing the effect of underreporting energy intake on dietary patterns and weight status. J Am Diet Assoc 2007; 107(1): 64-71.ArticlePubMed
- 30. Tanaka T, Okamura T, Miura K, Kadowaki T, Ueshima H, Nakagawa H, Hashimoto T. A simple method to estimate populational 24 hour urinary sodium and potassium excretion using a casual urine specimen. J Hum Hypertens 2002; 16(2): 97-103.ArticlePubMedPDF
- 31. Kirkendall WM, Connor WE, Abboud F, Rastogi SP, Anderson TA, Fry M. The effect of dietary sodium chloride on blood pressure, body fluids, electrolytes, renal function, and serum lipids of normotensive man. J Lab Clin Med 1976; 87(3): 411-434.
- 32. Espeland MA, Kumanyika S, Wilson AC, Reboussin DM, Easter L, Self M. Statistical issues in analyzing 24-hour dietary recall and 24-hour urine collection data for sodium and potassium intakes. Am J Epidemiol 2001; 153(10): 996-1006.ArticlePubMed
- 33. Blackburn GL, Bistrian BR, Maini BS, Schlamm HT, Smith MF. Nutritional and metabolic assessment of the hospitalized patient. JPEN J Parenter Enteral Nutr 1977; 1(1): 11-21.ArticlePubMed
- 34. Nam GE, Kim SM, Choi MK, Heo YR, Hyun TS, Lyu ES, et al. Association between 24-hour urinary sodium excretion and obesity in Korean adults: a multi-center study. Nutrition 2017; 41: 113-119.ArticlePubMed
- 35. Park NY. Association of smoking with salt taste preference, sodium intake, and the risk of metabolic syndrome in Korean men: a community-based longitudinal study (2001~2010) [master's thesis]. Chungbuk National University; 2015.
- 36. Stevens JC, Cruz LA, Hoffman JM, Patterson MQ. Taste sensitivity and aging: high incidence of decline revealed by repeated threshold measures. Chem Senses 1995; 20(4): 451-459.ArticlePubMed
- 37. Nordin S, Razani LJ, Markison S, Murphy C. Age-associated increases in intensity discrimination for taste. Exp Aging Res 2003; 29(3): 371-381.ArticlePubMed
- 38. Kim MK, Han JI, Chung YJ. Dietary behavior related to salty food intake of adults living in a rural area according to saline sensitivity. Korean J Nutr 2011; 44(6): 537-550.Article
- 39. Lee MS. Association between preferences of salty food and acuity and preferences of taste of the elderly people living in rural area. Korean J Community Nutr 2013; 18(3): 223-232.Article
- 40. Kim MG, Kim KY, Nam HM, Hong NS, Lee YM. The relationship between lifestyle and sodium intake in Korean middle-aged workers. J Korea Acad Ind Coop Soc 2014; 15(5): 2923-2929.Article
- 41. Oh HW, Kim HJ, Jun DW, Lee SM. Associations between 24-hour Urine sodium excretion level and obesity-related metabolic risk factors. Korean J Community Nutr 2015; 20(6): 460-467.Article
- 42. Park HS, Oh SW, Gang JH, Park YW, Choi JM, Kim YS, et al. Prevalence and associated factors with metabolic syndrome in South Korea: from the Korean National Health and Nutrition Examination Survey, 1998. Korean J Obes 2003; 12(1): 1-14.
- 43. Roos JC, Koomans HA, Dorhout-Mees EJ, Delawi IMK. Renal sodium handling in normal humans subjected to low, normal, and extremely high sodium supplies. Am J Physiol 1985; 249(6 Pt 2): F941-F947.ArticlePubMed
- 44. Park YH, Chung SJ. A comparison of sources of sodium and potassium intake by gender, age and regions in Koreans: Korea National Health and Nutrition Examination Survey (KNHANES) 2010–2012. Korean J Community Nutr 2016; 21(6): 558-573.ArticleLink
- 45. Clark AJ, Mossholder S. Sodium and potassium intake measurements: dietary methodology problems. Am J Clin Nutr 1986; 43(3): 470-476.ArticlePubMed
- 46. Lim HJ. A study on the sodium and potassium intakes and urinary excretion of adults in Busan. Korean J Community Nutr 2012; 17(6): 737-751.Article
- 47. Cocores JA, Gold MS. The Salted Food Addiction Hypothesis may explain overeating and the obesity epidemic. Med hypotheses 2009; 73(6): 892-899.ArticlePubMed
- 48. Kim HJ. Sodium intake status in Korea and plan for improvement of sodium intake estimation in the Korea National Health and Nutrition Examination Survey (KNHANES). Public Health Wkly Rep 2014; 7(20): 425-430.
REFERENCES
Table 1
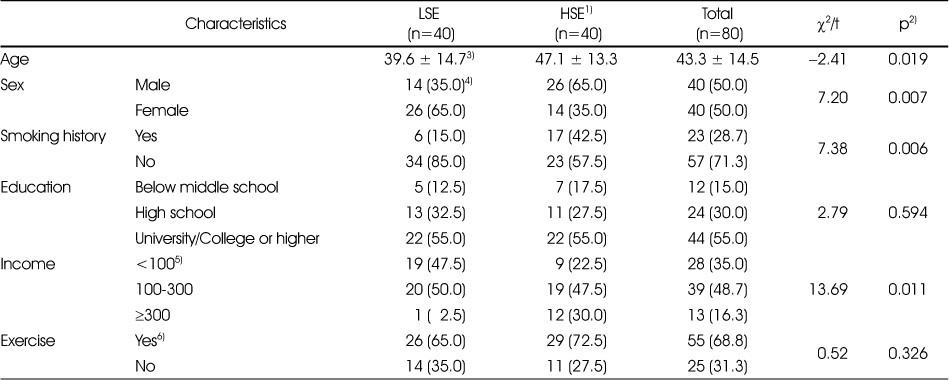
General characteristics of the subjects according to 24-hour urinary sodium excretion
1) LSE: low 24-urinary sodium excretion group (≤141.75 mmol/dL), HSE: high 24-urinary sodium excretion group (>141.75 mmol/dL)
2) By t-test and chi-square test. A value of p<0.05 was accepted as significant.
3) Values are presented as mean ± standard deviation. The unit of the value is years.
4) Values are presented as n (%).
5) Salary is a standard (monthly income), and the unit is ten thousand won.
6) “Yes” of exercise is case of moderate activity or intensive activities once a week for more than 10 minutes.
Table 2
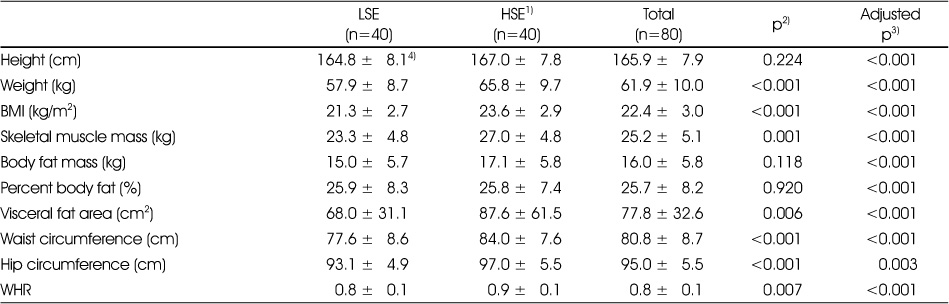
Anthropometric assessments and obesity index according to 24-hour urinary sodium excretion
1) LSE: low 24-urinary sodium excretion group (≤141.75 mmol/dL), HSE: high 24-urinary sodium excretion group (>141.75 mmol/dL)
2) By t-test analysis. A value of p<0.05 was accepted as significant.
3) By t-test analysis adjusted for age, sex, smoking history and income. A value of p<0.05 was accepted as significant.
4) Values are presented as mean ± standard deviation.
BMI: Body Mass Index, WHR: Waist-Hip Circumference Ratio
Table 3
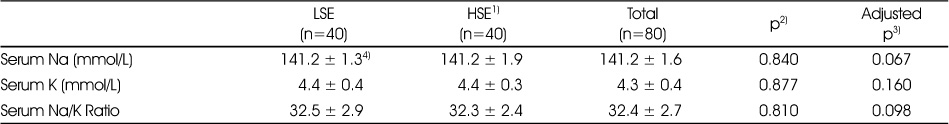
Na level, K level and Na/K ratio in serum according to 24-hour urinary sodium excretion
1) LSE: low 24-urinary sodium excretion group (≤141.75 mmol/dL), HSE: high 24-urinary sodium excretion group (>141.75 mmol/dL)
2) By t-test analysis. A value of p<0.05 was accepted as significant.
3) By t-test analysis adjusted for age, sex, smoking history and income. A value of p<0.05 was accepted as significant.
4) Values are presented as mean ± standard deviation.
Table 4
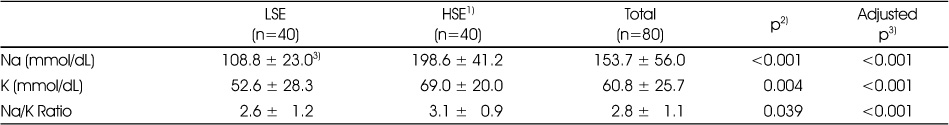
Na level, K level and Na/K ratio in urine according to 24-hour urinary sodium excretion
1) LSE: low 24-urinary sodium excretion group (≤141.75 mmol/dL), HSE: high 24-urinary sodium excretion group (>141.75 mmol/dL)
2) By t-test analysis. A value of p<0.05 was accepted as significant.
3) By t-test analysis adjusted for age, sex, smoking history and income. A value of p<0.05 was accepted as significant.
4) Values are presented as mean ± standard deviation.
Table 5
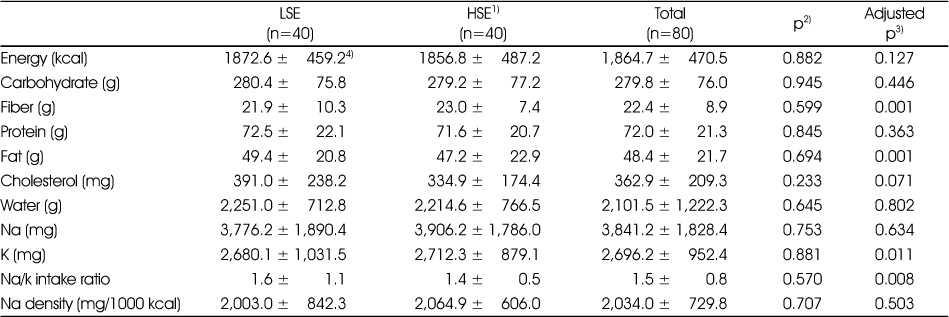
Energy and nutrients intake according to 24-hour urinary sodium excretion
1) LSE: low 24-urinary sodium excretion group (≤141.75 mmol/dL), HSE: high 24-urinary sodium excretion group (>141.75 mmol/dL)
2) By t-test analysis. A value of p<0.05 was accepted as significant.
3) By t-test analysis adjusted for age, sex, smoking history and income. A value of p<0.05 was accepted as significant.
4) Values are presented as mean ± standard deviation.
Table 6
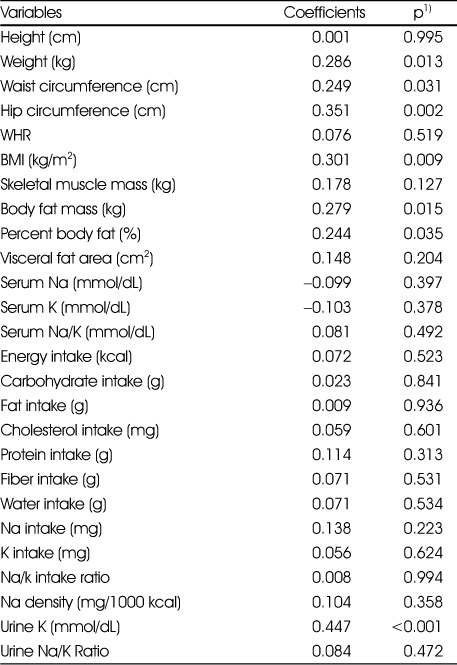
Correlation between 24-hour urinary sodium excretion and variables
1) Anthropometric, Na and K level in serum and urine were adjusted for age, sex, smoking history and income by Partial correlation coefficients.
Energy and nutrients intake by Pearson's correlation coefficients.
A value of P<0.05 was accepted as significant.
BMI: Body Mass Index, WHR: Waist-Hip Circumference Ratio
Table 7
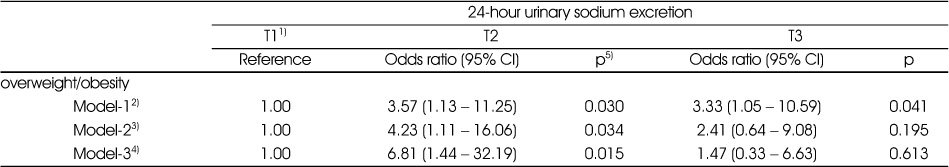
Association between obesity and sodium excretion according to 24-hour urinary sodium excretion
1) T1: Lower tertile of 24-hour urinary sodium excretion, T2: Middle tertile of 24-hour urinary sodium excretion, T3: Upper tertile of 24-hour urinary sodium excretion
2) Model-1: unadjusted
3) Model-2: adjusted for age and sex
4) Model-3: adjusted for age, sex, smoking history and income
5) By multiple logistic regression analysis. A value of p<0.05 was accepted as significant
Figure & Data
REFERENCES
Citations
Citations to this article as recorded by 
- Preventive Effects of Whole Grain Cereals on Sarcopenic Obesity in High-fat Diet-induced Obese Mice
Mi-Bo Kim, Sein Lee, Changhee Kim, Jae-Kwan Hwang
Food Engineering Progress.2018; 22(4): 358. CrossRef
 Cite
CiteAssociation between Sodium Excretion and Obesity of Adults in Gwangju
Association between Sodium Excretion and Obesity of Adults in Gwangju
General characteristics of the subjects according to 24-hour urinary sodium excretion
1) LSE: low 24-urinary sodium excretion group (≤141.75 mmol/dL), HSE: high 24-urinary sodium excretion group (>141.75 mmol/dL)
2) By t-test and chi-square test. A value of p<0.05 was accepted as significant.
3) Values are presented as mean ± standard deviation. The unit of the value is years.
4) Values are presented as n (%).
5) Salary is a standard (monthly income), and the unit is ten thousand won.
6) “Yes” of exercise is case of moderate activity or intensive activities once a week for more than 10 minutes.
Anthropometric assessments and obesity index according to 24-hour urinary sodium excretion
1) LSE: low 24-urinary sodium excretion group (≤141.75 mmol/dL), HSE: high 24-urinary sodium excretion group (>141.75 mmol/dL)
2) By t-test analysis. A value of p<0.05 was accepted as significant.
3) By t-test analysis adjusted for age, sex, smoking history and income. A value of p<0.05 was accepted as significant.
4) Values are presented as mean ± standard deviation.
BMI: Body Mass Index, WHR: Waist-Hip Circumference Ratio
Na level, K level and Na/K ratio in serum according to 24-hour urinary sodium excretion
1) LSE: low 24-urinary sodium excretion group (≤141.75 mmol/dL), HSE: high 24-urinary sodium excretion group (>141.75 mmol/dL)
2) By t-test analysis. A value of p<0.05 was accepted as significant.
3) By t-test analysis adjusted for age, sex, smoking history and income. A value of p<0.05 was accepted as significant.
4) Values are presented as mean ± standard deviation.
Na level, K level and Na/K ratio in urine according to 24-hour urinary sodium excretion
1) LSE: low 24-urinary sodium excretion group (≤141.75 mmol/dL), HSE: high 24-urinary sodium excretion group (>141.75 mmol/dL)
2) By t-test analysis. A value of p<0.05 was accepted as significant.
3) By t-test analysis adjusted for age, sex, smoking history and income. A value of p<0.05 was accepted as significant.
4) Values are presented as mean ± standard deviation.
Energy and nutrients intake according to 24-hour urinary sodium excretion
1) LSE: low 24-urinary sodium excretion group (≤141.75 mmol/dL), HSE: high 24-urinary sodium excretion group (>141.75 mmol/dL)
2) By t-test analysis. A value of p<0.05 was accepted as significant.
3) By t-test analysis adjusted for age, sex, smoking history and income. A value of p<0.05 was accepted as significant.
4) Values are presented as mean ± standard deviation.
Correlation between 24-hour urinary sodium excretion and variables
1) Anthropometric, Na and K level in serum and urine were adjusted for age, sex, smoking history and income by Partial correlation coefficients.
Energy and nutrients intake by Pearson's correlation coefficients.
A value of P<0.05 was accepted as significant.
BMI: Body Mass Index, WHR: Waist-Hip Circumference Ratio
Association between obesity and sodium excretion according to 24-hour urinary sodium excretion
1) T1: Lower tertile of 24-hour urinary sodium excretion, T2: Middle tertile of 24-hour urinary sodium excretion, T3: Upper tertile of 24-hour urinary sodium excretion
2) Model-1: unadjusted
3) Model-2: adjusted for age and sex
4) Model-3: adjusted for age, sex, smoking history and income
5) By multiple logistic regression analysis. A value of p<0.05 was accepted as significant
Table 1
General characteristics of the subjects according to 24-hour urinary sodium excretion
1) LSE: low 24-urinary sodium excretion group (≤141.75 mmol/dL), HSE: high 24-urinary sodium excretion group (>141.75 mmol/dL) 2) By t-test and chi-square test. A value of p<0.05 was accepted as significant. 3) Values are presented as mean ± standard deviation. The unit of the value is years. 4) Values are presented as n (%). 5) Salary is a standard (monthly income), and the unit is ten thousand won. 6) “Yes” of exercise is case of moderate activity or intensive activities once a week for more than 10 minutes.
Table 2
Anthropometric assessments and obesity index according to 24-hour urinary sodium excretion
1) LSE: low 24-urinary sodium excretion group (≤141.75 mmol/dL), HSE: high 24-urinary sodium excretion group (>141.75 mmol/dL) 2) By t-test analysis. A value of p<0.05 was accepted as significant. 3) By t-test analysis adjusted for age, sex, smoking history and income. A value of p<0.05 was accepted as significant. 4) Values are presented as mean ± standard deviation. BMI: Body Mass Index, WHR: Waist-Hip Circumference Ratio
Table 3
Na level, K level and Na/K ratio in serum according to 24-hour urinary sodium excretion
1) LSE: low 24-urinary sodium excretion group (≤141.75 mmol/dL), HSE: high 24-urinary sodium excretion group (>141.75 mmol/dL) 2) By t-test analysis. A value of p<0.05 was accepted as significant. 3) By t-test analysis adjusted for age, sex, smoking history and income. A value of p<0.05 was accepted as significant. 4) Values are presented as mean ± standard deviation.
Table 4
Na level, K level and Na/K ratio in urine according to 24-hour urinary sodium excretion
1) LSE: low 24-urinary sodium excretion group (≤141.75 mmol/dL), HSE: high 24-urinary sodium excretion group (>141.75 mmol/dL) 2) By t-test analysis. A value of p<0.05 was accepted as significant. 3) By t-test analysis adjusted for age, sex, smoking history and income. A value of p<0.05 was accepted as significant. 4) Values are presented as mean ± standard deviation.
Table 5
Energy and nutrients intake according to 24-hour urinary sodium excretion
1) LSE: low 24-urinary sodium excretion group (≤141.75 mmol/dL), HSE: high 24-urinary sodium excretion group (>141.75 mmol/dL) 2) By t-test analysis. A value of p<0.05 was accepted as significant. 3) By t-test analysis adjusted for age, sex, smoking history and income. A value of p<0.05 was accepted as significant. 4) Values are presented as mean ± standard deviation.
Table 6
Correlation between 24-hour urinary sodium excretion and variables
1) Anthropometric, Na and K level in serum and urine were adjusted for age, sex, smoking history and income by Partial correlation coefficients. Energy and nutrients intake by Pearson's correlation coefficients. A value of BMI: Body Mass Index, WHR: Waist-Hip Circumference Ratio
Table 7
Association between obesity and sodium excretion according to 24-hour urinary sodium excretion
1) T1: Lower tertile of 24-hour urinary sodium excretion, T2: Middle tertile of 24-hour urinary sodium excretion, T3: Upper tertile of 24-hour urinary sodium excretion 2) Model-1: unadjusted 3) Model-2: adjusted for age and sex 4) Model-3: adjusted for age, sex, smoking history and income 5) By multiple logistic regression analysis. A value of p<0.05 was accepted as significant


