Articles
- Page Path
- HOME > Korean J Community Nutr > Volume 23(1); 2018 > Article
-
Research Article
- Association between Sodium Excretion and Obesity of Adults in Gwangju
-
Mijin Jo, Young-Ran Heo

-
Korean Journal of Community Nutrition 2018;23(1):38-47.
DOI: https://doi.org/10.5720/kjcn.2018.23.1.38
Published online: February 28, 2018
1Department of Food and Nutrition, Chonnam National University Graduate School, Gwangju, Korea.
2Division of Food and Nutrition, Research Institute for Human Ecology, Chonnam National University, Gwangju, Korea.
- Corresponding author: Young-Ran Heo. Division of Food and Nutrition, Research Institute for Human Ecology, Chonnam National University, 77 Yongbongro, Buk-gu, Gwangju, Korea. Tel: (062) 530-1338, Fax: (062) 530-1339, yrhuh@jnu.ac.kr
Copyright © 2018 The Korean Society of Community Nutrition
This is an Open-Access article distributed under the terms of the Creative Commons Attribution Non-Commercial License (http://creativecommons.org/licenses/by-nc/3.0/) which permits unrestricted non-commercial use, distribution, and reproduction in any medium, provided the original work is properly cited.
- 1,102 Views
- 1 Download
- 1 Crossref
Figure & Data
REFERENCES
Citations

- Preventive Effects of Whole Grain Cereals on Sarcopenic Obesity in High-fat Diet-induced Obese Mice
Mi-Bo Kim, Sein Lee, Changhee Kim, Jae-Kwan Hwang
Food Engineering Progress.2018; 22(4): 358. CrossRef
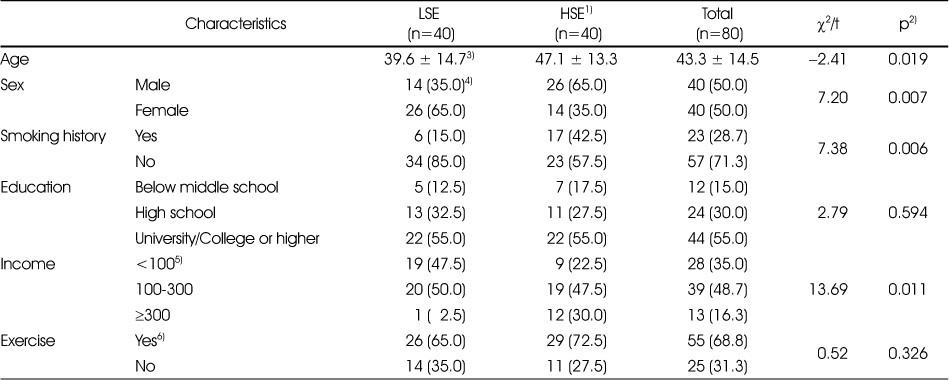
General characteristics of the subjects according to 24-hour urinary sodium excretion
1) LSE: low 24-urinary sodium excretion group (≤141.75 mmol/dL), HSE: high 24-urinary sodium excretion group (>141.75 mmol/dL)
2) By t-test and chi-square test. A value of p<0.05 was accepted as significant.
3) Values are presented as mean ± standard deviation. The unit of the value is years.
4) Values are presented as n (%).
5) Salary is a standard (monthly income), and the unit is ten thousand won.
6) “Yes” of exercise is case of moderate activity or intensive activities once a week for more than 10 minutes.
Anthropometric assessments and obesity index according to 24-hour urinary sodium excretion
1) LSE: low 24-urinary sodium excretion group (≤141.75 mmol/dL), HSE: high 24-urinary sodium excretion group (>141.75 mmol/dL)
2) By t-test analysis. A value of p<0.05 was accepted as significant.
3) By t-test analysis adjusted for age, sex, smoking history and income. A value of p<0.05 was accepted as significant.
4) Values are presented as mean ± standard deviation.
BMI: Body Mass Index, WHR: Waist-Hip Circumference Ratio
Na level, K level and Na/K ratio in serum according to 24-hour urinary sodium excretion
1) LSE: low 24-urinary sodium excretion group (≤141.75 mmol/dL), HSE: high 24-urinary sodium excretion group (>141.75 mmol/dL)
2) By t-test analysis. A value of p<0.05 was accepted as significant.
3) By t-test analysis adjusted for age, sex, smoking history and income. A value of p<0.05 was accepted as significant.
4) Values are presented as mean ± standard deviation.
Na level, K level and Na/K ratio in urine according to 24-hour urinary sodium excretion
1) LSE: low 24-urinary sodium excretion group (≤141.75 mmol/dL), HSE: high 24-urinary sodium excretion group (>141.75 mmol/dL)
2) By t-test analysis. A value of p<0.05 was accepted as significant.
3) By t-test analysis adjusted for age, sex, smoking history and income. A value of p<0.05 was accepted as significant.
4) Values are presented as mean ± standard deviation.
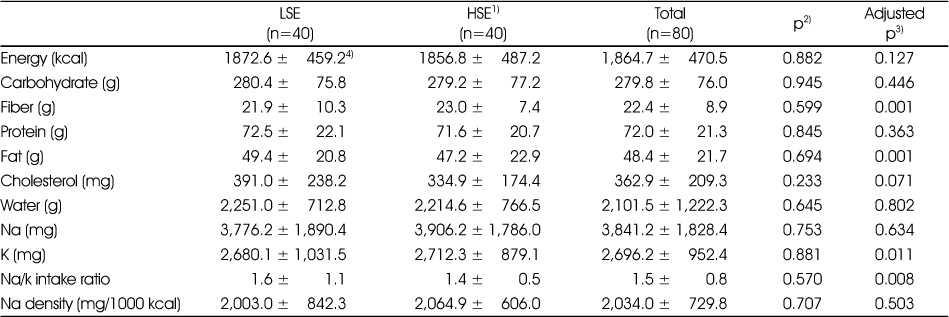
Energy and nutrients intake according to 24-hour urinary sodium excretion
1) LSE: low 24-urinary sodium excretion group (≤141.75 mmol/dL), HSE: high 24-urinary sodium excretion group (>141.75 mmol/dL)
2) By t-test analysis. A value of p<0.05 was accepted as significant.
3) By t-test analysis adjusted for age, sex, smoking history and income. A value of p<0.05 was accepted as significant.
4) Values are presented as mean ± standard deviation.
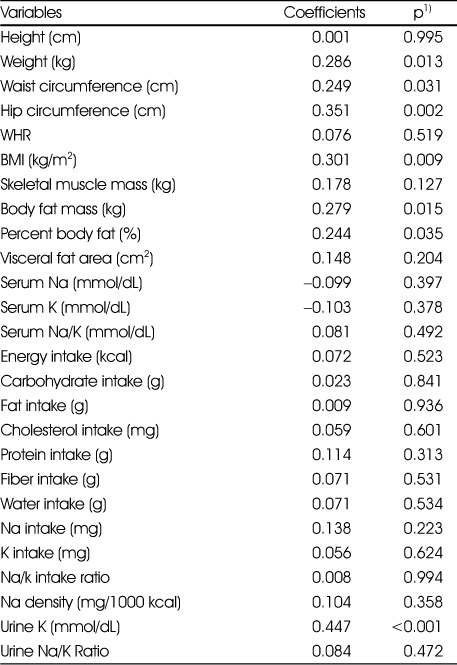
Correlation between 24-hour urinary sodium excretion and variables
1) Anthropometric, Na and K level in serum and urine were adjusted for age, sex, smoking history and income by Partial correlation coefficients.
Energy and nutrients intake by Pearson's correlation coefficients.
A value of P<0.05 was accepted as significant.
BMI: Body Mass Index, WHR: Waist-Hip Circumference Ratio
Association between obesity and sodium excretion according to 24-hour urinary sodium excretion
1) T1: Lower tertile of 24-hour urinary sodium excretion, T2: Middle tertile of 24-hour urinary sodium excretion, T3: Upper tertile of 24-hour urinary sodium excretion
2) Model-1: unadjusted
3) Model-2: adjusted for age and sex
4) Model-3: adjusted for age, sex, smoking history and income
5) By multiple logistic regression analysis. A value of p<0.05 was accepted as significant
1) LSE: low 24-urinary sodium excretion group (≤141.75 mmol/dL), HSE: high 24-urinary sodium excretion group (>141.75 mmol/dL) 2) By t-test and chi-square test. A value of p<0.05 was accepted as significant. 3) Values are presented as mean ± standard deviation. The unit of the value is years. 4) Values are presented as n (%). 5) Salary is a standard (monthly income), and the unit is ten thousand won. 6) “Yes” of exercise is case of moderate activity or intensive activities once a week for more than 10 minutes.
1) LSE: low 24-urinary sodium excretion group (≤141.75 mmol/dL), HSE: high 24-urinary sodium excretion group (>141.75 mmol/dL) 2) By t-test analysis. A value of p<0.05 was accepted as significant. 3) By t-test analysis adjusted for age, sex, smoking history and income. A value of p<0.05 was accepted as significant. 4) Values are presented as mean ± standard deviation. BMI: Body Mass Index, WHR: Waist-Hip Circumference Ratio
1) LSE: low 24-urinary sodium excretion group (≤141.75 mmol/dL), HSE: high 24-urinary sodium excretion group (>141.75 mmol/dL) 2) By t-test analysis. A value of p<0.05 was accepted as significant. 3) By t-test analysis adjusted for age, sex, smoking history and income. A value of p<0.05 was accepted as significant. 4) Values are presented as mean ± standard deviation.
1) LSE: low 24-urinary sodium excretion group (≤141.75 mmol/dL), HSE: high 24-urinary sodium excretion group (>141.75 mmol/dL) 2) By t-test analysis. A value of p<0.05 was accepted as significant. 3) By t-test analysis adjusted for age, sex, smoking history and income. A value of p<0.05 was accepted as significant. 4) Values are presented as mean ± standard deviation.
1) LSE: low 24-urinary sodium excretion group (≤141.75 mmol/dL), HSE: high 24-urinary sodium excretion group (>141.75 mmol/dL) 2) By t-test analysis. A value of p<0.05 was accepted as significant. 3) By t-test analysis adjusted for age, sex, smoking history and income. A value of p<0.05 was accepted as significant. 4) Values are presented as mean ± standard deviation.
1) Anthropometric, Na and K level in serum and urine were adjusted for age, sex, smoking history and income by Partial correlation coefficients. Energy and nutrients intake by Pearson's correlation coefficients. A value of BMI: Body Mass Index, WHR: Waist-Hip Circumference Ratio
1) T1: Lower tertile of 24-hour urinary sodium excretion, T2: Middle tertile of 24-hour urinary sodium excretion, T3: Upper tertile of 24-hour urinary sodium excretion 2) Model-1: unadjusted 3) Model-2: adjusted for age and sex 4) Model-3: adjusted for age, sex, smoking history and income 5) By multiple logistic regression analysis. A value of p<0.05 was accepted as significant

 KSCN
KSCN


 Cite
Cite


