
Articles
- Page Path
- HOME > Korean J Community Nutr > Volume 16(2); 2011 > Article
-
Original Article
- Effect of School Lunch Menu Intervention through Calcium Enriched Menus on Nutrient Intakes of High School Girls
- Eon-Kyoung Lee, Young-Sun Choi, Bok-Seon Bae
-
Korean Journal of Community Nutrition 2011;16(2):265-277.
DOI: https://doi.org/10.5720/kjcn.2011.16.2.265
Published online: April 30, 2011
Department of Nutritional Education, Graduate School of Education, Daegu University, Gyeongsan, Korea.
1Department of Food and Nutrition, Daegu University, Gyeongsan, Korea.
- Corresponding author: Bok-Seon Bae, Department of Nutritional Education, Graduate School of Education, Daegu University, Jilyang, Gyeongsan, Gyeongbuk 712-714, Korea. Tel: (053) 850-6830, Fax: (053) 850-6839, bbseon@hanmail.net
• Received: January 31, 2011 • Revised: February 22, 2011 • Accepted: March 3, 2011
Copyright © 2011 The Korean Society of Community Nutrition
- 1,721 Views
- 1 Download
- 4 Crossref
Abstract
- This study was conducted to improve the nutritional status of high school girls via lunch menu intervention. Surveys were carried out twice to evaluate basal status and status after lunch menu intervention. In the first survey nutrient intakes of 24-hour and school lunch were each estimated by 24-hour recall dietary survey and self-recording, respectively. Calcium intake was the lowest among nutrients, and stir-frying was the most preferred cooking method. Five dishes of school lunch menus which were included in the first survey were replaced with recipes containing foods with higher calcium level; anchovy stir-fried with red pepper paste, anchovy stir-fried with almond, pork stir-fried with shredded kelp, crab meat soup, and tteokbokki with cheese. In the second survey calcium intake from school lunch was significantly (p < 0.001) increased from 45.5% to 50.2% of one thirds of recommended intake (RI) after calcium enriched lunch menu intervention. Intakes of vitamin A and E were also significantly increased, whereas those of energy, thiamin, and vitamin C were decreased. Index of nutritional quality values of nutrients of 24-hour intakes (except thiamin, vitamin B6, vitamin C) is increased by intervention; however, those of calcium, folic acid, iron are still very low. Even though this study shows a possibility of improving nutrient intakes of students through school lunch menu intervention, lunch intervention by itself is not enough action to improve nutritional status of micronutrient for adolescents.
- 1. Ahn Y, Kim HM, Kim KW. A study on weight control, nutrition knowledge, dietary attitudes and eating behaviors among high school female students. Korean J Community Nutr. 2006; 11(2): 205-217.
- 2. Cho SH, Yu HH. Nutrition knowledge, dietary attitudes, dietary habits and awareness of food-nutrition labelling by girl's high school students. Korean J Community Nutr. 2007; 12(5): 519-533.
- 3. Gould R, Russel J, Barker ME. School lunch menus and 11 to 12 year old children's food choice in three secondary schools in England-Are the nutritional standards being met? Appetite. 2006; 46: 86-92.ArticlePubMed
- 4. Han JS, Kim JH. Calcium intake and cognition on calcium of adolescents in Busan area. J Korean Soc Food Sci Nutr. 2002; 31(6): 1026-1034.Article
- 5. Institute of Medicine. School meals. Building blocks for healthy children. 2010; Washington DC: The National Academies Press; 69-89.
- 6. Jang JK, Cho WJ, Ho SY, Kim EM. The effect of school milk program for junior and senior high school students on milk consumption. Korean J Food Cult. 2007; 22(4): 498-502.
- 7. Jung BM, Choi IS. A study on obesity and food habit of adolescents in Yeosu, Jeonnam area. Korean J Community Nutr. 2003; 8(2): 129-137.
- 8. Jung H, Yoon J, Choi KS, Chung SJ. Feasibility of using digital pictured to examine individual's nutrient intakes from school lunch: A pilot study. J Korean Diet Assoc. 2009; 15(3): 278-285.
- 9. Kim CS, Hong HO, Lee JS, Kim JY, Maeng WJ. A study on nutrient intake status and food sources of iron by dietary iron density of high school girls in Seoul. Korean J Nutr. 2007; 40(4): 371-384.
- 10. Kim MH, Bae YJ, Kim YH, Choi MK. The study of dietary habits and satisfaction with school lunch program for high school boys and girls in Chungnam province. Korean J Food Nutr. 2009; 22(4): 598-605.
- 11. Kim SH, Cha MH, Kim YK. High school students' preference and food intake on menu items offered by school food service in Daegu. J Korean Soc Food Sci Nutr. 2006; 35(7): 945-954.
- 12. Kim Y, Yoon J, Kim H, Kwon SO. Factors affecting intention to participate in school breakfast program of middle and high school students in Seoul. Korean J Community Nutr. 2007; 12(4): 489-500.
- 13. Kim YH. A study on the eating behaviour and nutrition knowledge of middle school students and satisfaction of dietary life instruction in technology home economics subjects. J Korean Home Econ Educ Assoc. 2010; 22(3): 117-128.
- 14. Korea Health Industry Development Institute. Nutrition Survey Guidelines. 2004 Nutrition and Health Examination Survey. 2004; 43-77.
- 15. Korean Nutrition Society. Dietary reference intakes for Koreans. 2005; Seoul: The Korean Nutrition Society.
- 16. Korean Nutrition Society. Dietary reference intakes for Koreans. 2010; 1st revision. Seoul: The Korean Nutrition Society.
- 17. Ku JO, Lee JW, Choi YS, Kim JH, Lee JH. Nutrition throughout the life cycle. 2006; Seoul: Hyoil Press; 270-301.
- 18. Lee KH, Park ES. School food service satisfaction and menu preferences of high school students -Focused on Iksan, Cheonbuk-. Korean J Community Nutr. 2010; 15(1): 108-123.
- 19. Ministry of Health, Welfare and Families. Korea Centers for Disease Control and Prevention. 2008 National health and nutrition examination survey report. 2009; Seoul: 140-141. 158-169.
- 20. Ministry of Education, Science and Technology. School food service-a plan for safe and delicious school lunch. 2010; Seoul: 1-20.
- 21. Mo SM, Ku JO, Park YJ, Park YS, Son SM, Seo JS. Community nutrition. 2006; Kyomunsa; 225-228.
- 22. Oh YM. Nutritional analysis of middle school lunch service menu in Daejeon and development of menu enriched with calcium. 2006; The Graduate School of Chungnam National University; 5-6 Dissertation.
- 23. Pak SH, Lee JS, Hong HO. The food and nutrient intakes on weekdays and weekends among high school girls in Seoul. Korean J Nutr. 2010; 43(5): 513-523.Article
- 24. Park HK, Hong HO, Lee JS, Kim JY. A study on the dietary habits and health consciousness of high school students in Seoul. Korean J Nutr. 2010; 43(4): 395-403.Article
- 25. Park JE, Kim SJ, Choue RW. Study on stress, depression, binge eating, and food behavior of high school girls based on their BMI. Korean J Community Nutr. 2009; 14(2): 175-181.
- 26. Park MS, Hong KJ, Cho YS, Lee JW. A study on the promotion of adolescent's milk consumption (II) -Relationships of adolescent's milk intake frequency with food attitude, snacking frequency, physical activity and school vending facilities. J Korean Diet Assoc. 2007; 13(1): 73-83.
- 27. Park SH, Jung RW, Lee HG. The study on the state of health and dietary habits of boy's and girl's high school students in Seoul. Korean J Food Cookery Sci. 1991; 7(1): 67-80.
- 28. Rural Development Administration. Food composition table. 2007; seventh revision. Seoul: National Rural Resources Development Institute.
- 29. Shim JE, Paik HY, Moon HK, Kim YO. Comparative analysis and evaluation of dietary intakes of Koreans by age groups:(1)Nutrient intakes. Korean J Nutr. 2001; 34(5): 554-567.
- 30. Templeton SB, Marlette MA, Panemangalore M. Competitive foods increase the intake of energy and the decrease the intake of certain nutrients by adolescents consuming school lunch. J Am Diet Assoc. 2005; 105: 215-220.PubMed
- 31. Yeoh YJ, Yoon JH, Shim JE. Relation of breakfast intake to diet quality in Korean school-aged children: Analysis of the data from the 2001 National Health and Nutrition Survey. Korean J Community Nutr. 2009; 14(1): 1-11.
- 32. Yi BS, Yang IS. An exploratory study for identifying factors related to breakfast in elementary, middle and high school students. Korean J Community Nutr. 2006; 11(1): 25-38.
- 33. Yi G, Yoon J, Choo YJ, Chung SJ, Kwon YH. Effect of school breakfast service on attitudes toward breakfast and school breakfast of male middle school students. Korean J Community Nutr. 2009; 14(3): 277-285.
- 34. Yi NY, Kwak TK, Lee KE. Food habits and nutrient intakes by self-reported food consumption of middle and high school students in Seoul, Gyeonggi, and Gyeongnam area. Korean J Food Cult. 2006; 21(5): 473-480.
- 35. Yi NY, Kwak TK. Nutrient intake determined by school lunch plate waste and by self-reported food consumed of selected high school students in Seoul. J Korean Diet Assoc. 2008; 14(1): 1-12.
REFERENCES
Fig. 1Degree of acceptance of calcium enriched menus. The numbers in the figure are percentages of subjects (N = 411).
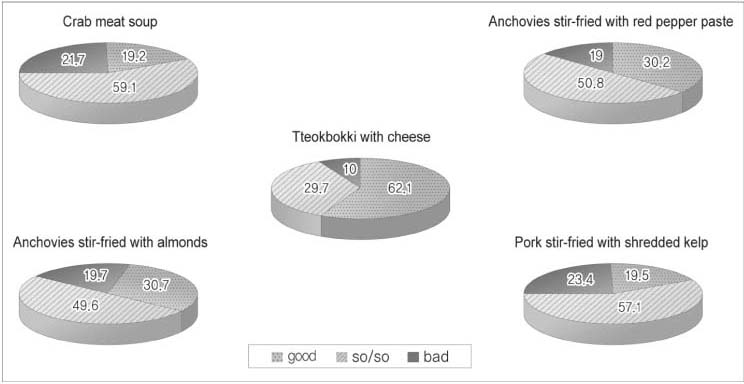
Table 1Comparison of nutrient contents of dishes manipulated with calcium rich foods and those of conventional dishes

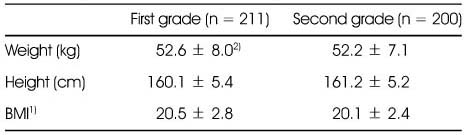


Table 5Twenty four-hour nutrient intakes and intakes from school lunch before and after calcium enriched menu intervention (N = 389)
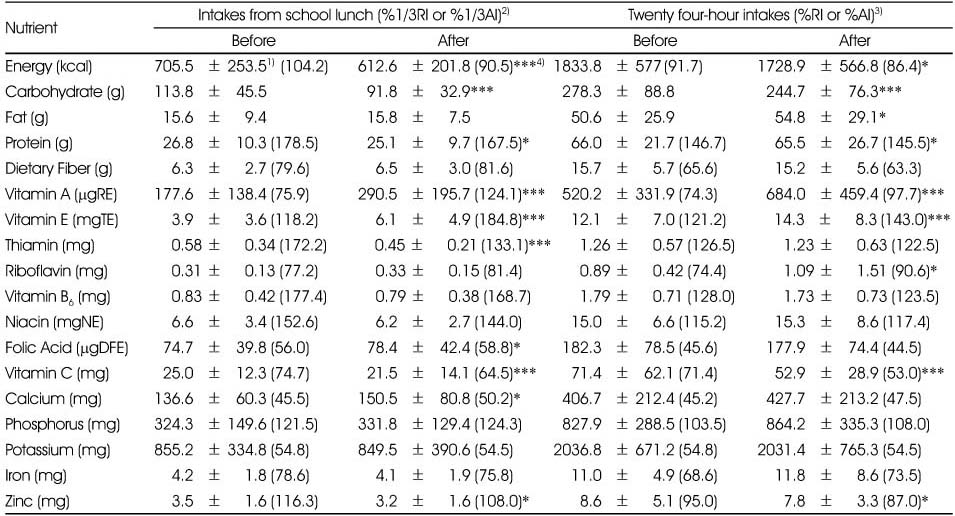
Table 6INQ1) of 24-hour nutrient intakes before and after calcium enriched menu intervention (N = 389)

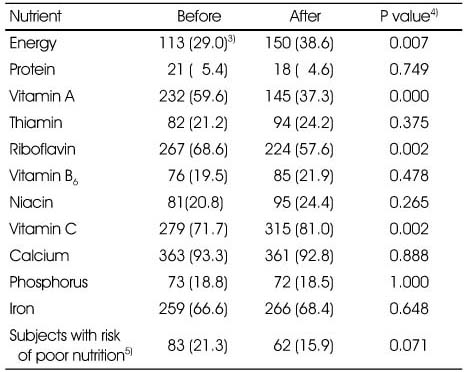
Figure & Data
REFERENCES
Citations
Citations to this article as recorded by 
- Study on Necessity of Updating Nutritional Standards for School Lunch Programs in Korea
Meeyoung Kim, So-young Kim, Jihyun Yoon
Journal of the East Asian Society of Dietary Life.2017; 27(2): 137. CrossRef - Study on Improvement of Elementary School Food Service by Applying Preferred Recipes to Disliked Seafood Menus
Ji-Hye Seong, Mi Jeong Kim
Journal of the East Asian Society of Dietary Life.2017; 27(4): 387. CrossRef - Calcium and Milk Intake of Elementary School Students from School Foodservices - Focus on the Gyeongsangbukdo Province -
Sun-Hee Park, Kyeung-Soon Lee, Soo-Kyong Choi, Jung-Sook Seo
Journal of the Korean Dietetic Association.2014; 20(1): 12. CrossRef - Characteristics of School Menus from the Daegu and Gyeongbuk Area
Seon Woo Ahn, Mi-Kyung Choi
Journal of the Korean Society of Food Science and Nutrition.2013; 42(6): 983. CrossRef
 Cite
CiteEffect of School Lunch Menu Intervention through Calcium Enriched Menus on Nutrient Intakes of High School Girls

Fig. 1
Degree of acceptance of calcium enriched menus. The numbers in the figure are percentages of subjects (N = 411).
Fig. 1
Effect of School Lunch Menu Intervention through Calcium Enriched Menus on Nutrient Intakes of High School Girls
Comparison of nutrient contents of dishes manipulated with calcium rich foods and those of conventional dishes
1) Before: Dish prepared without calcium rich food
2) After: Dish prepared with calcium rich food
Physical measurements of subjects
1) BMI (Body Mass Index) = Weight (kg) / Height (m)2
2) Mean ± SD
3) *: p < 0.05 by t-test
Frequency of meals and snacking and reasons of skipping meals of the subjects
1) N (%)
Daily nutrient intakes of the subjects assessed by 24 hour recall (N = 411)
1) Mean ± SD
2) Percentage value compared to RI (Recommended Intake) or AI (Adequate Intake)
Twenty four-hour nutrient intakes and intakes from school lunch before and after calcium enriched menu intervention (N = 389)
1) Mean ± SD
2) Percentages of 1/3RI (Recommended Intake) or 1/3AI (Adequate Intake)
3) Percentages of RI or AI
4) *: p < 0.05, **: p < 0.01, ***: p < 0.001 by paired t-test
INQ1) of 24-hour nutrient intakes before and after calcium enriched menu intervention (N = 389)
1) INQ: Index of Nutritional Quality
2) Mean ± SD
3) *: p < 0.05, **: p < 0.01, ***: p < 0.001 by paired t-test
Distribution of subjects who consumed less than 75% of EER1) and nutrient intakes less than EAR2) before and after calcium enriched menu intervention (N = 389)
1) EER: Estimated Energy Requirement
2) EAR: Estimated Average Requirement
3) N (%)
4) P value by McNemar test
5) Subjects consumed energy less than 75% of EER and 4 nutrients (calcium, iron, vitamin A, riboflavin) intakes less than EAR
Table 1
Comparison of nutrient contents of dishes manipulated with calcium rich foods and those of conventional dishes
1) Before: Dish prepared without calcium rich food 2) After: Dish prepared with calcium rich food
Table 2
Physical measurements of subjects
1) BMI (Body Mass Index) = Weight (kg) / Height (m)2 2) Mean ± SD 3) *: p < 0.05 by t-test
Table 3
Frequency of meals and snacking and reasons of skipping meals of the subjects
1) N (%)
Table 4
Daily nutrient intakes of the subjects assessed by 24 hour recall (N = 411)
1) Mean ± SD 2) Percentage value compared to RI (Recommended Intake) or AI (Adequate Intake)
Table 5
Twenty four-hour nutrient intakes and intakes from school lunch before and after calcium enriched menu intervention (N = 389)
1) Mean ± SD 2) Percentages of 1/3RI (Recommended Intake) or 1/3AI (Adequate Intake) 3) Percentages of RI or AI 4) *: p < 0.05, **: p < 0.01, ***: p < 0.001 by paired t-test
Table 6
INQ1) of 24-hour nutrient intakes before and after calcium enriched menu intervention (N = 389)
1) INQ: Index of Nutritional Quality 2) Mean ± SD 3) *: p < 0.05, **: p < 0.01, ***: p < 0.001 by paired t-test
Table 7
Distribution of subjects who consumed less than 75% of EER1) and nutrient intakes less than EAR2) before and after calcium enriched menu intervention (N = 389)
1) EER: Estimated Energy Requirement 2) EAR: Estimated Average Requirement 3) N (%) 4) P value by McNemar test 5) Subjects consumed energy less than 75% of EER and 4 nutrients (calcium, iron, vitamin A, riboflavin) intakes less than EAR


