Articles
- Page Path
- HOME > Korean J Community Nutr > Volume 17(3); 2012 > Article
-
Original Article
- The Related Factors Influencing on Self-rated Health Level of Middle-aged Women
- Hyejin Lee, Kyung-Hea Lee, Eunkyung Kim, Mi-Jung Kim, Suk-Man Hwang
-
Korean Journal of Community Nutrition 2012;17(3):290-301.
DOI: https://doi.org/10.5720/kjcn.2012.17.3.290
Published online: June 30, 2012
Department of Food and Nutrition, Changwon National University, Gyeongnam, Korea
1Department of Child and Family, Changwon National University, Gyeongnam, Korea.
2Department of Food and Nutrition, Silla University, Busan, Korea.
3Department of Sociology, Changwon National University, Gyeongnam, Korea.
- Corresponding author: Kyung-Hea Lee, Department of Food and Nutrition, Changwon National University, 9 Sarimdong, Uichanggu, Changwon, Gyeongnam 641-773, Korea. Tel: (055) 213-3514, Fax: (055) 281-7480, khl@changwon.ac.kr
Copyright © 2012 The Korean Society of Community Nutrition
- 809 Views
- 0 Download
- 17 Crossref
Figure & Data
REFERENCES
Citations

- Comparison of the health and dietary characteristics of postmenopausal middle-aged women according to subjective health perception: Based on the 8th (2019–2021) Korea National Health and Nutrition Examination Survey
Taegyeong Yeo, Chong-Su Kim, Yoon Jung Yang
Journal of Nutrition and Health.2025; 58(2): 200. CrossRef - Dietary Patterns and the Risk of Composite-Defined Osteoporosis in Pre- and Postmenopausal Women: A Prospective Cohort Study
Yejung Choi, Kyong Park
Nutrients.2025; 17(18): 2947. CrossRef - Self-rated health according to change of lifestyle after COVID-19: Differences between age groups
Dan Bi Lee, Jung Hyun Ahn, Jin Young Nam
Korean Journal of Health Education and Promotion.2022; 39(2): 1. CrossRef - Role Stress and Sense of Control Predict Using Food to Cope With Stress in Midlife Women
Dana R. Riedy, Ashley MacPherson, Natalie D. Dautovich
Journal of Aging and Health.2021; 33(9): 732. CrossRef - Food consumption frequency of Korean adults based on whether or not having chewing difficulty using 2013–2016 KNHANES by sex-stratified comparative analysis
Mi Jeong Kim
Nutrition Research and Practice.2020; 14(6): 637. CrossRef - Influence of Midlife Health Condition and Awareness of Successful Aging on Preparation for Old Age
Eun Ho Ha, Young Mi Lee
Korean Journal of Adult Nursing.2020; 32(5): 472. CrossRef - Analysis of Convergent Factors on Subjective Health Status of Patients with Depression
Myoung-Jin Kwon, Young-Ju Kim
Journal of Digital Convergence.2016; 14(6): 309. CrossRef - Health Status Assessment Tool Development based on Dietary Patterns in Middle-Aged Women
Hye-Jin Lee, Kyung-Hea Lee
Korean Journal of Community Nutrition.2016; 21(1): 37. CrossRef - Acculturation, Food Intake and Dietary Behaviors of Chinese College Students in Busan by Residential Period
Fangfang Song, Mi Jeong Kim
Journal of the East Asian Society of Dietary Life.2015; 25(4): 594. CrossRef - The Impacts of Dietary Habits on Self-perceived Health-related Physical Fitness in Middle-aged Women -Focused on Changwon Province-
Hye-Jin Lee, Kyung-Hea Lee
Journal of the Korean Society of Food Science and Nutrition.2014; 43(6): 916. CrossRef - Effects of Cultural Facilities and City Parks on the Regional Suicide Rates in Korea
Soo-Mi Cho, Hyung-Deok Shin
Journal of the Korea Academia-Industrial cooperation Society.2014; 15(8): 4874. CrossRef - A Study on Dietary Behaviors, Health-Related Lifestyle of Adult Visitors at Public Health Centers in Gyeonggi Urban Area
Jong-Sook Kwon, Kyungmin Kim, Hyun-Chang Seo, Yoonna Lee, Seunggeon Lim, Young-Sug Choi
Korean Journal of Community Nutrition.2013; 18(6): 611. CrossRef - A Study on the Knowledge, Attitudes, Cancer Preventive Dietary Behavior, and Lifestyles of Adults in the Jeonbuk Area
Jeongok Rho, Suyoun Choi
Korean Journal of Human Ecology.2013; 22(1): 201. CrossRef - Evaluation of Diet Quality according to Self-Rated Health Status of Korean Middle-Aged Women -Based on 2008~2009 Korean National Health and Nutrition Examination Survey-
Hye-Jin Lee, Kyung-Hea Lee
Journal of the Korean Society of Food Science and Nutrition.2013; 42(9): 1395. CrossRef - Anthropometric Index, Dietary Habits and Nutrient Intake of the Oldest-old Population Aged 95 and Over Living in Seoul
Chung Shil Kwak, Ji Hyun Cho, Miyong Yon, Sang Chul Park
Korean Journal of Community Nutrition.2012; 17(5): 603. CrossRef - Health-Related Factors Influencing the Quality of Life of Rural Elderly Subjects - Activities of Daily Living, Cognitive Functions, Prevalence of Chronic Diseases and Nutritional Assessment
Mee Sook Lee
Korean Journal of Community Nutrition.2012; 17(6): 772. CrossRef - Characteristics of the Health Factors in 45~60 Year Old Korean Women related to Menopausal Stages - Based on 2008~2009 Korean National Health and Nutrition Examination Survey -
Hye-Jin Lee, Kwang-Hyun Cho, Kyung-Hea Lee
Korean Journal of Community Nutrition.2012; 17(4): 450. CrossRef
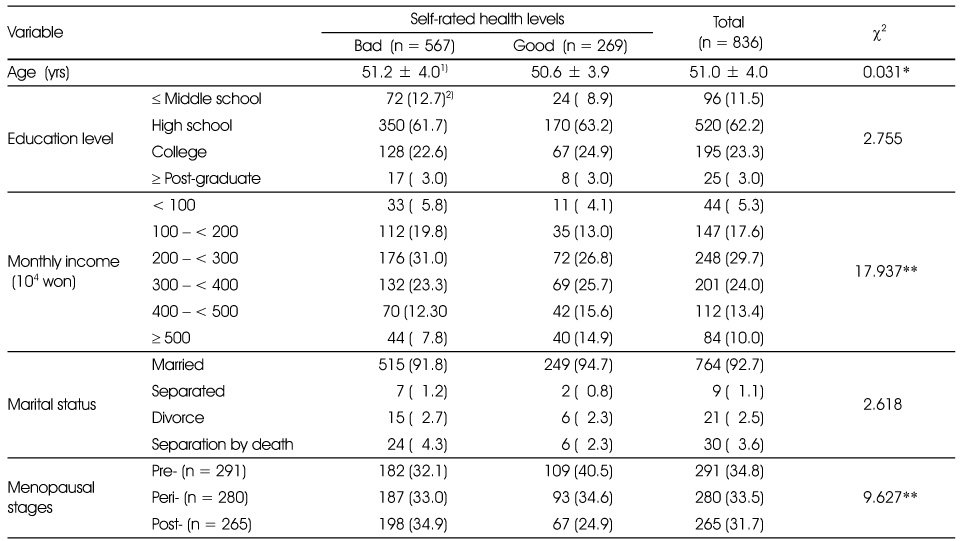
General Informations of subjects by self-rated health levels
1) Values are Mean ± SD.
2) N (%)
*: p < 0.05: Significantly different by Student's t-test
**: p < 0.01: Significantly different by Student's t-test
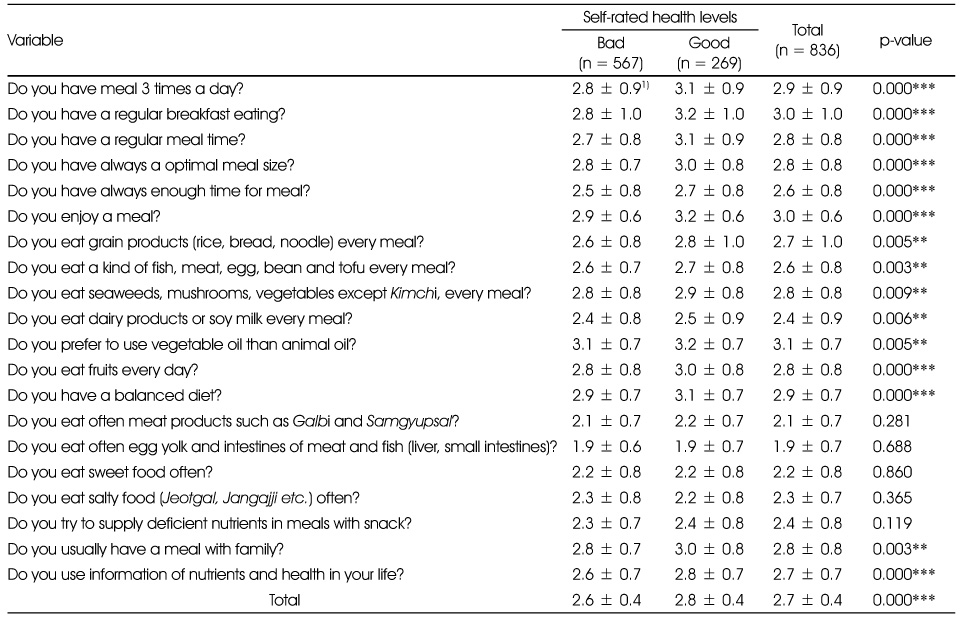
Dietary related factors by self-rated health levels
1) Values are Mean ± SD.
2) 4-point scale (1: Not at all, 2: Tend to not well, 3: Tend to well, 4: Very well)
3) 4-point scale (1: No, 2: Less, 3: Good, 4: Very well)
4) N (%)
***: p < 0.001: Significantly different by Student's t-test
Scores of dietary habits by self-rated health levels
1) Values are Mean ± SD.
*: p < 0.05, **: p < 0.01, ***: p < 0.001
BMI and menopausal symptoms by self-rated health levels
1) BMI = kg/m2
2) 5-point Likert scale (1: Not at all, 5: Very well)
3) 5-point Likert scale (1: Not at all, 5: Very much)
***: p < 0.001: Significantly different by Student's t-test
Comparisons in life style by self-rated health levels
1) Values are Mean ± SD.
2) N (%)
***: p < 0.001: Significantly different by Student's t-test
Mental health scores by self-rated health levels
1) 5-point Likert scale (1: Not at all, 5: Very well)
2) 4-point Likert scale (1: Not at all, 4: Always)
***: p < 0.001: Significantly different by Student's t-test
Familial characteristics by self-rated health levels
1) 5-point Likert scale (1: Not at all, 2: Tend to not well, 3: Common, 4: Tend to well, 5: Very well)
2) 5-point Likert scale (1: Not at all, 2: Tend to not satisfied, 3: Common, 4: Tend to satisfied, 5: Very satisfied)
3) Values are Mean ± SD.
***: p < 0.001: Significantly different by Student's t-test
Correlation in variables with the self-rated health levels
*: p < 0.05, ***: p < 0.001
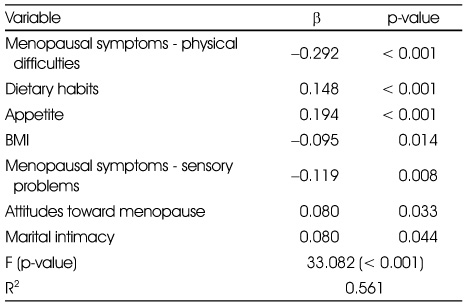
Related factors influencing on self-rated health status by multiple regression analysis
1) Values are Mean ± SD. 2) N (%) *: p < 0.05: Significantly different by Student's t-test **: p < 0.01: Significantly different by Student's t-test
1) Values are Mean ± SD. 2) 4-point scale (1: Not at all, 2: Tend to not well, 3: Tend to well, 4: Very well) 3) 4-point scale (1: No, 2: Less, 3: Good, 4: Very well) 4) N (%) ***: p < 0.001: Significantly different by Student's t-test
1) Values are Mean ± SD. *: p < 0.05, **: p < 0.01, ***: p < 0.001
1) BMI = kg/m2 2) 5-point Likert scale (1: Not at all, 5: Very well) 3) 5-point Likert scale (1: Not at all, 5: Very much) ***: p < 0.001: Significantly different by Student's t-test
1) Values are Mean ± SD. 2) N (%) ***: p < 0.001: Significantly different by Student's t-test
1) 5-point Likert scale (1: Not at all, 5: Very well) 2) 4-point Likert scale (1: Not at all, 4: Always) ***: p < 0.001: Significantly different by Student's t-test
1) 5-point Likert scale (1: Not at all, 2: Tend to not well, 3: Common, 4: Tend to well, 5: Very well) 2) 5-point Likert scale (1: Not at all, 2: Tend to not satisfied, 3: Common, 4: Tend to satisfied, 5: Very satisfied) 3) Values are Mean ± SD. ***: p < 0.001: Significantly different by Student's t-test
*: p < 0.05, ***: p < 0.001

 KSCN
KSCN


 PubReader
 Cite
Cite


