
Articles
- Page Path
- HOME > Korean J Community Nutr > Volume 16(2); 2011 > Article
-
Original Article
- Recognition and use of Nutrition Labeling among Hamburger and Pizza Restaurant Consumers in Daejeon
- Min-Young Lee, Joung-Won Lee
-
Korean Journal of Community Nutrition 2011;16(2):227-238.
DOI: https://doi.org/10.5720/kjcn.2011.16.2.227
Published online: April 30, 2011
Department of Consumers' Life Information, Chungnam National University, Daejeon, Korea.
- Corresponding author: Joung-Won Lee, Department of Consumers' Life Information, Chungnam National University, 99 Daehangno, Yuseong-gu, Daejeon 305-764, Korea. Tel: (042) 821-6841, Fax: (042) 821-8887, leejw@cnu.ac.kr
• Received: March 28, 2011 • Revised: April 6, 2011 • Accepted: April 19, 2011
Copyright © 2011 The Korean Society of Community Nutrition
- 1,860 Views
- 1 Download
- 5 Crossref
Abstract
- To investigate recognition and use of nutrition labeling on eating-out menus, self-recorded questionnaire was surveyed for 641 consumers who visited hamburger and pizza restaurants in Daejeon from May to July, 2010. Subjects were women of 51.3% and 92.9% aged 10s or 20s. Use frequency of hamburger and pizza restaurants was 2-3 times a month with 56.9%. Of subjects 41.0% knew nutrition labeling mandates of eating-out menus, 64.6% have seen nutrition labels of menus, and 44.5% read nutrition labels when purchasing. Among subjects who read nutrition labels, 67.0% (29.8% of total) referred to it when menu purchase and 60.4% (26.9% of total) experienced changing menu. The ratio of reading nutrition labels was different among gender, diet trial frequency and monthly eating-out cost. Reasons for not reading labels were "not interested in" or "never heard about" for 57.0%, and "not noticeable" for 28.7%. The ratio who read correctly all 3 pieces of information, such as calorie amount, daily value, and way of using daily value was 39.2%. Average number of correct reading was 2.13, which was different among gender, marital status, having children, diet trial frequency, monthly eating-out cost, the restaurants use frequency, and accompanying person. Many subjects wanted to be additionally provided with cholesterol and transfat. Therefore, practical and differentiated consumer educations considering consumer features are required for better nutrition labeling usage. Government's regulatory efforts and voluntary effort of eating-out companies, such as adding nutrients on labels and improving labeling places, are also necessary.
-
This study was financially supported by research fund of Chungnam National University in 2009.
NOTES
- 1. Binkley JK, Eales J, Jekanowski M. The relation betweendietary change and rising US obesity. Int J Obes Relat Metab Disord. 2000; 24(8): 1032-1039.ArticlePubMedPDF
- 2. Cho KS, Im BS, Kim SE, Kim GW. A survey on consumption behaviors of the fast-foods in university students. J Korean Living Sci Assoc. 2005; 14(2): 313-319.
- 3. Choi JH. A study on the consumption pattern and nutrition labeling recongnition of restaurant's of girl's highschool students. 2009; Ulsan University; 4-27 MS thesis.
- 4. Chung HJ, Cheon HS, Kwon KI, Kim JY, Yoo KS, Lee JH, Kim JW, Park HK, Kim SH, Hong SM. The recognition and requirement of nutrition labeling in fast-food restaurants. Korean J Nutr. 2009; 42(1): 68-77.
- 5. Chung SJ, Kang SH, Song SM, Ryu SH, Yoon JH. Nutritional quality of Korean adults' consumption of lunch prepared at home, commercial places, and institutions: analysis of the data from the 2001 national health and nutrition survey. Korean J Nutr. 2006; 39(8): 841-849.
- 6. Han MH. Consumption value and eating out behavior of male and female undergraduate students. 2007; Catholic University; 34-45 MS thesis.
- 7. Hong SM. Nutrient database construction and program of activation for menu nutrition labeling of restaurants. 2009; cited 2010 September 25. Available from http://rnd.kfda.go.kr/documentReport/documentReportResult.do.
- 8. Jeon MJ, Kim BH, Lee KS. A survey of fast food ding out behaviors. J Korean Home Econ Assoc. 1990; 28(2): 15-29.
- 9. Jun SM, Kwon SH, Park HK, Kim SH, Kwon KI, Jung HR. Consumers' use and demand of restaurant foods nutrition labeling. J Consum Stud. 2009; 20(2): 279-306.
- 10. Jung YH, Ko SJ, Lim HJ. The socioeconomic cost of adolescent obesity. Health Soc Welf Rev. 2010; 30(1): 195-219.Article
- 11. Kim BY. University student's dietary habit, and actual status of using convenience food and nutrition labelling. 2010; Konkuk University; 40-48 MS thesis.
- 12. Kim JH. The customer awareness and necessity about nutrition labeling system implementation of the menu. -Family Restaurant-. 2009; Woosong University; 20-25 MS thesis.
- 13. Kim KM. A study on fast food consumption patterns and brand preferene of university students in Ulsan. 2009; Ulsan University; 8-20 MS thesis.
- 14. Korea Center for Disease Control and Prevention. Reports on 2007~2008 Korea National Health and Nutrition Examination Survey. 2010.
- 15. The public announcement 2009-286. Korea Food and Drug Administration. 2009; cited 2010 November 25. Available from http://www.kfda.go.kr.
- 16. Food Industry Statistics System. Korean National Statistical Office. 2009; cited 2010 November 20. Available from http://fis.foodinkorea.co.kr/.
- 17. Kwon KI, Yoon SW, Kim SJ, Kang HN, Kim HN, Kim JY, Kim SY, Kim KL, Lee JH, Jung SM, Ock SW, Lee EJ, Kim JW, Kim MC, Park HK. A survey on customers' perceptions of nutrition labeling for processed food and restaurant meal. Korean J Nutr. 2010; 43(2): 181-188.Article
- 18. Lee HJ. Understanding and the use of food nutrition label of high school students in Jeollabuk-do province. 2009; Wonkwang University; 14-17 MS thesis.
- 19. Lee JJ. Survey on the fast food consumption and nutrition knowledge of middle school students in Pohang city. 2009; Yeungnam University; 7-20 MS thesis.
- 20. Symposium: Present status of obesity and its countermeasures in Korea. Ministry of Health and Welfare & Korea Center for Disease Control and Prevention. 2006; Cited 2010 November 11. Available from http://www.cdc.go.kr/.
- 21. National household monthly food expenses. Ministry for Food, Agriculture, Forestry and Fisheries. 2010; cited 2010 November 10. Available from http://www.krei.re.kr/kor/main.php.
- 22. Socioeconomic expense for obesity in Korea. 2008 Estimation data of National Health Insurance Corporation. National Health Insurance Corporation. 2010; cited 2010 November 20. Available from http://www.nhic.or.kr/.
- 23. Nielsen SJ, Siega-Riz AM, Popkin BM. Trends in energy intake in U.S. between 1977 and 1996 similar shifts seen across age groups. Obes Res. 2002; 10(5): 370-378.ArticlePubMed
- 24. Sohn CY. Perception of nutrition labeling on restaurant menus among adults in Suwon. Korean J Community Nutr. 2009; 14(4): 420-429.
- 25. Shin AS, Roh SB. Fast food consumption patterns of college students in Busan. Korean J Food Cult. 2000; 15(4): 287-293.
- 26. Wang G, Fletcher SM, Carley DH. Consumer utilization of food labeling as a source of nutrition information. J Consum Aff. 1995; 29(2): 368-380.Article
- 27. Yoon HJ, Wi SU. A survey of college student behaviors on fast food restaurants. Korean J Food Nutr. 1994; 7(4): 323-331.
- 28. You YJ. A study on the consumption pattern and nutrition labeling recognition of restaurant's menu of middle school student by sex in Jiniu. 2009; Ulsan University; 10-30 MS thesis.
REFERENCES


Fig. 3Consumers' behaviors for nutrition label reading. *Among the subject who read nutrition labels (n = 285).

Fig. 4
Percentage of correct answer by question and distribution of correct answer number among 3 questions about nutrition label information on hamburger and pizza menus.
Q1: Energy amount, Q2: Daily value of sodium (%), Q3: Appropriateness of sodium amount compared with the daily value
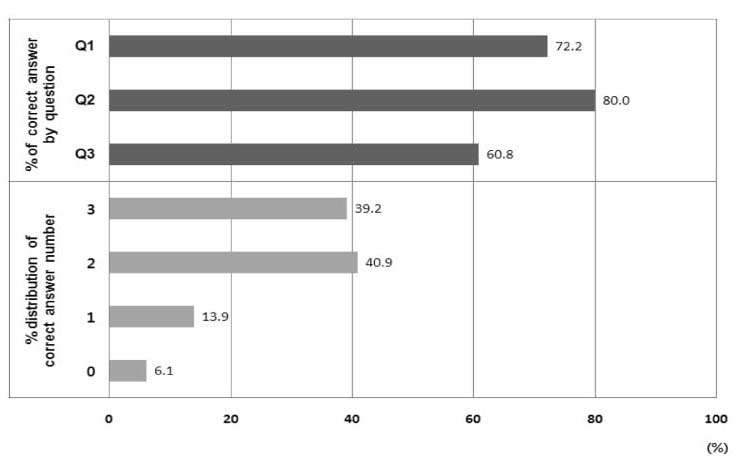
Fig. 5Nutrients which consumers were most interested among 5 nutrients labeled mandatorily and wanted to be added on nutrition labels of hamburger and pizza menus. *Multiple response

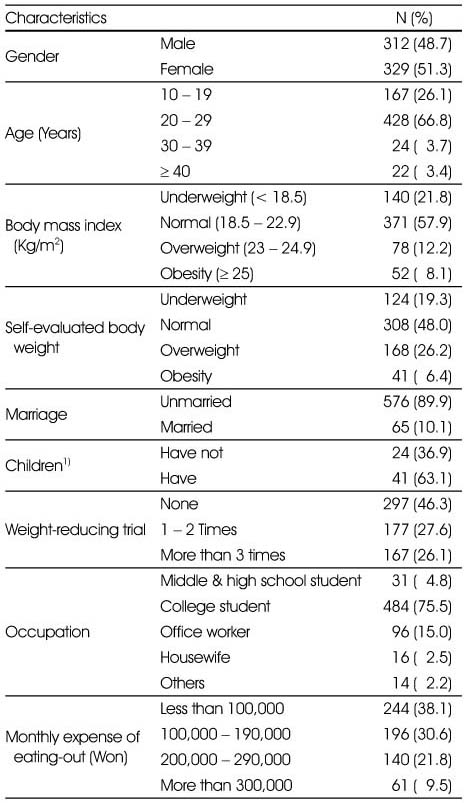
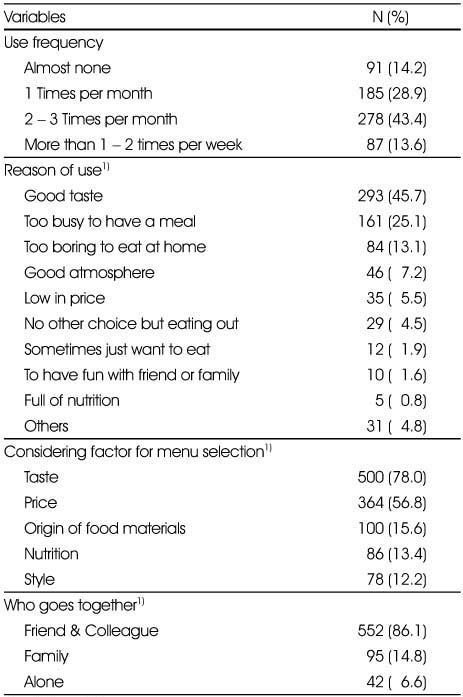

Table 4Subject's number of reading nutrition label and the number of correct answer by general characteristics and hamburger and pizza store use behavior


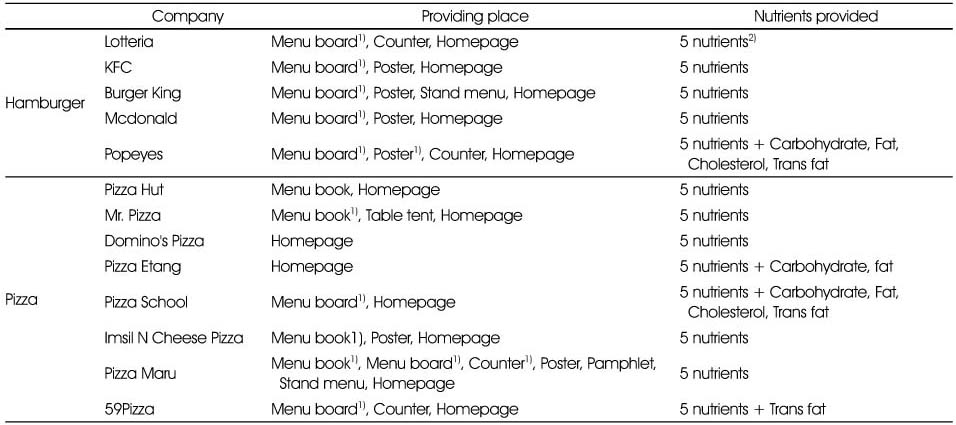
Figure & Data
REFERENCES
Citations
Citations to this article as recorded by 
- A Franchise Hamburger Menu for University Students Determined by Identifying Selection Attributes Using Conjoint Analysis
Yu-Ni Choi, Sung-Suk Chung, Jeong-Ok Rho
Journal of the East Asian Society of Dietary Life.2022; 32(4): 250. CrossRef - A Study on the Association among Satisfaction of Nutrition Labeling, Change of Purchase Behaviors, and Dietary Life Care, based on the Awareness of Nutrition Labeling at Expressway Rest Areas
Jung-Eun Kong, Jin-Ah Moon, Jong-Wook Kim, Jeeyoung Yeon
The Korean Journal of Food And Nutrition.2015; 28(6): 995. CrossRef - Recognition and Usage of Nutrition Labeling for Processed Foods and Restaurant Meals according to the Effort Level of Healthy Dietary Behavior in 5th Grade Elementary School Girls
Jin-Ah Moon, Jung-Eun Kong, Gui-Im Moon, Baeg-Won Kang, Jee-Young Yeon
The Korean Journal of Food And Nutrition.2015; 28(5): 849. CrossRef - How nutrition information frame affects parents’ perceptions of restaurants: The moderating role of information credibility
Kiwon Lee, Youngmi Lee, Sooyoun Kwon
International Journal of Hospitality Management.2015; 46: 112. CrossRef - Consumption and Perception of High Caloric, Low Nutrient Dense Foods by Middle School Students in Daegu
Hyeon-Suk Kang, Nan-Hee Lee, Eun-Ju Lee, Sung-Hee Cho
Journal of the Korean Dietetic Association.2012; 18(3): 234. CrossRef
 Cite
CiteRecognition and use of Nutrition Labeling among Hamburger and Pizza Restaurant Consumers in Daejeon


Fig. 1
Question example.
Fig. 2
Awareness of nutrition labeling mandates for the eating-out menu.
Fig. 3
Consumers' behaviors for nutrition label reading. *Among the subject who read nutrition labels (n = 285).
Fig. 4
Percentage of correct answer by question and distribution of correct answer number among 3 questions about nutrition label information on hamburger and pizza menus.
Q1: Energy amount, Q2: Daily value of sodium (%), Q3: Appropriateness of sodium amount compared with the daily value
Fig. 5
Nutrients which consumers were most interested among 5 nutrients labeled mandatorily and wanted to be added on nutrition labels of hamburger and pizza menus. *Multiple response
Fig. 1
Fig. 2
Fig. 3
Fig. 4
Fig. 5
Recognition and use of Nutrition Labeling among Hamburger and Pizza Restaurant Consumers in Daejeon
General characteristics of the subjects
Total N = 641
1) Among the married subject (n = 65)
Use of hamburger and pizza store of the subjects
Total N = 641
1) Multiple response
Reasons for not reading nutrition label
Total N = 356
Subject's number of reading nutrition label and the number of correct answer by general characteristics and hamburger and pizza store use behavior
1) Full number is 3
2) By t-test (t) or by ANOVA (F)
ab: Values with different superscript letters in a column are significantly different at p < 0.05 by Duncan's multiple range test
*: p < 0.05, ***: p < 0.001
Needs for providing time and place of nutrition labels where consumers see best
1) N (% of total N=641) 2) Multiple response
Hamburger and pizza store nutrition labeling status surveyed at the study period
1) Energy only, 2) 5 nutrients: Energy, Protein, Sugar, Sodium, Saturated fat
Table 1
General characteristics of the subjects
Total N = 641 1) Among the married subject (n = 65)
Table 2
Use of hamburger and pizza store of the subjects
Total N = 641 1) Multiple response
Table 3
Reasons for not reading nutrition label
Total N = 356
Table 4
Subject's number of reading nutrition label and the number of correct answer by general characteristics and hamburger and pizza store use behavior
1) Full number is 3 2) By t-test (t) or by ANOVA (F) ab: Values with different superscript letters in a column are significantly different at p < 0.05 by Duncan's multiple range test *: p < 0.05, ***: p < 0.001
Table 5
Needs for providing time and place of nutrition labels where consumers see best
1) N (% of total N=641) 2) Multiple response
Table 6
Hamburger and pizza store nutrition labeling status surveyed at the study period
1) Energy only, 2) 5 nutrients: Energy, Protein, Sugar, Sodium, Saturated fat


