
Articles
- Page Path
- HOME > Korean J Community Nutr > Volume 22(5); 2017 > Article
-
Research Article
- Accuracy of Accelerometer for the Prediction of Energy Expenditure and Activity Intensity in Athletic Elementary School Children During Selected Activities
-
Su-Ji Choi, Hae-Sun An, Mo-Ran Lee, Jung-Sook Lee, Eun-Kyung Kim

-
Korean Journal of Community Nutrition 2017;22(5):413-425.
DOI: https://doi.org/10.5720/kjcn.2017.22.5.413
Published online: October 31, 2017
Department of Food and Nutrition, Gangneung-Wonju National University, Gangneung, Korea.
- Corresponding author: Eun-Kyung Kim. Department of Food and Nutrition, Gangneung-Wonju National University, Gangneung 25457, Korea. Tel: (033) 640-2336, Fax: (033) 640-2330, ekkim@gwnu.ac.kr
• Received: August 24, 2017 • Revised: October 13, 2017 • Accepted: October 13, 2017
Copyright © 2017 The Korean Society of Community Nutrition
This is an Open-Access article distributed under the terms of the Creative Commons Attribution Non-Commercial License (http://creativecommons.org/licenses/by-nc/3.0/) which permits unrestricted non-commercial use, distribution, and reproduction in any medium, provided the original work is properly cited.
- 1,978 Views
- 3 Download
- 2 Crossref
Abstract
-
Objectives
- Accurate assessment of energy expenditure is important for estimation of energy requirements in athletic children. The objective of this study was to evaluate the accuracy of accelerometer for prediction of selected activities' energy expenditure and intensity in athletic elementary school children.
-
Methods
- The present study involved 31 soccer players (16 males and 15 females) from an elementary school (9-12 years). During the measurements, children performed eight selected activities while simultaneously wearing the accelerometer and carrying the portable indirect calorimeter. Five equations (Freedson/Trost, Treuth, Pate, Puyau, Mattocks) were assessed for the prediction of energy expenditure from accelerometer counts, while Evenson equation was added for prediction of activity intensity, making msix equations in total. The accuracy of accelerometer for energy prediction was assessed by comparing measured and predicted values, using the paired t-test. The intensity classification accuracy was evaluated with kappa statistics and ROC-Curve.
-
Results
- For activities of lying down, television viewing and reading, Freedson/Trost, Treuth were accurate in predicting energy expenditure. Regarding Pate, it was accurate for vacuuming and slow treadmill walking energy prediction. Mattocks was accurate in treadmill running activities. Concerning activity intensity classification accuracy, Pate (kappa=0.72) had the best performance across the four intensities (sedentary, light, moderate, vigorous). In case of the sedentary activities, all equations had a good prediction accuracy, while with light activities and Vigorous activities, Pate had an excellent accuracy (ROC-AUC=0.91, 0.94). For Moderate activities, all equations showed a poor performance.
-
Conclusions
- In conclusion, none of the assessed equations was accurate in predicting energy expenditure across all assessed activities in athletic children. For activity intensity classification, Pate had the best prediction accuracy.
- 1. American college of sports medicine. American dietetic association. Dietitians of Canada. Nutrition and athletic performance. Med Sci Sports Exerc 2000; 32(12): 2130-2145.ArticlePubMed
- 2. Ahn NY, Kim KJ. Effects of health education for the nutrient intakes and eating habits in youth athletes. J Coaching Dev 2011; 13(1): 277-282.
- 3. Loucks AB. Energy balance and body composition in sports and exercise. J Sports Sci 2004; 22(1): 1-14.ArticlePubMed
- 4. Kim EK, Kim GS, Park JS. Comparison of activity factor, predicted resting metabolic rate, and intakes of energy and nutrients between athletic and non-athletic high school students. J Korean Diet Assoc 2009; 15(1): 52-68.
- 5. Rowlands AV, Thomas PWM, Eston RG, Topping R. Validation of the RT3 triaxial accelerometer for the assessment of physical activity. Med Sci Sports Exerc 2004; 36(3): 518-524.ArticlePubMed
- 6. Boyd LJ, Ball K, Aughey RJ. The reliability of MinimaxX accelerometers for measuring physical activity in Australian football. Int J Sports Physiol Perform 2011; 6(3): 311-321.ArticlePubMed
- 7. Trost SG, Way R, Okely AD. Predictive validity of three ActiGraph energy expenditure equations for children. Med Sci Sports Exerc 2006; 38(2): 380-387.ArticlePubMed
- 8. Trost SG, Loprinzi PD, Moore R, Pfeiffer KA. Comparison of accelerometer cut points for predicting activity intensity in youth. Med Sci Sports Exerc 2011; 43(7): 1360-1368.ArticlePubMed
- 9. Kim DY. Reliability and validity of the Korean version of the multimedia activity recall for children and adolescents [dissertation]. Graduate School of Korea National Sport University; 2010.
- 10. Yu JH, Lee SM. The effects of regular resistive exercise on cardiopulmonary ability and cerebral blood flow velocity. J Korean Soc Phys Med 2010; 5(2): 255-264.
- 11. Wixted AJ, Thiel DV, Hahn AG, Gore CJ, Pyne DB, James DA. Measurement of energy expenditure in elite athletes using MEMS-based triaxial accelerometers. IEEE Sens J 2007; 7(4): 481-488.Article
- 12. Kim JH, Son HR, Choi JS, Kim EK. Energy expenditure measurement of various physical activity and correlation analysis of body weight and energy expenditure in elementary school children. J Nutr Health 2015; 48(2): 180-191.Article
- 13. Treuth MS, Schmitz K, Catellier DJ, McMurray RG, Murray DM, Almeida MJ. Defining accelerometer thresholds for activity intensities in adolescent girls. Med Sci Sports Exerc 2004; 36(7): 1259-1266.PubMedPMC
- 14. Kim YJ, Wang CS, Kim EK. Measurement of energy expenditure through treadmill-based walking and self-selected hallway walking of college students: using indirect calorimeter and accelerometer. Korean J Community Nutr 2016; 21(6): 520-532.ArticleLink
- 15. Mattocks C, Leary S, Ness A, Deere K, Saunders J, Tilling K. Calibration of an accelerometer during free-living activities in children. Int J Pediatr Obes 2007; 2(4): 218-226.ArticlePubMed
- 16. Freedson P, Pober D, Janz KF. Calibration of accelerometer output for children. Med Sci Sports Exerc 2005; 37: 11 Suppl. S523-S530.ArticlePubMed
- 17. Pate RR, Almeida MJ, McIver KL, Pfeiffer KA, Dowda M. Validation and calibration of an accelerometer in preschool children. Obesity (Silver Spring) 2006; 14(11): 2000-2006.ArticlePubMed
- 18. Puyau MR, Adolph AL, Vohra FA, Butte NF. Validation and calibration of physical activity monitors in children. Obes Res 2002; 10(3): 150-157.ArticlePubMed
- 19. Evenson KR, Catellier D, Gill K, Ondrak K, McMurray RG. Calibration of two objective measures of physical activity for children. J Sports Sci 2008; 26(14): 1557-1565.ArticlePubMed
- 20. Strath SJ, Bassett Jr DR, Thompson DL, Swartz AM. Simultaneous heart rate-motion sensor technique to estimate energy expenditure. Med Sci Sports Exerc 2001; 33(12): 2118-2123.ArticlePubMed
- 21. Rosenberger ME, Haskell WL, Albinali F, Mota S, Nawyn J, Intille S. Estimating activity and sedentary behavior from an accelerometer on the hip or wrist. Med Sci Sports Exerc 2013; 45(5): 964-975.ArticlePubMedPMC
- 22. Schofield WN. Predicting basal metabolic rate, new standards and review of previous work. Hum Nutr Clin Nutr 1985; 39(1): 5-41.PubMed
- 23. Pulsford RM, Cortina-Borja M, Rich C, Kinnafick FE, Dezateux C, Griffiths LJ. Actigraph accelerometer-defined boundaries for sedentary behaviour and physical activity intensities in 7 year old children. PLoS ONE 2011; 6(8): e21822.ArticlePubMedPMC
- 24. Metz CE. Basic principles of ROC analysis. Semin Nucl Med 1978; 8(4): 283-298.ArticlePubMed
- 25. Obuchowski NA. Receiver operating characteristic curves and their use in radiology. Radiology 2003; 229(1): 3-8.ArticlePubMed
- 26. Landis JR, Koch GG. The measurement of observer agreement for categorical data. Biometrics 1977; 33(1): 159-174.ArticlePubMed
- 27. Energy and protein requirements. Report of a joint FAO/WHO/UNU expert consultation. World Health Organ Tech Rep Ser 1985; 724: 1-206.PubMed
- 28. Ridley K, Olds TS. Assigning energy costs to activities in children: a review and synthesis. Med Sci Sports Exerc 2008; 40(8): 1439-1446.PubMed
- 29. Weyer C, Snitker S, Rising R, Bogardus C, Ravussin E. Determinants of energy expenditure and fuel utilization in man: effects of body composition, age, sex, ethnicity and glucose tolerance in 916 subjects. Int J Obes Relat Metab Disord 1999; 23(7): 715-722.ArticlePubMedPDF
- 30. Bosy-Westphal A, Kossel E, Goele K, Later W, Hitze B, Settler U. Contribution of individual organ mass loss to weight loss-associated decline in resting energy expenditure. Am J Clin Nutr 2009; 90(4): 993-1001.ArticlePubMed
- 31. Lee MH. Accuracy of accelerometer cut-points for estimating physical activity intensity for children. Korean J Meas Eval Phys Educ Sports Sci 2014; 16(2): 13-26.Article
- 32. Sirard JR, Trost SG, Pfeiffer KA, Dowda M, Pate RR. Calibration and evaluation of an objective measure of physical activity in preschool children. J Phys Act Health 2005; 2(3): 345-357.Article
- 33. Crouter SE, Horton M, Bassett DR. Validity of ActiGraph child-specific equations during various physical activities. Med Sci Sports Exerc 2013; 45(7): 1403-1409.ArticlePubMedPMC
- 34. Pfeiffer KA, Schmitz KH, McMurray RG, Treuth MS, Murray DM, Pate RR. Variability in energy expenditure of selected activities in adolescent girls. Am J Prev Med 2006; 31: 328-331.PubMedPMC
REFERENCES
Fig. 1
* Statistically significant (p<0.001). (LD: Lying down, TV: Television viewing, RE: Reading, VA: Vacuuming, SW: Slow walking(2.5mph), BW: Brisk walking (3.5mph), SC: Stair climbing, RU: Running (5mph)).
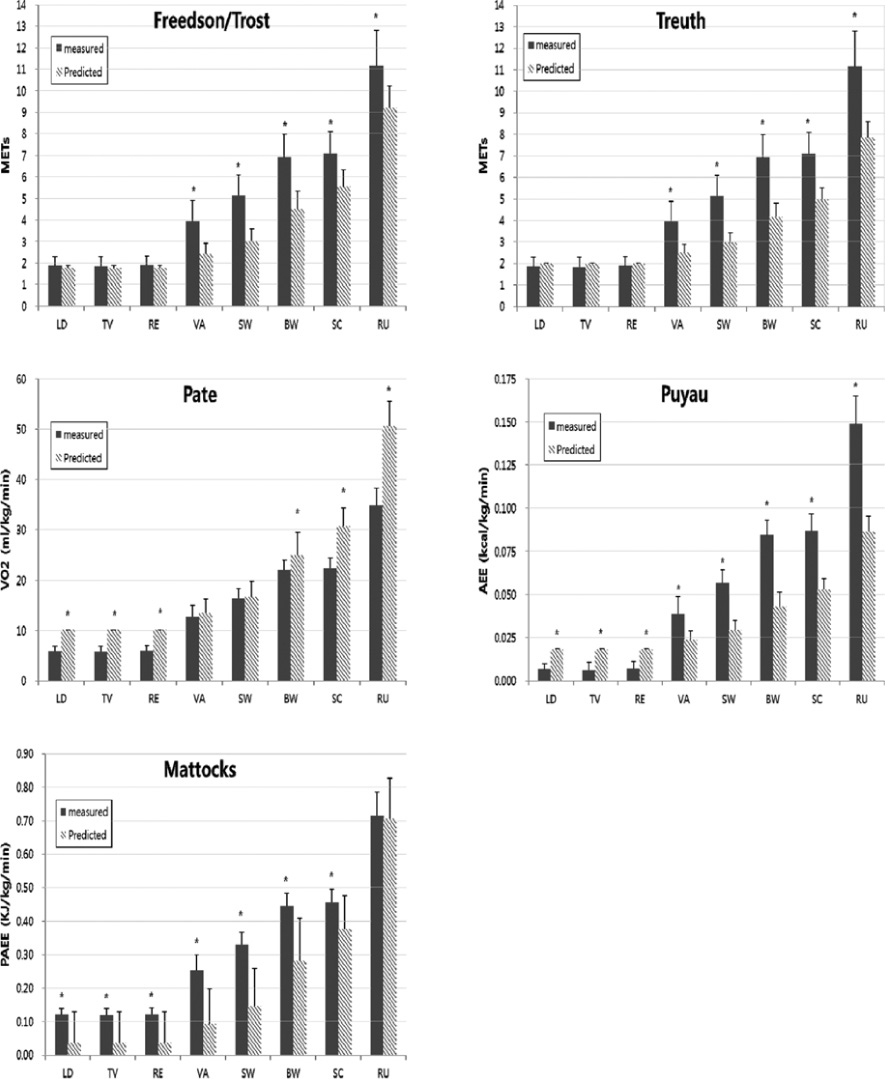
Comparison of predicted energy expenditure by ActiGraph with measured energy expenditure by K4b2.
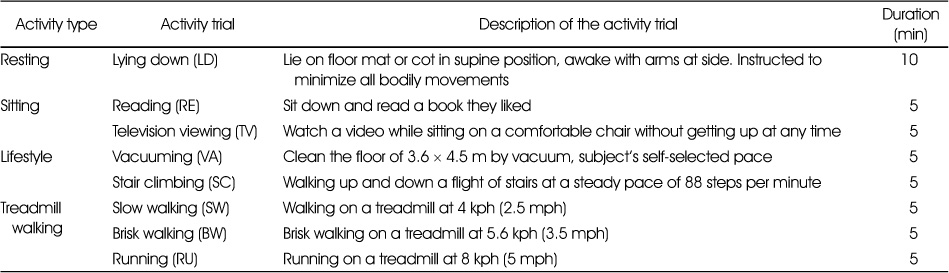
Table 2
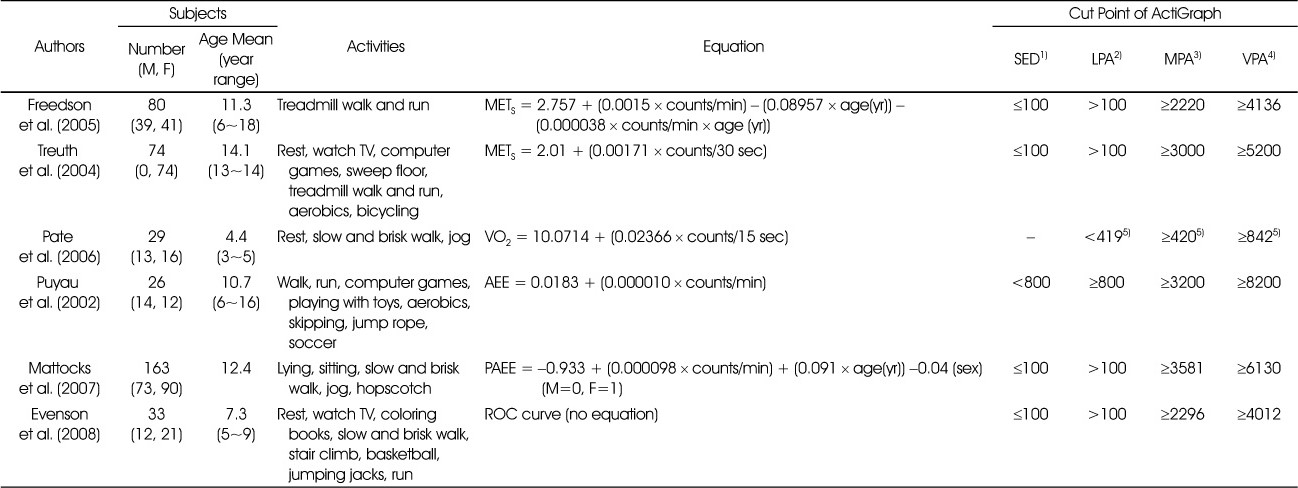
ActiGraph prediction models
1) SED: Sedentary activity
2) LPA: Light activity
3) MPA: Moderate activity
4) VPA: Vigorous activity
5) Per 15s, all other counts reported per minute
METS: Metabolic equivalents, VO2: Volume of oxygen consumption (ml/kg/min), AEE: activity energy expenditure (kcal/kg/min), PAEE: physical activity energy expenditure (KJ/kg/min)
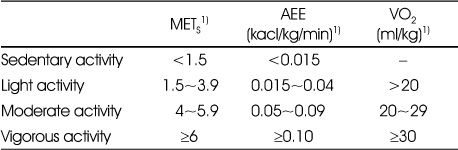
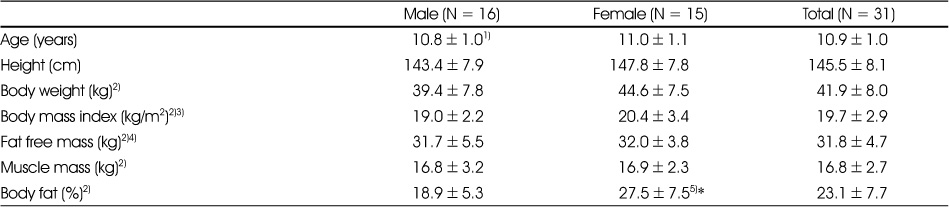
Table 5
Descriptive statistics for VO2, EE and ActiGraph counts for eight activity trials. Comparison of measured METS with the values ofFAO/WHO/UNU and Compendium child
1) Measured by Cosmed K4b2
2) VO2: Oxygen consumption
3) EE: Energy expenditure
4) FAO/WHO/UNU (1985)
5) Compendium Child METS by Ridley and Olds (2008)
6) Mean±SD
7) Slow walking (2.5 mph), Brisk walking (3.5 mph), Running (5 mph)
8) abc: Different superscripts indicate significant difference p<0.05 by Tukey's multiple comparison test
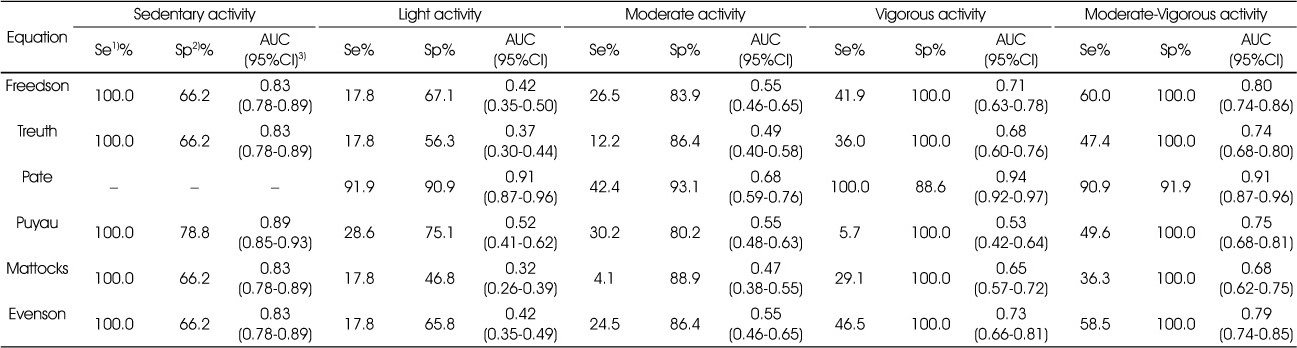
Figure & Data
REFERENCES
Citations
Citations to this article as recorded by 
- Developing a Multimodal Monitoring System for Geriatric Depression
Youngshin Cho, Kyuhee Lim, Sunghee Lee, Yuntae Kim, Mijung Kim, Chang Oh Kim, Youkyung Kim, Heejung Kim
CIN: Computers, Informatics, Nursing.2023; 41(1): 46. CrossRef - Comparison of Physical Activity Level, Physical Activity Pattern and Energy Expenditure in Male and Female Elementary School Soccer Players using Accelerometer and Physical Activity Diary
Hae-Sun An, Su-Ji Choi, Mo-Ran Lee, Jung-Sook Lee, Eun-Kyung Kim
Korean Journal of Community Nutrition.2017; 22(6): 529. CrossRef
 Cite
CiteAccuracy of Accelerometer for the Prediction of Energy Expenditure and Activity Intensity in Athletic Elementary School Children During Selected Activities

Fig. 1
Comparison of predicted energy expenditure by ActiGraph with measured energy expenditure by K4b2.
* Statistically significant (p<0.001). (LD: Lying down, TV: Television viewing, RE: Reading, VA: Vacuuming, SW: Slow walking(2.5mph), BW: Brisk walking (3.5mph), SC: Stair climbing, RU: Running (5mph)).
Fig. 1
Accuracy of Accelerometer for the Prediction of Energy Expenditure and Activity Intensity in Athletic Elementary School Children During Selected Activities
Description of the eight activity trials
ActiGraph prediction models
1) SED: Sedentary activity
2) LPA: Light activity
3) MPA: Moderate activity
4) VPA: Vigorous activity
5) Per 15s, all other counts reported per minute
METS: Metabolic equivalents, VO2: Volume of oxygen consumption (ml/kg/min), AEE: activity energy expenditure (kcal/kg/min), PAEE: physical activity energy expenditure (KJ/kg/min)
Cut off points of physical activity intensity by Trost (2011)
1) Measured by Cosmed K4b2
Anthropometric measurements of subjects
1) Mean±SD
2) Measured by Inbody 620
3) Body weight (kg)/[Height (m)]2
4) Body weight (kg)−Fat mass (kg)
5) Significant difference between male and female was tested by Mann-Whitney test *: p<0.01
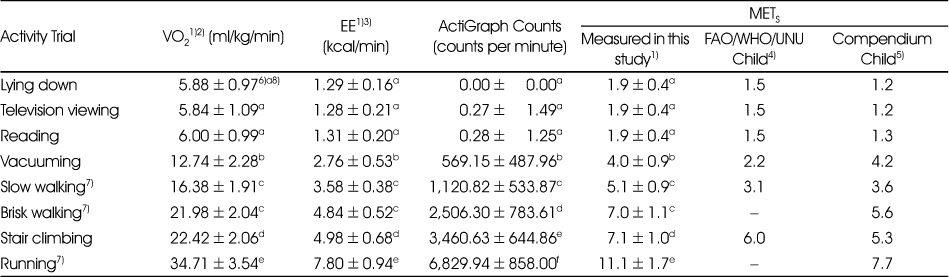
Descriptive statistics for VO2, EE and ActiGraph counts for eight activity trials. Comparison of measured METS with the values ofFAO/WHO/UNU and Compendium child
1) Measured by Cosmed K4b2
2) VO2: Oxygen consumption
3) EE: Energy expenditure
4) FAO/WHO/UNU (1985)
5) Compendium Child METS by Ridley and Olds (2008)
6) Mean±SD
7) Slow walking (2.5 mph), Brisk walking (3.5 mph), Running (5 mph)
8) abc: Different superscripts indicate significant difference p<0.05 by Tukey's multiple comparison test
Sensitivity, specificity, and area under the ROC curve (ROC°©AUC) values for the classification of sedentary, light, moderate and vigorous activity
1) Se: Sensitivity
2) Sp: Specificity
3) AUC: area under curve, CI: confidence interval
Table 1
Description of the eight activity trials
Table 2
ActiGraph prediction models
1) SED: Sedentary activity 2) LPA: Light activity 3) MPA: Moderate activity 4) VPA: Vigorous activity 5) Per 15s, all other counts reported per minute METS: Metabolic equivalents, VO2: Volume of oxygen consumption (ml/kg/min), AEE: activity energy expenditure (kcal/kg/min), PAEE: physical activity energy expenditure (KJ/kg/min)
Table 3
Cut off points of physical activity intensity by Trost (2011)
1) Measured by Cosmed K4b2
Table 4
Anthropometric measurements of subjects
1) Mean±SD 2) Measured by Inbody 620 3) Body weight (kg)/[Height (m)]2 4) Body weight (kg)−Fat mass (kg) 5) Significant difference between male and female was tested by Mann-Whitney test *: p<0.01
Table 5
Descriptive statistics for VO2, EE and ActiGraph counts for eight activity trials. Comparison of measured METS with the values ofFAO/WHO/UNU and Compendium child
1) Measured by Cosmed K4b2 2) VO2: Oxygen consumption 3) EE: Energy expenditure 4) FAO/WHO/UNU (1985) 5) Compendium Child METS by Ridley and Olds (2008) 6) Mean±SD 7) Slow walking (2.5 mph), Brisk walking (3.5 mph), Running (5 mph) 8) abc: Different superscripts indicate significant difference p<0.05 by Tukey's multiple comparison test
Table 6
Sensitivity, specificity, and area under the ROC curve (ROC°©AUC) values for the classification of sedentary, light, moderate and vigorous activity
1) Se: Sensitivity 2) Sp: Specificity 3) AUC: area under curve, CI: confidence interval


