
Articles
- Page Path
- HOME > Korean J Community Nutr > Volume 19(6); 2014 > Article
-
Research Article
- The Measurements of the Resting Metabolic Rate (RMR) and the Accuracy of RMR Predictive Equations for Korean Farmers
- Hee-Ryoung Son, Seo-Eun Yeon, Jung-Sook Choi, Eun-Kyung Kim
-
Korean Journal of Community Nutrition 2014;19(6):568-580.
DOI: https://doi.org/10.5720/kjcn.2014.19.6.568
Published online: December 31, 2014
1)Department of Food and Nutrition, Gangneung-Wonju National University, Gangwon, Korea.
2)National Academy of Agricultural Science, Rural Development Administration, Jeonbuk, Korea.
- Corresponding author: Eun Kyung Kim. Department of Food & Nutrition, Gangneung-Wonju National University,7 Jukheon road, Gangneung, Gangwon 210-702, Korea. Tel: (033) 640-2336, Fax: (33) 640-2330, ekkim@gwnu.ac.kr
• Received: August 6, 2014 • Revised: November 18, 2014 • Accepted: December 5, 2014
Copyright © 2014 The Korean Society of Community Nutrition
This is an Open-Access article distributed under the terms of the Creative Commons Attribution Non-Commercial License (http://creativecommons.org/licenses/by-nc/3.0/) which permits unrestricted non-commercial use, distribution, and reproduction in any medium, provided the original work is properly cited.
- 2,118 Views
- 3 Download
- 4 Crossref
Abstract
-
Objectives
- The purpose of this study was to measure the resting metabolic rate (RMR) and to assess the accuracy of RMR predictive equations for Korean farmers.
-
Methods
- Subjects were 161 healthy Korean farmers (50 males, 111 females) in Gangwon-area. The RMR was measured by indirect calorimetry for 20 minutes following a 12-hour overnight fasting. Selected predictive equations were Harris-Benedict, Mifflin, Liu, KDRI, Cunningham (1980, 1991), Owen-W, F, FAO/WHO/UNU-W, WH, Schofield-W, WH, Henry-W, WH. The accuracy of the equations was evaluated on the basis of bias, RMSPE, accurate prediction and Bland-Altman plot. Further, new RMR predictive equations for the subjects were developed by multiple regression analysis using the variables highly related to RMR.
-
Results
- The mean of the measured RMR was 1703 kcal/day in males and 1343 kcal/day in females. The Cunningham (1980) equation was the closest to measured RMR than others in males and in females (males Bias -0.47%, RMSPE 110 kcal/day, accurate prediction 80%, females Bias 1.4%, RMSPE 63 kcal/day, accurate prediction 81%). Body weight, BMI, circumferences of waist and hip, fat mass and FFM were significantly correlated with measured RMR. Thus, derived prediction equation as follow: males RMR = 447.5 + 17.4·Wt, females RMR = 684.5 - 3.5·Ht + 11.8·Wt + 12.4·FFM.
-
Conclusions
- This study showed that Cunningham (1980) equation was the most accurate to predict RMR of the subjects. Thus, Cunningham (1980) equation could be used to predict RMR of Korean farmers studied in this study. Future studies including larger subjects should be carried out to develop RMR predictive equations for Korean farmers.
- 1. Bland JM, Altman DG. Statistical methods for assessing agreement between two methods of clinical measurement. Lancet 1986; 1(8476): 307-310.ArticlePubMed
- 2. Bleiberg FM, Brun TA, Goihman S, Gouba E. Duration of activities and energy expenditure of female farmers in dry and rainy seasons in Upper-Volta. Br J Nutr 1980; 43(1): 71-82.ArticlePubMed
- 3. Chang UJ, Lee KR. Correlation between measured resting energy expenditure and predicted basal energy expenditure in female college students. J Korean Soc Food Sci Nutr 2005; 34(2): 196-201.Article
- 4. Crouter SE, Antczak A, Hudak JR, DellaValle DM, Haas JD. Accuracy and reliability of the ParvoMedics TrueOne 2400 and MedGraphics VO2000 metabolic systems. Eur J Appl Physiol 2006; 98(2): 139-151.ArticlePubMedPDF
- 5. Cunningham JJ. A reanalysis of the factors influencing basal metabolic rate in normal adults. Am J Clin Nutr 1980; 33(11): 2372-2374.ArticlePubMed
- 6. Daly JM, Heymsfield SB, Head CA, Harvey LP, Nixon DW, Katzeff H, Grossman GD. Human energy requirements: overestimation by widely used prediction equation. Am J Clin Nutr 1985; 42(6): 1170-1174.ArticlePubMed
- 7. Food and Agriculture Organization of the United Nations. World Health Organization. United Nations University. Energy and protein requirements: report of a joint FAO/WHO/UNU expert consultation. Geneva: World Health Organization; 1985.
- 8. Garby L, Garrow JS, Jørgensen B, Lammert O, Madsen K, Sørensen P, Webster J. Relation between energy expenditure and body composition in man: specific energy expenditure in vivo of fat and fat-free tissue. Eur J Clin Nutr 1988; 42(4): 301-305.PubMed
- 9. Hayter JE, Henry CJ. Basal metabolic rate in human subjects migrating between tropical and temperate regions: a longitudinal study and review of previous work. Eur J Clin Nutr 1993; 47(10): 724-734.PubMed
- 10. Hayter JE, Henry CJ. A re-examination of basal metabolic rate predictive equations: the importance of geographic origin of subjects in sample selection. Eur J Clin Nutr 1994; 48(10): 702-707.PubMed
- 11. Henry CJ. Basal metabolic rate studies in humans: measurement and development of new equations. Public Health Nutr 2005; 8(7A): 1133-1152.ArticlePubMed
- 12. Kim EK, Kim GS, Park JS. Comparison of activity factor, predicted resting metabolic rate, and intakes of energy and nutrients between athletic and non-athletic high school students. J Korean Diet Assoc 2009; 15(1): 52-68.
- 13. Kim EK, Lee SH, Ko SY, Yeon SE, Choe JS. Assessment of physical activity level of Korean farmers to establish estimated energy requirements during busy farming season. Korean J Community Nutr 2011; 16(6): 751-761.Article
- 14. Kim HR. The relationship of socioeconomic position and health behaviors with morbidity in Seoul, Korea. Health Soc Welf Rev 2005; 25(2): 3-35.
- 15. Lee GH, Kim MH, Kim EK. Accuracy of predictive equations for resting metabolic rate in Korean college students. Korean J Community Nutr 2009; 14(4): 462-473.
- 16. Lee HC. Estimating optimum level of population in rural areas based on rural population forecasts and over-depopulation classification schemes. J Rural Tour 2007; 14(1): 159-181.
- 17. Lee JS, Lee GH, Kim EK. Comparison of measured and predicted resting metabolic rate of 30-40 aged Korean women. J Korean Diet Assoc 2007; 13(2): 157-168.
- 18. Lee SH, Yeon SE, Son HR, Choi JS, Kim EK. Assessment of energy intake and physical activity level for Korean farmers to establish estimated energy requirements during the off-season for farmers. Korean J Community Nutr 2012; 17(5): 652-663.Article
- 19. Yim KS. Energy metabolism in obesity. J Korean Soc Study Obes 2001; 10(3): 271-282.
- 20. Liu HY, Lu YF, Chen WJ. Predictive equations for basal metabolic rate in Chinese adults: a cross-validation study. J Am Diet Assoc 1995; 95(12): 1403-1408.PubMed
- 21. Lührmann PM, Herbert BM, Krems C, Neuhäuser-Berthold M. A new equation especially developed for predicting resting metabolic rate in the elderly for easy use in practice. Eur J Nutr 2002; 41(3): 108-113.ArticlePubMedPDF
- 22. Mifflin MD, St Jeor ST, Hill LA, Scott BJ, Daugherty SA, Koh YO. A new predictive equation for resting energy expenditure in healthy individuals. Am J Clin Nutr 1990; 51(2): 241-247.ArticlePubMed
- 23. Miller AT Jr, Blyth CS. Lean body mass as a metabolic reference standard. J Appl Physiol 1953; 5(7): 311-316.ArticlePubMed
- 24. Owen OE, Holup JL, D'Alessio DA, Craig ES, Polansky M, Smalley KJ, Kavle EC, Bushman MC, Owen LR, Mozzoli MA, Kendrick ZV, Boden GH. A reappraisal of the caloric requirements of men. Am J Clin Nutr 1987; 46(6): 875-885.ArticlePubMed
- 25. Owen OE, Kavle E, Owen RS, Polansky M, Caprio S, Mozzoli MA, Kendrick ZV, Bushman MC, Boden G. A reappraisal of caloric requirements in healthy women. Am J Clin Nutr 1986; 44(1): 1-19.ArticlePubMed
- 26. Park JA, Kim KJ, Kim JH, Park YS, Koo J, Yoon JS. A comparison of the resting energy expenditure of Korean adults using indirect calorimetry. Korean J Community Nutr 2003; 8(6): 993-1000.
- 27. Park J, Kazuko IT, Kim E, Kim J, Yoon J. Estimating freeliving human energy expenditure: practical aspects of the doubly labeled water method and its applications. Nutr Res Pract 2014; 8(3): 241-248.ArticlePubMedPMC
- 28. Schofield WN, Schofield C, James WP. Basal metabolic rate: review and prediction, together with an annotated bibliography of source material. Hum Nutr Clin Nutr 1985; 39C: suppl. 1. 5-96.
- 29. Singh J, Prentice AM, Diaz E, Coward WA, Ashford J, Sawyer M, Whitehead RG. Energy expenditure of Gambian women during peak agricultural activity measured by the doubly-labelled water method. Br J Nutr 1989; 62(2): 315-329.ArticlePubMed
- 30. Suh MK. Health states of the elderly and policy implications. J Korea Gerontol Soc 1995; 15(1): 28-39.
- 31. Taaffe DR, Thompson J, Butterfield G, Marcus R. Accuracy of equations to predict basal metabolic rate in older women. J Am Diet Assoc 1995; 95(12): 1387-1392.ArticlePubMed
- 32. The Korean Nutrition Society. Dietary reference intakes for Koreans. Seoul: The Korean Nutrition Society; 2005.
- 33. The Korean Nutrition Society. Dietary reference intakes for Koreans. Seoul: The Korean Nutrition Society; 2010.
- 34. Tzankoff SP, Norris AH. Effect of muscle mass decrease on age-related BMR changes. J Appl Physiol Respir Environ Exerc Physiol 1977; 43(6): 1001-1006.ArticlePubMed
- 35. Tzankoff SP, Norris AH. Longitudinal changes in basal metabolism in man. J Appl Physiol Respir Environ Exerc Physiol 1978; 45(4): 536-539.ArticlePubMed
- 36. Weir JB. New methods for calculating metabolic rate with special reference to protein metabolism. 1949. Nutrition 1990; 6(3): 213-221.PubMed
- 37. World Health Organization. Obesity: preventing and managing the global epidemic. Report of a WHO Consultation. Geneva: World Health Organization; 2000.
- 38. Yamauchi T, Ohtsuka R. Basal metabolic rate and energy costs at rest and during exercise in rural- and urban-dwelling Papua New Guinea highlanders. Eur J Clin Nutr 2000; 54(6): 494-499.ArticlePubMedPDF
- 39. Yeon SE, Son HR, Choi JS, Kim EK. Relationships among serum adiponectin, leptin and vitamin D concentrations and the metabolic syndrome in farmers. Korean J Community Nutr 2014; 19(1): 12-26.Article
REFERENCES
Fig. 1Bland-Altman plots for measured RMR and predicted RMR derived from 5 selected equations (WHO_W, WHO_WH, Scho_W, Scho_WH, Cunningham_80) for male subjects
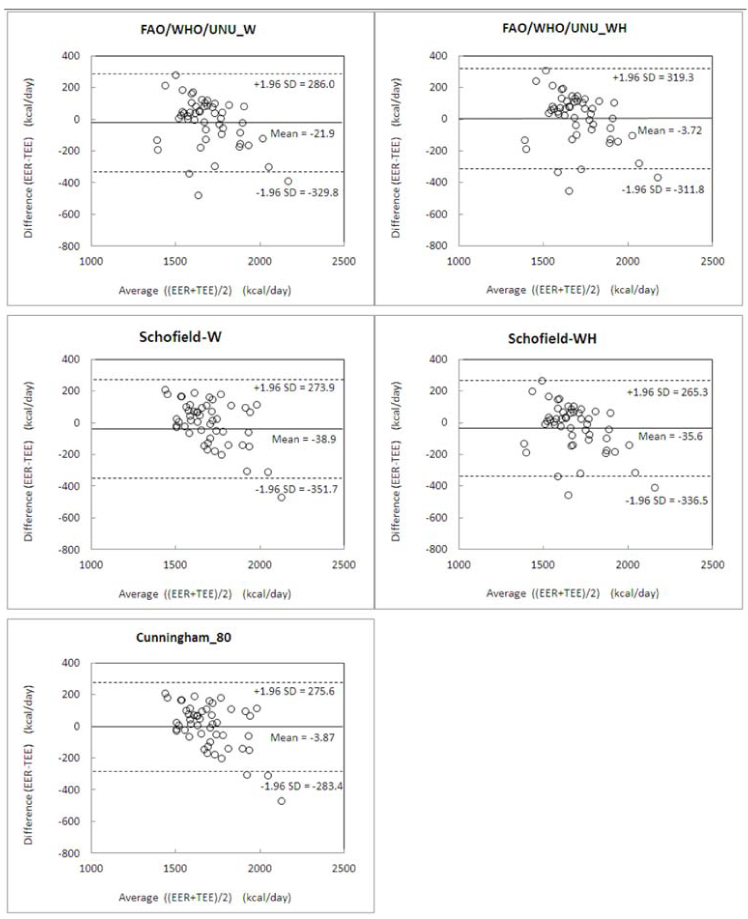
Fig. 2Bland-Altman plots for measured RMR and predicted RMR derived from 5 selected equations (WHO_W, WHO_WH, Scho_W, Scho_WH, Cunningham_80) for female subjects
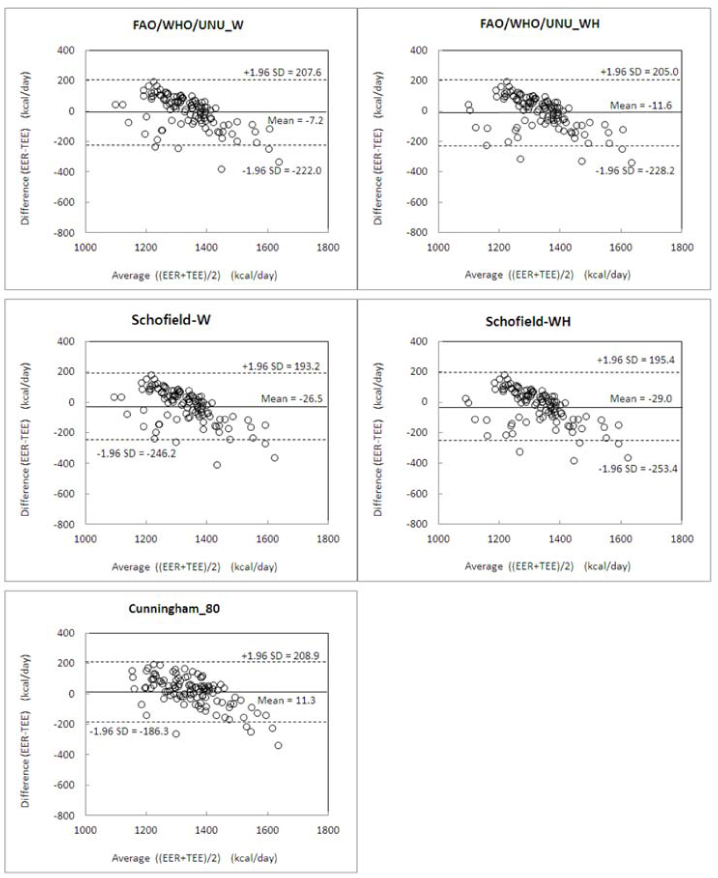
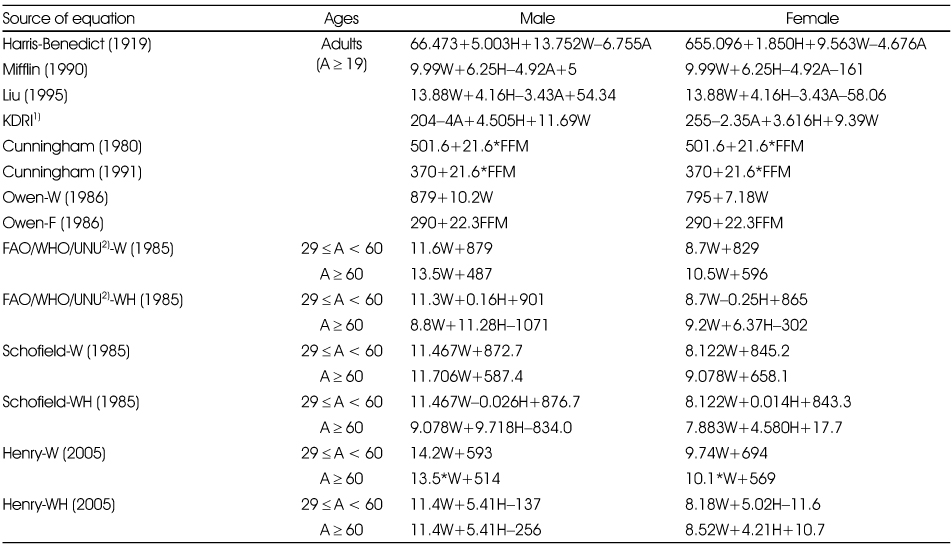
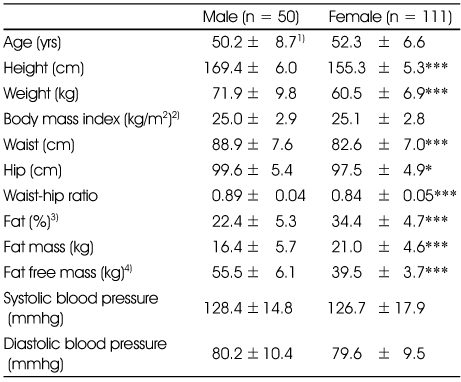
Table 3Measured resting metabolic rate and adjusted resting metabolic rate for body weight and fat free mass
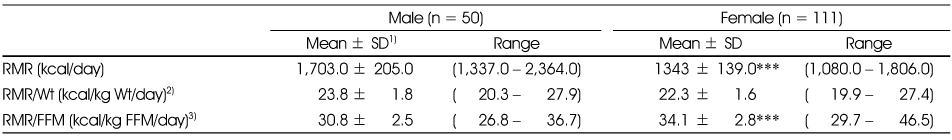
Table 4Assessment of resting metabolic rate predictive equations based on bias, RMSPE and accurate prediction (%) in male subjects
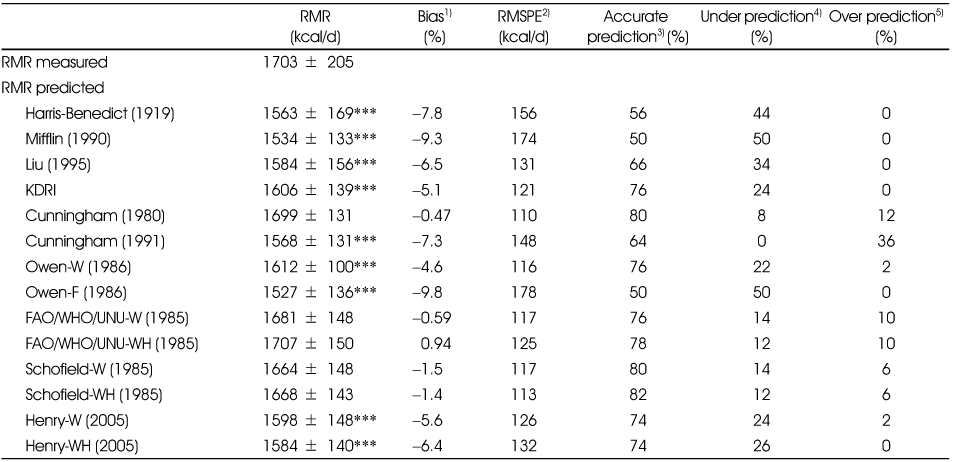
1) [(predicted RMR - measured RMR) / measured RMR] × 100
2)
3) Percentage of subjects predicted by equation within 90% to 110% of measured RMR
4) Percentage of subjects predicted by equation < 90% of measured RMR
5) Percentage of subjects predicted by equation > 110% of measured RMR
***: p < 0.001 Significantly different between measured RMR and predicted RMR by paired t-test
Table 5Assessment of resting metabolic rate predictive equations based on bias, RMSPE and accurate prediction (%) in female subjects
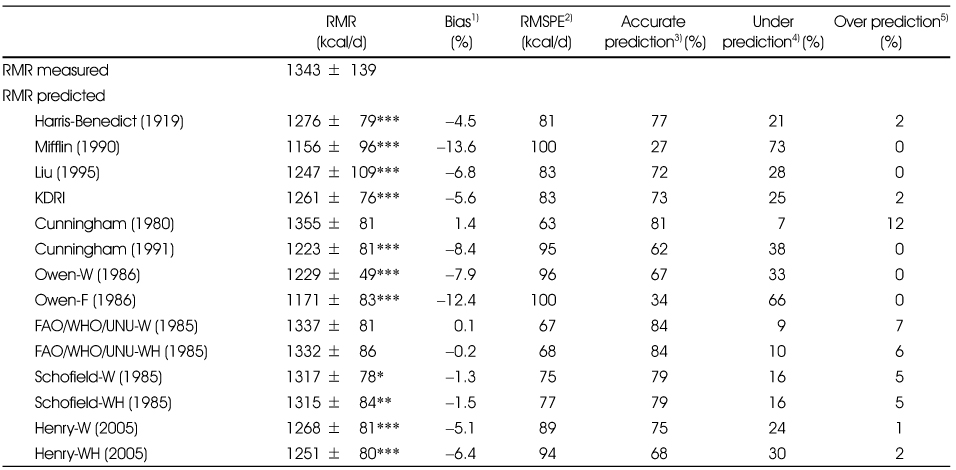
1) [(predicted RMR - measured RMR) / measured RMR] × 100
2)
3) Percentage of subjects predicted by equation within 90% to 110% of measured RMR
4) Percentage of subjects predicted by equation < 90% of measured RMR
5) Percentage of subjects predicted by equation > 110% of measured RMR
*: p < 0.05, **: p < 0.01,***: p < 0.001 Significantly different between measured RMR and predicted RMR by paired t-test
Table 6Pearson's correlation coefficient (r) between measured resting metabolic rate and related variables
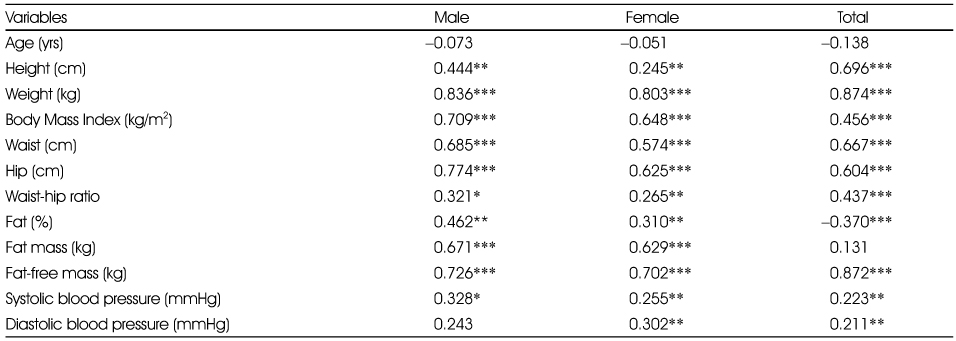
Table 7Development of new predictive equations for resting metabolic rate by stepwise multiple regression analysis

Abbreviation: RMR; Resting metabolic rate, Wt; weight, Ht; height, BMI; body mass index, FFM; fat free mass, WHR; wasit/hip ratio, SBP; systolic blood pressure, DBP; diastolic blood pressure
- Equation 1 : Age, Ht, Wt, BMI, Waist, Hip, WHR, Fat (%), Fat mass, FFM, SBP, DBP
- Equation 2 : Male (Ht, Wt, BMI, Waist, Hip, Fat (%), Fat mass, FFM), Female (Ht, Wt, BMI, Waist, Hip, WHR, Fat (%), Fat mass, FFM, SBP, DBP)
- Equation 3 : Age, Wt, Ht, FFM
Figure & Data
REFERENCES
Citations
Citations to this article as recorded by 
- Resting energy expenditure in Korean type 2 diabetes patients: comparison between measured and predicted values
Ji-Sook Park, Sung-Rae Cho, Jung-Eun Yim
Nutrition Research and Practice.2023; 17(3): 464. CrossRef - Comparison of Various Predictive Energy Equations for Female University Students With Measured Basal Metabolic Rate
Reci Meseri, Özge Küçükerdönmez, Rana Nagihan Akder
Topics in Clinical Nutrition.2022; 37(4): 314. CrossRef - Comparison of Predicted and Measured Resting Energy Expenditure in Overweight and Obese Korean Women
Ji-Sook Park, Jung-Eun Yim
Korean Journal of Community Nutrition.2018; 23(5): 424. CrossRef - Validity of predictive equations for resting energy expenditure in Korean non-obese adults
Didace Ndahimana, Yeon-Jung Choi, Jung-Hye Park, Mun-Jeong Ju, Eun-Kyung Kim
Nutrition Research and Practice.2018; 12(4): 283. CrossRef
 Cite
CiteThe Measurements of the Resting Metabolic Rate (RMR) and the Accuracy of RMR Predictive Equations for Korean Farmers


Fig. 1
Bland-Altman plots for measured RMR and predicted RMR derived from 5 selected equations (WHO_W, WHO_WH, Scho_W, Scho_WH, Cunningham_80) for male subjects
Fig. 2
Bland-Altman plots for measured RMR and predicted RMR derived from 5 selected equations (WHO_W, WHO_WH, Scho_W, Scho_WH, Cunningham_80) for female subjects
Fig. 1
Fig. 2
The Measurements of the Resting Metabolic Rate (RMR) and the Accuracy of RMR Predictive Equations for Korean Farmers
Equations used to predict the resting metabolic rate in the study
Abbreviation: W, Weight in kg; H, Height in cm; A, Age in years; FFM, Fat free mass in kg.
1) Koreans Dietary Reference Intakes
2) Food and Agriculture Organization/World Health Organization/United Nations University
Characteristics of the study subjects
1) Mean±SD
2) Weight (kg) / [Height (m)]2
3) Measured by inbody 720
4) Weight (kg) - fat mass (kg)
*: p < 0.05, ***: p < 0.001 Significantly different between male and female by t-test
Measured resting metabolic rate and adjusted resting metabolic rate for body weight and fat free mass
1) Standard deviation
2) RMR (resting metabolic rate) adjusted for body Wt (Weight)
3) RMR adjusted for FFM (Fat Free Mass)
***: p < 0.001 Significantly different between male and female by t-test
Assessment of resting metabolic rate predictive equations based on bias, RMSPE and accurate prediction (%) in male subjects
1) [(predicted RMR - measured RMR) / measured RMR] × 100
2)
3) Percentage of subjects predicted by equation within 90% to 110% of measured RMR
4) Percentage of subjects predicted by equation < 90% of measured RMR
5) Percentage of subjects predicted by equation > 110% of measured RMR
***: p < 0.001 Significantly different between measured RMR and predicted RMR by paired t-test
Assessment of resting metabolic rate predictive equations based on bias, RMSPE and accurate prediction (%) in female subjects
1) [(predicted RMR - measured RMR) / measured RMR] × 100
2)
3) Percentage of subjects predicted by equation within 90% to 110% of measured RMR
4) Percentage of subjects predicted by equation < 90% of measured RMR
5) Percentage of subjects predicted by equation > 110% of measured RMR
*: p < 0.05, **: p < 0.01,***: p < 0.001 Significantly different between measured RMR and predicted RMR by paired t-test
Pearson's correlation coefficient (r) between measured resting metabolic rate and related variables
*: p < 0.05, **: p < 0.01, ***: p < 0.001 by Pearson's correlation
Development of new predictive equations for resting metabolic rate by stepwise multiple regression analysis
Abbreviation: RMR; Resting metabolic rate, Wt; weight, Ht; height, BMI; body mass index, FFM; fat free mass, WHR; wasit/hip ratio, SBP; systolic blood pressure, DBP; diastolic blood pressure
- Equation 1 : Age, Ht, Wt, BMI, Waist, Hip, WHR, Fat (%), Fat mass, FFM, SBP, DBP
- Equation 2 : Male (Ht, Wt, BMI, Waist, Hip, Fat (%), Fat mass, FFM), Female (Ht, Wt, BMI, Waist, Hip, WHR, Fat (%), Fat mass, FFM, SBP, DBP)
- Equation 3 : Age, Wt, Ht, FFM
Table 1
Equations used to predict the resting metabolic rate in the study
Abbreviation: W, Weight in kg; H, Height in cm; A, Age in years; FFM, Fat free mass in kg. 1) Koreans Dietary Reference Intakes 2) Food and Agriculture Organization/World Health Organization/United Nations University
Table 2
Characteristics of the study subjects
1) Mean±SD 2) Weight (kg) / [Height (m)]2 3) Measured by inbody 720 4) Weight (kg) - fat mass (kg) *: p < 0.05, ***: p < 0.001 Significantly different between male
and female by t-test
Table 3
Measured resting metabolic rate and adjusted resting metabolic rate for body weight and fat free mass
1) Standard deviation 2) RMR (resting metabolic rate) adjusted for body Wt (Weight) 3) RMR adjusted for FFM (Fat Free Mass) ***: p < 0.001 Significantly different between male and female by t-test
Table 4
Assessment of resting metabolic rate predictive equations based on bias, RMSPE and accurate prediction (%) in male subjects
1) [(predicted RMR - measured RMR) / measured RMR] × 100 2) 3) Percentage of subjects predicted by equation within 90% to 110% of measured RMR 4) Percentage of subjects predicted by equation < 90% of measured RMR 5) Percentage of subjects predicted by equation > 110% of measured RMR ***: p < 0.001 Significantly different between measured RMR and predicted RMR by paired t-test
Table 5
Assessment of resting metabolic rate predictive equations based on bias, RMSPE and accurate prediction (%) in female subjects
1) [(predicted RMR - measured RMR) / measured RMR] × 100 2) 3) Percentage of subjects predicted by equation within 90% to 110% of measured RMR 4) Percentage of subjects predicted by equation < 90% of measured RMR 5) Percentage of subjects predicted by equation > 110% of measured RMR *: p < 0.05, **: p < 0.01,***: p < 0.001 Significantly different between measured RMR and predicted RMR by paired t-test
Table 6
Pearson's correlation coefficient (r) between measured resting metabolic rate and related variables
*: p < 0.05, **: p < 0.01, ***: p < 0.001 by Pearson's correlation
Table 7
Development of new predictive equations for resting metabolic rate by stepwise multiple regression analysis
Abbreviation: RMR; Resting metabolic rate, Wt; weight, Ht; height, BMI; body mass index, FFM; fat free mass, WHR; wasit/hip ratio, SBP; systolic blood pressure, DBP; diastolic blood pressure - Equation 1 : Age, Ht, Wt, BMI, Waist, Hip, WHR, Fat (%), Fat mass, FFM, SBP, DBP - Equation 2 : Male (Ht, Wt, BMI, Waist, Hip, Fat (%), Fat mass, FFM), Female (Ht, Wt, BMI, Waist, Hip, WHR, Fat (%), Fat mass, FFM, SBP, DBP) - Equation 3 : Age, Wt, Ht, FFM


