
Articles
- Page Path
- HOME > Korean J Community Nutr > Volume 19(6); 2014 > Article
-
Research Article
- The Measurements of the Resting Metabolic Rate (RMR) and the Accuracy of RMR Predictive Equations for Korean Farmers
- Hee-Ryoung Son, Seo-Eun Yeon, Jung-Sook Choi, Eun-Kyung Kim
-
Korean Journal of Community Nutrition 2014;19(6):568-580.
DOI: https://doi.org/10.5720/kjcn.2014.19.6.568
Published online: December 31, 2014
1)Department of Food and Nutrition, Gangneung-Wonju National University, Gangwon, Korea.
2)National Academy of Agricultural Science, Rural Development Administration, Jeonbuk, Korea.
- Corresponding author: Eun Kyung Kim. Department of Food & Nutrition, Gangneung-Wonju National University,7 Jukheon road, Gangneung, Gangwon 210-702, Korea. Tel: (033) 640-2336, Fax: (33) 640-2330, ekkim@gwnu.ac.kr
• Received: August 6, 2014 • Revised: November 18, 2014 • Accepted: December 5, 2014
Copyright © 2014 The Korean Society of Community Nutrition
This is an Open-Access article distributed under the terms of the Creative Commons Attribution Non-Commercial License (http://creativecommons.org/licenses/by-nc/3.0/) which permits unrestricted non-commercial use, distribution, and reproduction in any medium, provided the original work is properly cited.
- 689 Views
- 2 Download
- 4 Crossref
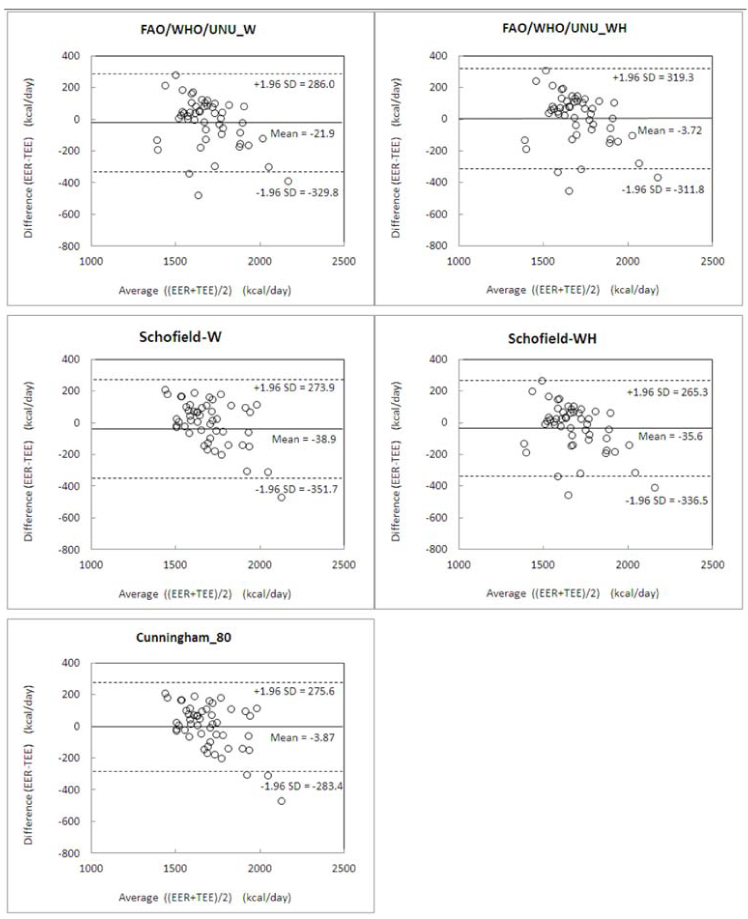
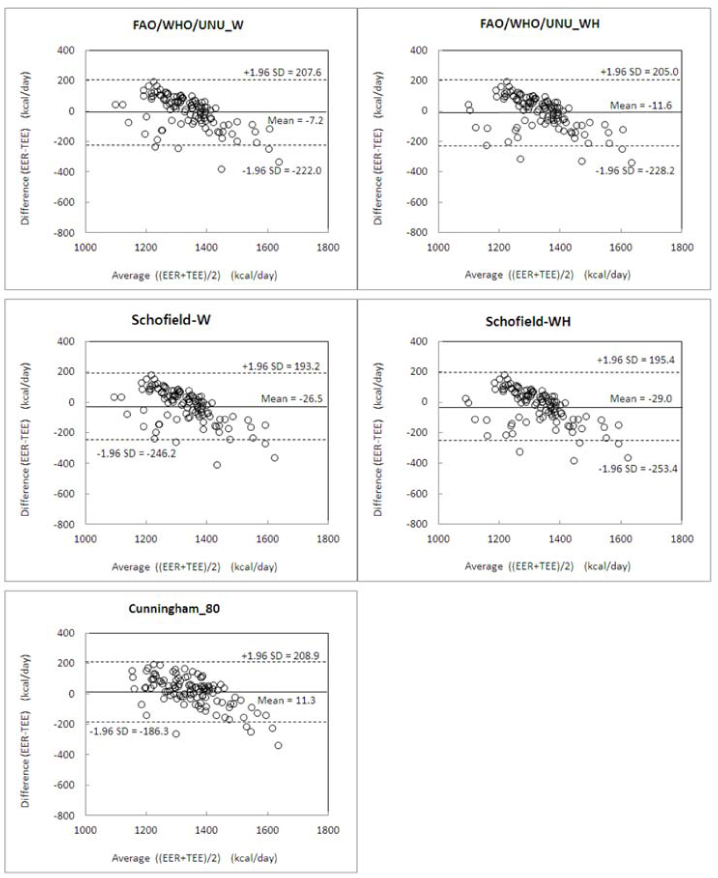
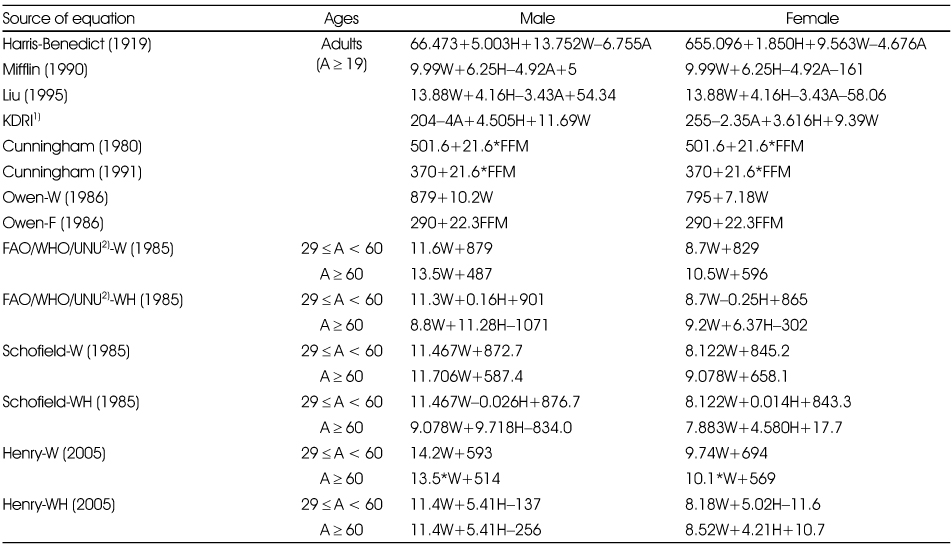
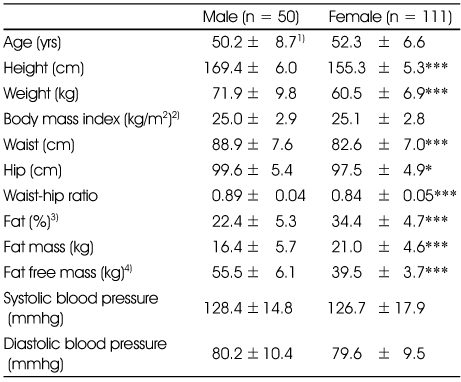
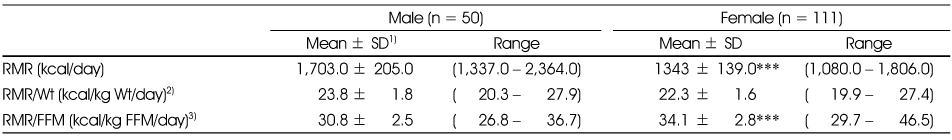
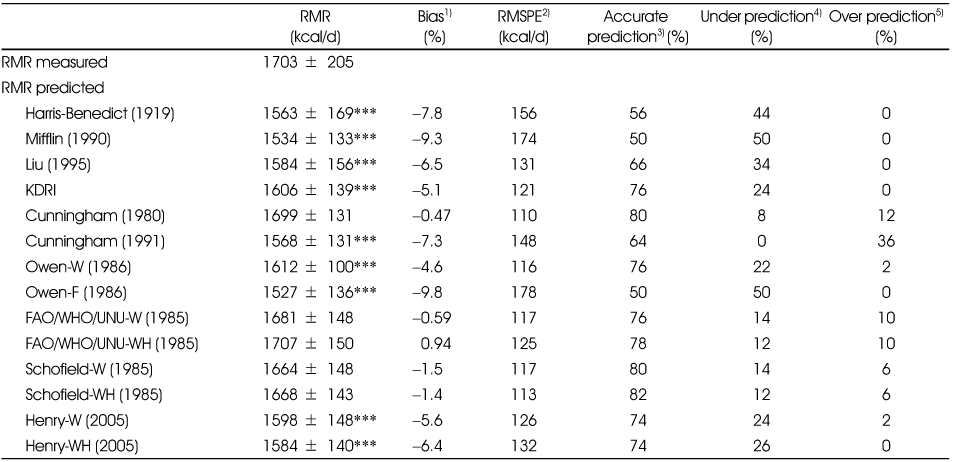
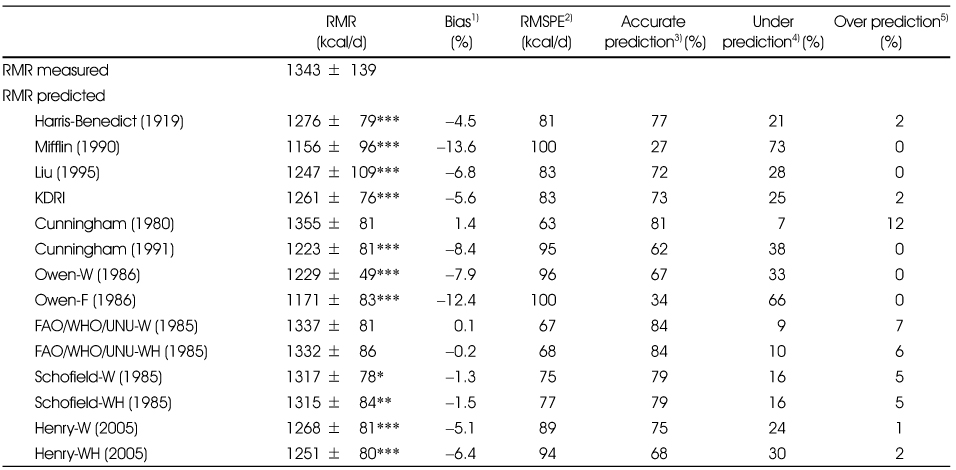
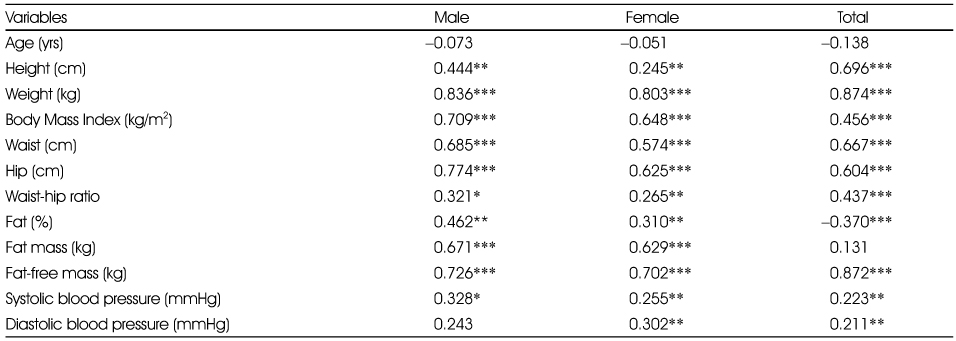

Figure & Data
REFERENCES
Citations
Citations to this article as recorded by 
- Resting energy expenditure in Korean type 2 diabetes patients: comparison between measured and predicted values
Ji-Sook Park, Sung-Rae Cho, Jung-Eun Yim
Nutrition Research and Practice.2023; 17(3): 464. CrossRef - Comparison of Various Predictive Energy Equations for Female University Students With Measured Basal Metabolic Rate
Reci Meseri, Özge Küçükerdönmez, Rana Nagihan Akder
Topics in Clinical Nutrition.2022; 37(4): 314. CrossRef - Comparison of Predicted and Measured Resting Energy Expenditure in Overweight and Obese Korean Women
Ji-Sook Park, Jung-Eun Yim
Korean Journal of Community Nutrition.2018; 23(5): 424. CrossRef - Validity of predictive equations for resting energy expenditure in Korean non-obese adults
Didace Ndahimana, Yeon-Jung Choi, Jung-Hye Park, Mun-Jeong Ju, Eun-Kyung Kim
Nutrition Research and Practice.2018; 12(4): 283. CrossRef
 PubReader
 Cite
CiteThe Measurements of the Resting Metabolic Rate (RMR) and the Accuracy of RMR Predictive Equations for Korean Farmers


Fig. 1
Bland-Altman plots for measured RMR and predicted RMR derived from 5 selected equations (WHO_W, WHO_WH, Scho_W, Scho_WH, Cunningham_80) for male subjects
Fig. 2
Bland-Altman plots for measured RMR and predicted RMR derived from 5 selected equations (WHO_W, WHO_WH, Scho_W, Scho_WH, Cunningham_80) for female subjects
Fig. 1
Fig. 2
The Measurements of the Resting Metabolic Rate (RMR) and the Accuracy of RMR Predictive Equations for Korean Farmers
Equations used to predict the resting metabolic rate in the study
Abbreviation: W, Weight in kg; H, Height in cm; A, Age in years; FFM, Fat free mass in kg.
1) Koreans Dietary Reference Intakes
2) Food and Agriculture Organization/World Health Organization/United Nations University
Characteristics of the study subjects
1) Mean±SD
2) Weight (kg) / [Height (m)]2
3) Measured by inbody 720
4) Weight (kg) - fat mass (kg)
*: p < 0.05, ***: p < 0.001 Significantly different between male and female by t-test
Measured resting metabolic rate and adjusted resting metabolic rate for body weight and fat free mass
1) Standard deviation
2) RMR (resting metabolic rate) adjusted for body Wt (Weight)
3) RMR adjusted for FFM (Fat Free Mass)
***: p < 0.001 Significantly different between male and female by t-test
Assessment of resting metabolic rate predictive equations based on bias, RMSPE and accurate prediction (%) in male subjects
1) [(predicted RMR - measured RMR) / measured RMR] × 100
2)
3) Percentage of subjects predicted by equation within 90% to 110% of measured RMR
4) Percentage of subjects predicted by equation < 90% of measured RMR
5) Percentage of subjects predicted by equation > 110% of measured RMR
***: p < 0.001 Significantly different between measured RMR and predicted RMR by paired t-test
Assessment of resting metabolic rate predictive equations based on bias, RMSPE and accurate prediction (%) in female subjects
1) [(predicted RMR - measured RMR) / measured RMR] × 100
2)
3) Percentage of subjects predicted by equation within 90% to 110% of measured RMR
4) Percentage of subjects predicted by equation < 90% of measured RMR
5) Percentage of subjects predicted by equation > 110% of measured RMR
*: p < 0.05, **: p < 0.01,***: p < 0.001 Significantly different between measured RMR and predicted RMR by paired t-test
Pearson's correlation coefficient (r) between measured resting metabolic rate and related variables
*: p < 0.05, **: p < 0.01, ***: p < 0.001 by Pearson's correlation
Development of new predictive equations for resting metabolic rate by stepwise multiple regression analysis
Abbreviation: RMR; Resting metabolic rate, Wt; weight, Ht; height, BMI; body mass index, FFM; fat free mass, WHR; wasit/hip ratio, SBP; systolic blood pressure, DBP; diastolic blood pressure
- Equation 1 : Age, Ht, Wt, BMI, Waist, Hip, WHR, Fat (%), Fat mass, FFM, SBP, DBP
- Equation 2 : Male (Ht, Wt, BMI, Waist, Hip, Fat (%), Fat mass, FFM), Female (Ht, Wt, BMI, Waist, Hip, WHR, Fat (%), Fat mass, FFM, SBP, DBP)
- Equation 3 : Age, Wt, Ht, FFM
Table 1
Equations used to predict the resting metabolic rate in the study
Abbreviation: W, Weight in kg; H, Height in cm; A, Age in years; FFM, Fat free mass in kg. 1) Koreans Dietary Reference Intakes 2) Food and Agriculture Organization/World Health Organization/United Nations University
Table 2
Characteristics of the study subjects
1) Mean±SD 2) Weight (kg) / [Height (m)]2 3) Measured by inbody 720 4) Weight (kg) - fat mass (kg) *: p < 0.05, ***: p < 0.001 Significantly different between male
and female by t-test
Table 3
Measured resting metabolic rate and adjusted resting metabolic rate for body weight and fat free mass
1) Standard deviation 2) RMR (resting metabolic rate) adjusted for body Wt (Weight) 3) RMR adjusted for FFM (Fat Free Mass) ***: p < 0.001 Significantly different between male and female by t-test
Table 4
Assessment of resting metabolic rate predictive equations based on bias, RMSPE and accurate prediction (%) in male subjects
1) [(predicted RMR - measured RMR) / measured RMR] × 100 2) 3) Percentage of subjects predicted by equation within 90% to 110% of measured RMR 4) Percentage of subjects predicted by equation < 90% of measured RMR 5) Percentage of subjects predicted by equation > 110% of measured RMR ***: p < 0.001 Significantly different between measured RMR and predicted RMR by paired t-test
Table 5
Assessment of resting metabolic rate predictive equations based on bias, RMSPE and accurate prediction (%) in female subjects
1) [(predicted RMR - measured RMR) / measured RMR] × 100 2) 3) Percentage of subjects predicted by equation within 90% to 110% of measured RMR 4) Percentage of subjects predicted by equation < 90% of measured RMR 5) Percentage of subjects predicted by equation > 110% of measured RMR *: p < 0.05, **: p < 0.01,***: p < 0.001 Significantly different between measured RMR and predicted RMR by paired t-test
Table 6
Pearson's correlation coefficient (r) between measured resting metabolic rate and related variables
*: p < 0.05, **: p < 0.01, ***: p < 0.001 by Pearson's correlation
Table 7
Development of new predictive equations for resting metabolic rate by stepwise multiple regression analysis
Abbreviation: RMR; Resting metabolic rate, Wt; weight, Ht; height, BMI; body mass index, FFM; fat free mass, WHR; wasit/hip ratio, SBP; systolic blood pressure, DBP; diastolic blood pressure - Equation 1 : Age, Ht, Wt, BMI, Waist, Hip, WHR, Fat (%), Fat mass, FFM, SBP, DBP - Equation 2 : Male (Ht, Wt, BMI, Waist, Hip, Fat (%), Fat mass, FFM), Female (Ht, Wt, BMI, Waist, Hip, WHR, Fat (%), Fat mass, FFM, SBP, DBP) - Equation 3 : Age, Wt, Ht, FFM


