
Articles
- Page Path
- HOME > Korean J Community Nutr > Volume 19(2); 2014 > Article
-
Research Article
- Body Image, Risk of Disturbed Eating Attitudes and Weight Control of Female Junior High School Students by the Body Mass Index in Seoul
- Hyun-Jung Song, Hyun-Kyung Moon
-
Korean Journal of Community Nutrition 2014;19(2):111-121.
DOI: https://doi.org/10.5720/kjcn.2014.19.2.111
Published online: April 30, 2014
Department of Food and Nutrition, Dankook University, Gyeonggi-do, Korea.
- Corresponding author: Hyun-Kyung Moon. Department of Food and Nutrition, Dankook University, Gyeonggi-do, Korea. Tel: (031) 8005-3173, Fax: (031) 8029-7200, moonhk52@dankook.ac.kr
• Received: October 7, 2013 • Revised: December 10, 2013 • Accepted: March 25, 2014
Copyright © 2014 The Korean Society of Community Nutrition
This is an Open-Access article distributed under the terms of the Creative Commons Attribution Non-Commercial License (http://creativecommons.org/licenses/by-nc/3.0/) which permits unrestricted non-commercial use, distribution, and reproduction in any medium, provided the original work is properly cited.
- 1,924 Views
- 3 Download
- 4 Crossref
Abstract
-
Objectives
- In this study, perception of body image, eating attitudes and weight control were examined by the degree of obesity using Body Mass Index (BMI).
-
Methods
- Out of 420 questionnaires distributed to the female middle school students (aged 12-16 years), 407 were returned (97% response rate) and 395 were analyzed (94% analysis rate). Female students were divided into two groups based on the BMI percentile using the 2007 Korean National Growth Charts. (1) normal weight (5th percentile ≤ BMI < 85th percentile) (2) obese (85th percentile ≤ BMI) by 2007 Korean National Growth Charts. Satisfaction of self-body shape, risk of disturbed eating attitudes (Eating Attitude Test : EAT-26), and weight control behaviors were examined.
-
Results
- Distribution of the subjects by BMI was 74.5% of normal and 25.5% of obese. There were significant differences between self-perceived current body image and self-perceived ideal body image. The dissatisfaction of body image was higher in obese than in normal groups (p < 0.001). 51.4% of female students were unsatisfied with their body image, while 2.6% were very satisfied. Among the students unsatisfied with their body image, 150 (52.1%) were of normal weight and 48 (49.4%) were obese. EAT-26 total scores were significantly higher in the obese group (16.42 ± 8.23) compared with normal group (13.72 ± 8.10) (p < 0.01). Attempted to weight control were significantly different by the BMI (p < 0.001).
-
Conclusions
- This study concludes that there was desire to become thinner than current status in female students, even those with normal BMI. Many female students were dissatisfied with their body image and attempted to lose weight. It is harmful to their health and nutritional status if they choose undesirable methods. These findings suggested that there are needs to encourage female students for maintaining healthy weight. A higher score of EAT-26 was associated with dissatisfaction of selfbody image and this may lead to unhealthy behaviors in obese female students.
- 1. Austin SB, Ziyadeh HJ, Forman S, Prokop LA, Keliher A, Jacobs D. Screening high school students for eating disorders: Results of a national initiative. Prev Chronic Dis 2008; 5(4): A114.PubMedPMC
- 2. Baek S, Yeo JH. Comparison of weight control and self - esteem between healthy weight and obese children. Korean J Community Nutr 2006; 11(5): 562-574.
- 3. Bresolin L. Body image and health counseling for women. Arch Fam Med 1993; 2: 1084-1087.ArticlePubMed
- 4. Brown TA, Cash TF, Lewis RJ. Body-image disturbance in adolescent female binge-purgers : A brief report of the results of a national survey in the USA. J Child Psychol Psychiatry 1989; 30(4): 605-613.PubMed
- 5. Choi MY, Kim HY. Nutrition knowledge, dietary self-efficacy and eating habits according to student's stage of regular breakfast or exercise. Korean J Community Nutr 2008; 13(5): 653-662.
- 6. Currin L, Schmidt U, Treasure J, Jick H. Time trends in eating disorder incidence. Br J Psychiatry 2005; 186: 132-135.ArticlePubMed
- 7. Dawson DA. Ethnic difference in females overweight data from 1985 national health interview survey. Am J public Health 1988; 78: 1326-1329.ArticlePubMedPMC
- 8. Eom HS, Jeong MJ, Kim SB. A study on nutrition knowledge, dietary attitude, food habit of middle school students in Chonbuk area. Korean J Community Nutr 2005; 10(5): 574-581.
- 9. Garner DM, Garfinkel PE. The eating attitude test: An index of the symptoms of anorexia nervosa. Psychol Med 1979; 9(2): 273-279.ArticlePubMed
- 10. Garner DM, Olmsted MP, Bohr Y, Garfinkle PE. The eating attitude test: Psychometric features and clinical correlates. Psychol Med 1982; 12(4): 871-878.ArticlePubMed
- 11. Goldfield GS, Moore C, Henderson K, Buchholz A, Obeid N, Flament MF. Body dissatisfaction, dietary restraint, depression, and weight status in adolescents. J Sch Health 2010; 80(4): 186-192.ArticlePubMed
- 12. Gross J, Rosen JC, Leitenberg H, Willmuth M. Validity of eating attitudes test and the eating disorder inventory in bulimia nervosa. J Consult Clin Psychol 1986; 54: 875-876.PubMed
- 13. Hwang SH, Wang SH, Shin YO. Body shape satisfaction and adjustment functions in obese adolescent school girls. J Korean Neuropsychiatr Assoc 1998; 37(5): 952-961.
- 14. Hong CE, Hong SW, Jung CZ, Lee DJ, Choi KH. Study on perception of their body image and body dissatisfaction in adolescent in Ulsan. Yeungnam Univ J Med 2008; 25(2): 92-101.Article
- 15. Her ES, Kang HJ, Lee KH. The factor Associated with weight control experience among adolescences. Korean J Community Nutr 2003; 8(5): 658-666.
- 16. Jwa HJ, Chae IS. Body shape satisfaction, nutrition knowledge, dietary habits, and weight control attitude Korean high school students. Korean J Food Cult 2008; 23(6): 820-833.
- 17. Kang HW, Lee SS. Obesity and weight control prevalence of middle school students in Seoul, Gyeonggi area. Korean J Nutr 2006; 39(7): 674-683.
- 18. Korea Center for Diseae Control and Prevention, The Korea Pediatric Society. 2007 Korean National Growth Charts. 2007; Available from www.cdc.go.kr.
- 19. Kim JG. Body image and risk of disturbed eating attitudes of adolescents. J Korean Soc Sch Health 2002; 15(2): 151-155.
- 20. Kim HG, Nam HK. A survey of life style habits of obese school children. J Korean Soc Sch Health 1998; 11(1): 99-100.
- 21. Kim HH, Ro HK. A study on middle school students of Gwangju · Chonnam in terms of dietary life, dietary related self efficacy according to Body Mass Index. Korean J Community Nutr 2009; 14(5): 483-494.
- 22. Kim JE, Min HS. Weight-related perceptions, practice and eating behaviors of middle school students: Associations with BMI. Korean J Community Nutr 2008; 13(1): 13-23.
- 23. Kim JH, Jung IK. A study on body image perception and eating disorders by gender in junior high school students in Seoul. J Korean Home Econ Assoc 2006; 45(1): 101-109.
- 24. Kim JY, Son SJ, Lee JE, Kim JH, Jung IK. The effects of body image satisfaction on obesity stress, weight control attitudes, and eating disorders among female junior high school students. J Korean Home Econ Assoc 2009; 47(4): 49-59.
- 25. Kim SY, Lee HM, Song KH. Body image recognition and dietary behaviors of college students according to the body mass index. Korean J Community Nutr 2007; 12(1): 3-12.
- 26. Kim SY, Won WJ. Factors affecting body image distortion. J Korean Acad Fam Med 1996; 17(6): 408-414.
- 27. Ko SY, Kim KY. Nutrition label use, self-efficacy, snacking and eating behavior of middle school students in Kyunggi area. Korean J Community Nutr 2010; 15(4): 513-524.
- 28. Kwon ER, Choi HJ, Lee SR, Paik ES, Lee KY, Park TJ. Parental perception on childhood obesity according to weight status in children of elementary schools in Busan. J Korean Acad Fam Med 2002; 23(1): 68-79.
- 29. Chung HK, Young LH. The concepts of weight control and dietary behavior in high school seniors. Korean J Nutr 2010; 43(6): 607-619.Article
- 30. Lee HJ, Rhee SG, Won HR. Comparisons of dietary habits and eating disorder by obesity index on one of middle school girls in Incheon. Korean J Community Living Sci 2008; 19(1): 157-169.
- 31. Lee IJ. A study on the interest of the body weighting control, nutrition knowledge and dietary attitude of the middle school students. Chonbuk University; 2000; MA thesis.
- 32. Lee JE, Lee LH. Classification of eating disorder patterns of female middle school students and their association with selfbody image, weight control behavior, and eating behavior. Korean J Community Living Sci 2006; 17(2): 89-103.
- 33. Lee SW, Sung CJ, Kim AJ, Kim MH. A study on nutritional attitude, food behavior and nutritional status according to nutrition knowledge of Korean middle school students. Korean J Community Nutr 2000; 5(3): 419-431.
- 34. Ministry of Health and Welfare. Korea National Health and Nutrition Examination Survey Report. Seoul 2006. 2005.
- 35. Ministry for Health, Welfare and Family Affairs, Korea Centers for Disease Control and Prevention. 2008 National Health Statistics - The 4th Korea National Health and Nutrition Examination Survey, the second year (2008). Korea: Korea Centers for Disease Control and Prevention; 2008.
- 36. Ministry for Health, Welfare and Family Affairs, Korea Centers for Disease Control and Prevention. 2011 National Health Statistics - The 5th Korea National Health and Nutrition Examination Survey, the second year (2011). Korea: Korea Centers for Disease Control and Prevention; 2011.
- 37. Park KA. Dietary habits, body weight satisfaction and eating disorders according to the Body Mass Index of female university students in Kyungnam province. J East Asian Soc Diet Life 2009; 19(6): 891-908.
- 38. Park YD. A study on the weight control attitude and food behavior of boy and girl high school students : the case of coed high school in sokcho and Goseong. Dongguk University; 2002; MA thesis.
- 39. Ponton LE. A view of eating disorders in adolescents. Adolesc Psychiatry 1995; 20: 267-285.PubMed
- 40. Rhee MK, Lee YH, Park SH, Sohn CH, Chung YC, Hong SK, Lee BK, Chang Philip, Yoon AR. A standardization study of the Korean version of Eating Attitudes Test-26 I: Reliability and factor analysis. Korean J Psychosom Med 1998; 6(2): 155-175.
- 41. Rhee SG, Jung EH, Won HR, Kang HY. The study on the weight, food group intake and tendency of eating disorder of adolescents in Osan GyeongGi province. Korean J Community Living Sci 2009; 20(2): 157-168.
- 42. Ryu HK. A survey of adolescents' concern and perception about body image at Miryang city. Korean J Community Nutr 1997; 2(2): 197-205.
- 43. Yang SJ, Kim JM, Yoon JS. Disturbed eating attitudes and behaviors in South Korean boys and girls: A school-based cross sectional study. Yonsei Med J 2010; 51(3): 302-309.ArticlePubMedPMC
- 44. Baek S, Yeo J. Comparison of weight control behaviors and self esteem between healthy weight and obese children. Korean J Community Nutr 2006; 11(5): 562-574.
- 45. Yim KS. Effects of obesity, body image dissatisfaction and dietary habits on the risk of disturbed eating attitudes among high school students in Gyunggi Province Korea. Korean J Community Nutr 2010; 15(5): 656-669.
REFERENCES


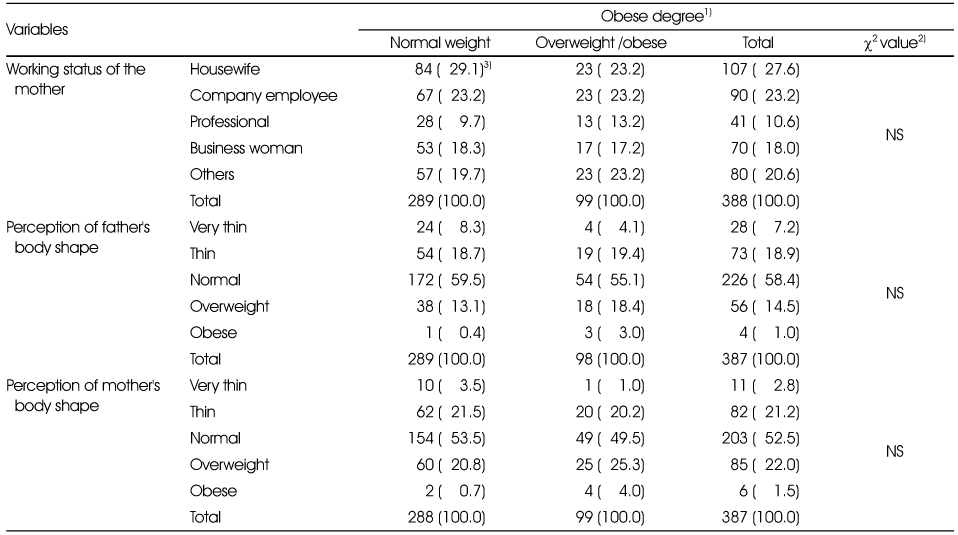


Table 6Perception of self-body shape and difference of body shape by the degree of obesity
1) Normal weight (5th percentile ≤ BMI < 85th percentile), overweight/obese (85th percentile ≤ BMI)
2) Fig. 1. Drawings for assessing body images: number 1 (very thin) → number 9 (very fat)
3) Mean ± SD
4) Self perceived current figure - self perceived ideal figure
**: p < 0.01, ***: p < 0.001 by t-test
†††: p < 0.001 by paired t-test
Table 7Mean score of Eating Attitude Test-26 of subjects by the degree of obesity

1) Normal weight (5th percentile ≤ BMI < 85th percentile), overweight/obese (85th percentile ≤ BMI)
2) Mean ± SD
3) Item of EAT-26: 1, 6, 7, 10, 11, 12, 14, 16, 17, 22, 23, 24, 25
4) Item of EAT-26: 3, 4, 9, 18, 21, 26
5) Item of EAT-26: 2, 5, 8, 13, 15, 19, 20
*: p < 0.05, **: p < 0.01, ***: p < 0.001 by t-test

Table 9Correlation with the degree of obesity, dissatisfaction of self-body shape, EAT-26 Score of subjects

1) Normal weight (5th percentile ≤ BMI < 85th percentile), overweight/obese (85th percentile ≤ BMI)
2) Dissatisfaction of self body shape: (5-point Likert Scale: very satisfied: 1, slightly satisfied: 2, satisfied: 3, slightly unsatisfied: 4, very unsatisfied: 5)
3) EAT-26 Total Score: (Minimum value of EAT-26~Maximum value of EAT-26)
**: p < 0.01, ***: p < 0.001 by Pearson's correlation
Figure & Data
REFERENCES
Citations
Citations to this article as recorded by 
- Consumer characteristics of Body Mass Index groups, and the effect of body satisfaction and self-esteem on the involvement in dieting among females aged 25-49 years
Su-mok Jeong, Eunah Yoh
The Research Journal of the Costume Culture.2020; 28(5): 591. CrossRef - Survey on Foodservice Satisfaction and Dietary Education needs for Improvement of School Foodservice in Middle School Students in Seoul
Kyung-Hee Shin, Youngmee Lee, Wookyoun Cho
Korean Journal of Community Nutrition.2017; 22(2): 127. CrossRef - Characteristics of Groups classified by Degree of Obesity using Body Mass Index - Focused on Self-esteem, Food lifestyle, Social-cultural Attitudes towards Appearance, and Diet-related Attitude and Behavior -
Kwanghee Park
Journal of the Korean Society of Costume.2016; 66(8): 33. CrossRef - Energy Intake according to Expected Body Mass Index of Middle School Students in Seoul
Min-Jeong Ko
Journal of the East Asian Society of Dietary Life.2015; 25(1): 30. CrossRef
 Cite
CiteBody Image, Risk of Disturbed Eating Attitudes and Weight Control of Female Junior High School Students by the Body Mass Index in Seoul

Fig. 1
Drawings for assessing body images.
Fig. 1
Body Image, Risk of Disturbed Eating Attitudes and Weight Control of Female Junior High School Students by the Body Mass Index in Seoul
Eating Attitude Test-26 (EAT-26)
Age distribution of studied subjects by the obese degree of obesity
1) Normal weight (5th percentile ≤ BMI < 85th percentile), overweight/obese (85th percentile ≤ BMI)
2) Statistical analysis by χ2-test
3) N (%)
The working status and perception of body image of subjects' parents by the obese degree
1) Normal weight (5th percentile ≤ BMI < 85th percentile), overweight/obese (85th percentile ≤ BMI)
2) Statistical analysis by χ2-test
3) N (%)
Degree of satisfaction for the self-body shape by the degree of obesity
1) Normal weight (5th percentile ≤ BMI < 85th percentile), overweight/obese (85th percentile ≤ BMI)
2) 5-point Likert Scale: very satisfied: 1, slightly satisfied: 2, satisfied: 3, slightly unsatisfied: 4, very unsatisfied: 5
3) Mean ± SD
4) N (%)
***: p < 0.001 by χ2-test
†††: p < 0.001 by t-test
Perception of current and ideal body shape of subjects by the degree of obesity
1) Normal weight (5th percentile ≤ BMI < 85th percentile), overweight/obese (85th percentile ≤ BMI)
2) N (%)
**: p < 0.01, ***: p < 0.001 by χ2-test
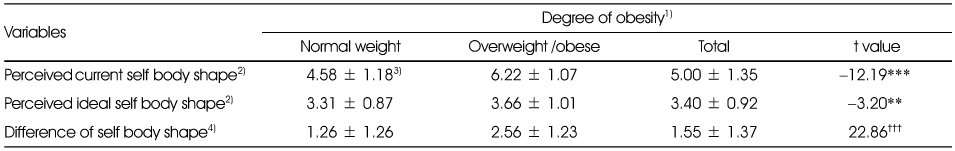
Perception of self-body shape and difference of body shape by the degree of obesity
1) Normal weight (5th percentile ≤ BMI < 85th percentile), overweight/obese (85th percentile ≤ BMI)
2)
3) Mean ± SD
4) Self perceived current figure - self perceived ideal figure
**: p < 0.01, ***: p < 0.001 by t-test
†††: p < 0.001 by paired t-test
Mean score of Eating Attitude Test-26 of subjects by the degree of obesity
1) Normal weight (5th percentile ≤ BMI < 85th percentile), overweight/obese (85th percentile ≤ BMI)
2) Mean ± SD
3) Item of EAT-26: 1, 6, 7, 10, 11, 12, 14, 16, 17, 22, 23, 24, 25
4) Item of EAT-26: 3, 4, 9, 18, 21, 26
5) Item of EAT-26: 2, 5, 8, 13, 15, 19, 20
*: p < 0.05, **: p < 0.01, ***: p < 0.001 by t-test
Reasons and methods of weight control of subjects by the degree of obesity
1) Normal weight (5th percentile ≤ BMI < 85th percentile), overweight/obese (85th percentile ≤ BMI)
2) N (%)
NS: not significant
***: p < 0.001 by χ2-test
Correlation with the degree of obesity, dissatisfaction of self-body shape, EAT-26 Score of subjects
1) Normal weight (5th percentile ≤ BMI < 85th percentile), overweight/obese (85th percentile ≤ BMI)
2) Dissatisfaction of self body shape: (5-point Likert Scale: very satisfied: 1, slightly satisfied: 2, satisfied: 3, slightly unsatisfied: 4, very unsatisfied: 5)
3) EAT-26 Total Score: (Minimum value of EAT-26~Maximum value of EAT-26)
**: p < 0.01, ***: p < 0.001 by Pearson's correlation
Table 1
Eating Attitude Test-26 (EAT-26)
Table 2
Age distribution of studied subjects by the obese degree of obesity
1) Normal weight (5th percentile ≤ BMI < 85th percentile), overweight/obese (85th percentile ≤ BMI) 2) Statistical analysis by χ2-test 3) N (%)
Table 3
The working status and perception of body image of subjects' parents by the obese degree
1) Normal weight (5th percentile ≤ BMI < 85th percentile), overweight/obese (85th percentile ≤ BMI) 2) Statistical analysis by χ2-test 3) N (%)
Table 4
Degree of satisfaction for the self-body shape by the degree of obesity
1) Normal weight (5th percentile ≤ BMI < 85th percentile), overweight/obese (85th percentile ≤ BMI) 2) 5-point Likert Scale: very satisfied: 1, slightly satisfied: 2, satisfied: 3, slightly unsatisfied: 4, very unsatisfied: 5 3) Mean ± SD 4) N (%) ***: p < 0.001 by χ2-test †††: p < 0.001 by t-test
Table 5
Perception of current and ideal body shape of subjects by the degree of obesity
1) Normal weight (5th percentile ≤ BMI < 85th percentile), overweight/obese (85th percentile ≤ BMI) 2) N (%) **: p < 0.01, ***: p < 0.001 by χ2-test
Table 6
Perception of self-body shape and difference of body shape by the degree of obesity
1) Normal weight (5th percentile ≤ BMI < 85th percentile), overweight/obese (85th percentile ≤ BMI) 2) 3) Mean ± SD 4) Self perceived current figure - self perceived ideal figure **: p < 0.01, ***: p < 0.001 by t-test †††: p < 0.001 by paired t-test
Table 7
Mean score of Eating Attitude Test-26 of subjects by the degree of obesity
1) Normal weight (5th percentile ≤ BMI < 85th percentile), overweight/obese (85th percentile ≤ BMI) 2) Mean ± SD 3) Item of EAT-26: 1, 6, 7, 10, 11, 12, 14, 16, 17, 22, 23, 24, 25 4) Item of EAT-26: 3, 4, 9, 18, 21, 26 5) Item of EAT-26: 2, 5, 8, 13, 15, 19, 20 *: p < 0.05, **: p < 0.01, ***: p < 0.001 by t-test
Table 8
Reasons and methods of weight control of subjects by the degree of obesity
1) Normal weight (5th percentile ≤ BMI < 85th percentile), overweight/obese (85th percentile ≤ BMI) 2) N (%) NS: not significant ***: p < 0.001 by χ2-test
Table 9
Correlation with the degree of obesity, dissatisfaction of self-body shape, EAT-26 Score of subjects
1) Normal weight (5th percentile ≤ BMI < 85th percentile), overweight/obese (85th percentile ≤ BMI) 2) Dissatisfaction of self body shape: (5-point Likert Scale: very satisfied: 1, slightly satisfied: 2, satisfied: 3, slightly unsatisfied: 4, very unsatisfied: 5) 3) EAT-26 Total Score: (Minimum value of EAT-26~Maximum value of EAT-26) **: p < 0.01, ***: p < 0.001 by Pearson's correlation


