
Articles
- Page Path
- HOME > Korean J Community Nutr > Volume 19(2); 2014 > Article
-
Research Article
- Associations between Serum 25-hydroxyvitamin D and Consumption Frequencies of Vitamin D Rich Foods in Korean Adults and Older Adults
- Areum Yu, Jihye Kim, Oran Kwon, Se-young Oh, Junghyun Kim, Yoon Jung Yang
-
Korean Journal of Community Nutrition 2014;19(2):122-132.
DOI: https://doi.org/10.5720/kjcn.2014.19.2.122
Published online: April 30, 2014
Department of Clinical Nutrition, Dongduk Women's University, Seoul 136-714, Korea.
1Department of Food and Nutrition, Ewha Womans University, Seoul 120-750, Korea.
2Department of Food and Nutrition, Kyung Hee University, Seoul 130-701, Korea.
3Department of Home Economics Education, Pai Chai University, Daejeon 302-735, Korea.
4Department of Food and Nutrition, Dongduk Women's University, Seoul 136-714, Korea.
- Corresponding author: Yoon Jung Yang. Department of Food and Nutrtion, Dongduk Women's University, 13 Hwarang-ro, Seongbuk-gu, Seoul 136-714, Korea. Tel: (02) 940-4465, Fax: (02) 940-4193, yjyang@dongduk.ac.kr
• Received: November 25, 2013 • Revised: January 13, 2014 • Accepted: March 30, 2014
Copyright © 2014 The Korean Society of Community Nutrition
This is an Open-Access article distributed under the terms of the Creative Commons Attribution Non-Commercial License (http://creativecommons.org/licenses/by-nc/3.0/) which permits unrestricted non-commercial use, distribution, and reproduction in any medium, provided the original work is properly cited.
- 2,633 Views
- 8 Download
- 7 Crossref
Abstract
-
Objectives
- This study was conducted to investigate the vitamin D status and to determine the association between serum 25-hydroxyvitamin D [25(OH)D] concentrations and consumption frequencies of vitamin D rich foods in Korean adults and older adults.
-
Methods
- Subjects were 10,374 adults and 2,792 older adults participating in the 2008-2009 Korea National Health and Nutrition Examination Survey (KNHANES). Consumption frequencies of vitamin D rich foods were estimated by using a qualitative food frequency questionnaire (FFQ). Eleven food items such as beef, egg, mackerel, tuna, yellow corvina, pollack, anchovy, mushroom, milk, yogurt, and ice cream were selected as vitamin D rich foods based on previous research.
-
Results
- The proportions of deficiency (< 12 ng/mL), inadequacy (12-20 ng/mL) and sufficiency (≥ 20 ng/mL) of serum 25(OH)D concentrations from June to November and December to May in adults were 8.8%, 42.3%, 48.8%, and 28.2%, 52.8%, 19.1%, respectively. The proportions of deficiency, inadequacy and sufficiency of serum 25 (OH)D concentrations from June to November and December to May in older adults were 10.1%, 32.4%, 57.5%, and 24.1%, 45.4%, 30.5%, respectively. The mean serum 25(OH)D concentrations in adults were positively related to the consumption frequencies of mackerel, anchovy, all fish, milk and milk·dairy products. The mean serum 25(OH)D concentrations in older adults were positively related to the consumption frequencies of yellow corvina and negatively related to the consumption frequencies of ice cream.
-
Conclusions
- Our results suggest that Korean adults were more deficient in serum 25(OH)D concentrations than older adults. The consumption of vitamin D rich foods may affect vitamin D status in Korean adults. Further studies are required to confirm these findings.
-
The research was supported by a grant (12162KFDA155) from Korea Food & Drug Administration in 2012.
NOTES
- 1. Bertone-Johnson ER, Powers SI, Spangler L, Brunner RL, Michael YL, Larson JC, Millen AE, Bueche MN, Salmoirago-Blotcher E, Liu S, Wassertheil-Smoller S, Ockene JK, Ockene I, Manson JE. Vitamin D intake from foods and supplements and depressive symptoms in a diverse population of older women. Am J Clin Nutr 2011; 94(4): 1104-1112.ArticlePubMedPMC
- 2. Calvo MS, Whiting SJ, Barton CN. Vitamin D fortification in the United States and Canada: current status and data needs. Am J Clin Nutr 2004; 80: 6 Suppl. 1710S-1716S.ArticlePubMed
- 3. Chacko SA, Song Y, Manson JE, Van Horn L, Eaton C, Martin LW, McTiernan A, Curb JD, Wylie-Rosett J, Phillips LS, Plodkowski RA, Liu S. Serum 25-hydroxyvitamin D concentrations in relation to cardiometabolic risk factors and metabolic syndrome in postmenopausal women. Am J Clin Nutr 2011; 94(1): 209-217.ArticlePubMedPMC
- 4. Choi HS, Kim KA, Lim CY, Rhee SY, Hwang YC, Kim KM, Kim KJ, Rhee Y, Lim SK. Low serum vitamin D is associated with high risk of diabetes in Korean adults. J Nutr 2011; 141(8): 1524-1528.ArticlePubMed
- 5. Delmas PD. Treatment of postmenopausal osteoporosis. Lancet 2002; 359(9322): 2018-2026.ArticlePubMed
- 6. Gallagher JC, Riggs BL, Deluca H. Effect of estrogen on calcium absorption and serum vitamin D metabolites in postmenopausal osteoporosis. J Clin Endocrinol Metab 1980; 51(6): 1359-1364.ArticlePubMed
- 7. González-Rodríguez LG, Estaire P, Peñas-Ruiz C, Ortega RM. Vitamin D intake and dietary sources in a representative sample of Spanish adults. J Hum Nutr Diet 2013; 26: Suppl 1. 64-72.ArticlePubMedLink
- 8. Greenfield JA, Park PS, Farahani E, Malik S, Vieth R, McFarlane NA, Shepherd TG, Knight JA. Solar ultraviolet-B radiation and vitamin D: a cross-sectional population-based study using data from the 2007 to 2009 Canadian Health Measures Survey. BMC Public Health 2012; 12: 660.ArticlePubMedPMCPDF
- 9. Gropper SS, Smith JL, Groff JL. Advanced nutrition and human metabolism. 5th ed. Canada: Wadsworth/Cengage Learning; 2009. p. 392-401.
- 10. Hintzpeter B, Mensink GBM, Thierfelder W, Müller MJ, Scheidt-Nave C. Vitamin D status and health correlates among German adults. Eur J Clin Nutr 2008; 62(9): 1079-1089.ArticlePubMedPDF
- 11. Holick MF. Sunlight and vitamin D for bone health and prevention of autoimmune diseases, cancers, and cardiovascular disease. Am J Clin Nutr 2004; 80: 6 Suppl. 1678S-1688S.ArticlePubMed
- 12. Holick MF. Vitamin D: importance in the prevention of cancers, type 1 diabetes, heart disease, and osteoporosis. Am J Clin Nutr 2004; 79(3): 362-371.ArticlePubMed
- 13. Hwang YC, Ahn HY, Jeong IK, Ahn KJ, Chung HY. Optimal serum concentration of 25-hydroxyvitamin D for bone health in older Korean adults. Calcif Tissue Int 2013; 92(1): 68-74.ArticlePubMedPDF
- 14. Ireland P, Fordtran JS. Effect of dietary calcium and age on jejunal calcium absorption in humans studied by intestinal perfusion. J Clin Invest 1973; 52(11): 2672-2681.ArticlePubMedPMC
- 15. Jacques PF, Felson DT, Tucker KL, Mahnken B, Wilson PWF, Rosenberg IH, Rush D. Plasma 25-hydroxyvitamin D and its determinants in an elderly population sample. Am J Clin Nutr 1997; 66(4): 929-936.ArticlePubMed
- 16. Jasinghe VJ, Perera CO. Ultraviolet irradiation: the generator of vitamin D2 in edible mushrooms. Food Chem 2006; 95(4): 638-643.Article
- 17. Kalaras MD, Beelman RB, Elias RJ. Effects of postharvest pulsed UV light treatment of white button mushrooms (Agaricus bisporus) on vitamin D2 content and quality attributes. J Agric Food Chem 2012; 60(1): 220-225.ArticlePubMed
- 18. Kim S, Lim J, Kye S, Joung H. Association between vitamin D status and metabolic syndrome risk among Korean population: based on the Korean National Health and Nutrition Examination Survey IV-2, 2008. Diabetes Res Clin Pract 2012; 96(2): 230-236.ArticlePubMed
- 19. Ko JA, Lee BH, Lee JS, Park HJ. Effect of UV-B exposure on the concentration of vitamin D2 in sliced shiitake mushroom (Lentinus edodes) and white button mushroom (Agaricus bisporus). J Agric Food Chem 2008; 56(10): 3671-3674.ArticlePubMed
- 20. Koyyalamudi SR, Jeong SC, Song CH, Cho KY, Pang G. Vitamin D2 formation and bioavailability from Agaricus bisporus button mushrooms treated with ultraviolet irradiation. J Agric Food Chem 2009; 57(8): 3351-3355.ArticlePubMed
- 21. Kühn T, Kaaks R, Teucher B, Hirche F, Dierkes J, Weikert C, Katzke V, Boeing H, Stangl GI, Buijsse B. Dietary, lifestyle, and genetic determinants of vitamin D status: a cross-sectional analysis from the European Prospective Investigation into Cancer and Nutrition (EPIC)-Germany study. Eur J Nutr 2014; 53(3): 731-741.ArticlePubMedPDF
- 22. Lee MK, Yoon BK, Chung HY, Park HM. The serum vitamin D nutritional status and its relationship with skeletal status in Korean postmenopausal women. Korean J Obstet Gynecol 2011; 54(5): 241-246.Article
- 23. Lee MS, Li HL, Hung TH, Chang HY, Yang FL, Wahlqvist ML. Vitamin D intake and its food sources in Taiwanese. Asia Pac J Clin Nutr 2008; 17(3): 397-407.PubMed
- 24. Lim S, Shin H, Kim MJ, Ahn HY, Kang SM, Yoon JW, Choi SH, Kim KW, Song JH, Choi SI, Chun EJ, Shin CS, Park KS, Jang HC. Vitamin D inadequacy is associated with significant coronary artery stenosis in a community-based elderly cohort: The Korean Longitudinal Study on Health and Aging. J Clin Endocrinol Metab 2012; 97(1): 169-178.ArticlePubMed
- 25. Looker AC, Dawson-Hughes B, Calvo MS, Gunter EW, Sahyoun NR. Serum 25-hydroxyvitamin D status of adolescents and adults in two seasonal subpopulations from NHANES III. Bone 2002; 30(5): 771-777.ArticlePubMed
- 26. Lucas RM, Ponsonby AL, Dear K, Valery PC, Taylor B, van der Mei I, McMichael AJ, Pender MP, Chapman C, Coulthard A, Kilpatrick TJ, Stankovich J, Williams D, Dwyer T. Vitamin D status: multifactorial contribution of environment, genes and other factors in healthy Australian adults across a latitude gradient. J Steroid Biochem Mol Biol 2013; 136: 300-308.ArticlePubMed
- 27. MacLaughlin J, Holick MF. Aging decreses the capacity of human skin to produce vitamin D3. J Clin Invest 1985; 76(4): 1536-1538.ArticlePubMedPMC
- 28. Mattila P, Lampi AM, Ronkainen RR, Toivo J, Piironen V. Sterol and vitamin D2 contents in some wild and cultivated mushrooms. Food Chem 2002; 76(3): 293-298.Article
- 29. Mau JL, Chen PR, Yang JH. Ultraviolet irradiation increased vitamin D2 content in edible mushrooms. J Agric Food Chem 1998; 46(12): 5269-5272.Article
- 30. Nam GE, Kim DH, Cho KH, Park YG, Han KD, Kim SM, Lee SH, Ko BJ, Kim MJ. 25-hydroxyvitamin D insufficiency is associated with cardiometabolic risk in Korean adolescents: the 2008-2009 Korea National Health and Nutrition Examination Survey (KNHANES). Public Health Nutr 2014; 17(1): 186-194.ArticlePubMed
- 31. Nanri A, Foo LH, Nakamura K, Hori A, Poudel-Tandukar K, Matsushita Y, Mizoue T. Serum 25-hydroxyvitamin D concentrations and season-specific correlates in Japanese adults. J Epidemiol 2011; 21(5): 346-353.ArticlePubMedPMC
- 32. O'Neil CE, Keast DR, Fulgoni VL III, Nicklas TA. Food sources of energy and nutrients among adults in the US: NHANES 2003-2006. Nutrients 2012; 4(12): 2097-2120.ArticlePubMedPMC
- 33. Park S, Lee BK. Vitamin D deficiency is an independent risk factor for cardiovascular disease in Koreans aged ≥ 50 years: result from the Korean National Health and Nutrition Examination Survey. Nutr Res Pract 2012; 6(2): 162-168.ArticlePubMedPMC
- 34. Phillips KM, Ruggio DM, Horst RL, Minor B, Simon RR, Feeney MJ, Byrdwell WC, Haytowitz DB. Vitamin D and sterol composition of 10 types of mushrooms from retail suppliers in the United States. J Agric Food Chem 2011; 59(14): 7841-7853.ArticlePubMed
- 35. Rhee SY, Hwang YC, Chung HY, Woo JT. Vitamin D and diabetes in Koreans: analyses based on the Fourth Korea National Health and Nutrition Examination Survey (KNHANES), 2008-2009. Diabet Med 2012; 29(8): 1003-1010.ArticlePubMedPMCLink
- 36. Riggs BL. The mechanisms of estrogen regulation of bone resorption. J Clin Invest 2000; 106(10): 1203-1204.ArticlePubMedPMC
- 37. In: Ross AC, Taylor CL, Yaktine AL, Del Valle HB, editors. Dietary reference intakes for Calcium and vitamin D. Washington D.C: National Academies Press; 2011. p. 486-488.
- 38. Scragg R, Sowers MF, Bell C. Serum 25-hydroxyvitamin D, diabetes, and ethnicity in the Third National Health and Nutrition Examination Survey. Diabetes Care 2004; 27(12): 2813-2818.ArticlePubMedPDF
- 39. Seo JA, Cho H, Eun CR, Yoo HJ, Kim SG, Choi KM, Baik SH, Choi DS, Park MH, Han C, Kim NH. Association between visceral obesity and sarcopenia and vitamin D deficiency in older Koreans: The Ansan Geriatric Study. J Am Geriatr Soc 2012; 60(4): 700-706.ArticlePubMed
- 40. Webb AR. Who, what, where and when-influences on cutaneous vitamin D synthesis. Prog Biophys Mol Biol 2006; 92(1): 17-25.ArticlePubMed
- 41. Yu A, Kim J, Kwon O, Oh SY, Kim J, Yang YJ. The association between serum 25-hydroxyvitamin D concentration and consumption frequencies of vitamin D food sources in Korean adolescents. Clin Nutr Res 2013; 2(2): 107-114.ArticlePubMedPMC
REFERENCES


Table 1Characteristics of the subjects according to the quintiles of serum 25-hydroxyvitamin D concentrations by season in Korean adults aged 19 to 64 years

1) Mean ± SD for each quartile: 12.05 ± 0.07, 16.53 ± 0.04, 20.02 ± 0.03, 24.12 ± 0.05, 31.33 ± 0.16
2) Analysis of variance for continuous variables and and chi-square test for categorical variables
3) Mean ± SD for each quartile: 9.15 ± 0.07, 12.41 ± 0.03, 14.99 ± 0.03, 18.06 ± 0.04, 24.63 ± 0.16
4) Mean ± SD
5) N (%)
Table 2Characteristics of the subjects according to the quintiles of serum 25-hydroxyvitamin D concentrations by season in Korean older adults aged 65 and older years

1) Mean ± SD for each quartile: 11.91 ± 0.23, 17.89 ± 0.09, 22.12 ± 0.08, 26.77 ± 0.09, 33.90 ± 0.27 ng/mL
2) Analysis of variance for continuous variables and chi-square test for categorical variables
3) Mean ± SD for each quartile: 9.28 ± 0.18, 13.50 ± 0.06, 16.73 ± 0.08, 20.58 ± 0.10, 27.70 ± 0.30 ng/mL
4) Mean ± SD
5) N (%)
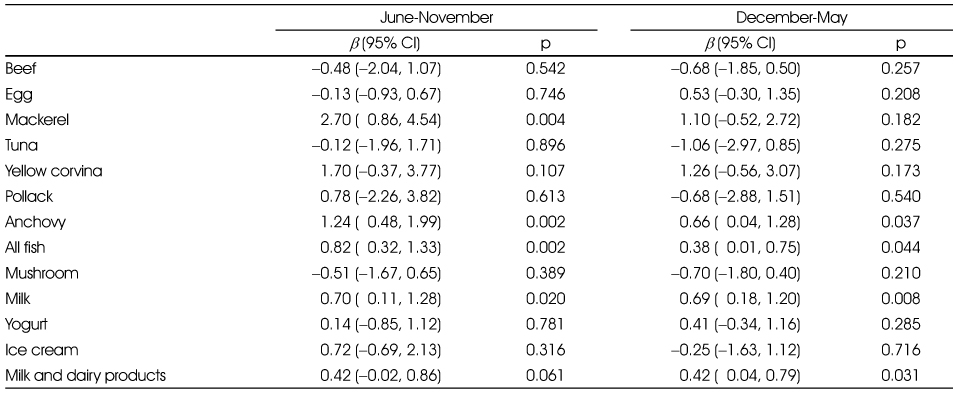

Figure & Data
REFERENCES
Citations
Citations to this article as recorded by 
- Discovering Vitamin-D-Deficiency-Associated Factors in Korean Adults Using KNHANES Data Based on an Integrated Analysis of Machine Learning and Statistical Techniques
Hongryul Ahn, Seungwon Kim, Jinmyung Jung, Chan Park
Nutrients.2025; 17(4): 618. CrossRef - Estimated dietary vitamin D intake and major vitamin D food sources of Koreans: based on the Korea National Health and Nutrition Examination Survey 2016–2019
Ki Nam Kim, Jung-Sug Lee, Jee-Seon Shim, Mi Ock Yoon, Hyun Sook Lee
Nutrition Research and Practice.2023; 17(3): 451. CrossRef - Impacts of serum vitamin D levels on sleep and daytime sleepiness according to working conditions
Hyuk Joo Lee, Hayun Choi, In-Young Yoon
Journal of Clinical Sleep Medicine.2020; 16(7): 1045. CrossRef - Serum 25-hydroxyvitamin D and cognitive function in Korean older adults living in rural area
Ye Som Shin, Bo Youl Choi, Mi Kyung Kim, Yoon Jung Yang
Journal of Nutrition and Health.2019; 52(5): 465. CrossRef - Vitamin D intake, serum 25OHD, and bone mineral density of Korean adults: Based on the Korea National Health and Nutrition Examination Survey (KNHANES, 2011)
Mi-Yeon Kim, Mi-Ja Kim, Sun Yung Ly
Journal of Nutrition and Health.2016; 49(6): 437. CrossRef - Relationship of vitamin D status and obesity index in Korean women
Ji-Young Park, Young-Ran Heo
Journal of Nutrition and Health.2016; 49(1): 28. CrossRef - The relationship between Physical Growth and Major Sources of Serum Vitamin D among Hospitalized Children of Changwon City
Haeyoung Kang, Eunsil Her, Kyung-Hea Lee
Korean Journal of Community Nutrition.2015; 20(3): 197. CrossRef
 Cite
CiteAssociations between Serum 25-hydroxyvitamin D and Consumption Frequencies of Vitamin D Rich Foods in Korean Adults and Older Adults
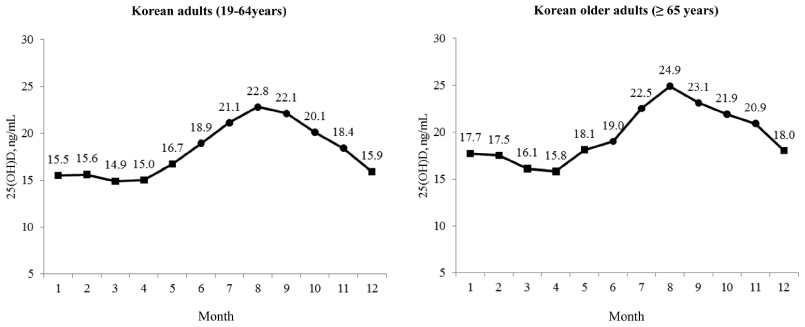
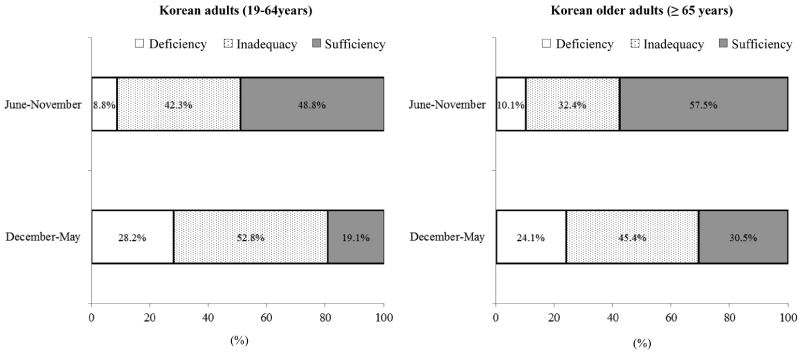
Fig. 1
Means of serum 25-hydroxyvitamin D concentrations by month.
Fig. 2
Serum 25-hydroxyvitamin D status by season.
Fig. 1
Fig. 2
Associations between Serum 25-hydroxyvitamin D and Consumption Frequencies of Vitamin D Rich Foods in Korean Adults and Older Adults
Characteristics of the subjects according to the quintiles of serum 25-hydroxyvitamin D concentrations by season in Korean adults aged 19 to 64 years
1) Mean ± SD for each quartile: 12.05 ± 0.07, 16.53 ± 0.04, 20.02 ± 0.03, 24.12 ± 0.05, 31.33 ± 0.16
2) Analysis of variance for continuous variables and and chi-square test for categorical variables
3) Mean ± SD for each quartile: 9.15 ± 0.07, 12.41 ± 0.03, 14.99 ± 0.03, 18.06 ± 0.04, 24.63 ± 0.16
4) Mean ± SD
5) N (%)
Characteristics of the subjects according to the quintiles of serum 25-hydroxyvitamin D concentrations by season in Korean older adults aged 65 and older years
1) Mean ± SD for each quartile: 11.91 ± 0.23, 17.89 ± 0.09, 22.12 ± 0.08, 26.77 ± 0.09, 33.90 ± 0.27 ng/mL
2) Analysis of variance for continuous variables and chi-square test for categorical variables
3) Mean ± SD for each quartile: 9.28 ± 0.18, 13.50 ± 0.06, 16.73 ± 0.08, 20.58 ± 0.10, 27.70 ± 0.30 ng/mL
4) Mean ± SD
5) N (%)
Regression coefficient (95% CI) for association between serum 25-hydroxyvitamin D concentrations and daily consumption frequencies of vitamin D rich foods by season in Korean adults aged 19 to 64 years
Adjusted for age, sex, sunlight exposure time, supplement use
Regression coefficient (95% CI) for association between serum 25-hydroxyvitamin D concentrations and daily consumption frequencies of vitamin D rich foods by season in Korean older adults aged 65 and older years
Adjusted for age, sex, sunlight exposure time, supplement use
Table 1
Characteristics of the subjects according to the quintiles of serum 25-hydroxyvitamin D concentrations by season in Korean adults aged 19 to 64 years
1) Mean ± SD for each quartile: 12.05 ± 0.07, 16.53 ± 0.04, 20.02 ± 0.03, 24.12 ± 0.05, 31.33 ± 0.16 2) Analysis of variance for continuous variables and and chi-square test for categorical variables 3) Mean ± SD for each quartile: 9.15 ± 0.07, 12.41 ± 0.03, 14.99 ± 0.03, 18.06 ± 0.04, 24.63 ± 0.16 4) Mean ± SD 5) N (%)
Table 2
Characteristics of the subjects according to the quintiles of serum 25-hydroxyvitamin D concentrations by season in Korean older adults aged 65 and older years
1) Mean ± SD for each quartile: 11.91 ± 0.23, 17.89 ± 0.09, 22.12 ± 0.08, 26.77 ± 0.09, 33.90 ± 0.27 ng/mL 2) Analysis of variance for continuous variables and chi-square test for categorical variables 3) Mean ± SD for each quartile: 9.28 ± 0.18, 13.50 ± 0.06, 16.73 ± 0.08, 20.58 ± 0.10, 27.70 ± 0.30 ng/mL 4) Mean ± SD 5) N (%)
Table 3
Regression coefficient (95% CI) for association between serum 25-hydroxyvitamin D concentrations and daily consumption frequencies of vitamin D rich foods by season in Korean adults aged 19 to 64 years
Adjusted for age, sex, sunlight exposure time, supplement use
Table 4
Regression coefficient (95% CI) for association between serum 25-hydroxyvitamin D concentrations and daily consumption frequencies of vitamin D rich foods by season in Korean older adults aged 65 and older years
Adjusted for age, sex, sunlight exposure time, supplement use


