
Articles
- Page Path
- HOME > Korean J Community Nutr > Volume 16(1); 2011 > Article
-
Original Article
- Relationship between Nutrients Intakes, Dietary Quality, and Serum Concentrations of Inflammatory Markers in Metabolic Syndrome Patients
- Misung Kim1), Juyoung Kim, Wookyung Bae, Sohye Kim, Yesong Lee1), Woori Na1), Cheongmin Sohn†,1)†
-
Korean Journal of Community Nutrition 2011;16(1):51-61.
DOI: https://doi.org/10.5720/KJCN.2011.16.1.51
Published online: January 18, 2011
Health Promotion Center, Seoul National Universitiy of Bundang Hospital, Seongnam, Korea
1)Major in Food and Nutrition, Wonkwang University, Iksan, Korea
Health Promotion Center, Seoul National Universitiy of Bundang Hospital, Seongnam, Korea
1)Major in Food and Nutrition, Wonkwang University, Iksan, Korea
- †Corresponding author: Cheongmin Sohn, Major in Food and Nutriton, Wonkwang University, 344-2 Sinyong-Dong, Iksan, Jeonbuk 570-749, Korea Tel: (063) 850-6656, Fax: (063) 850-7301 E-mail: ccha@wku.ac.kr
Copyright © 2011 Korean Ophthalmological Society
This is an Open Access article distributed under the terms of the Creative Commons Attribution Non-Commercial License (http://creativecommons.org/licenses/by-nc/3.0/) which permits unrestricted non-commercial use, distribution, and reproduction in any medium, provided the original work is properly cited.
- 2,097 Views
- 4 Download
- 19 Crossref
Abstract
- Elevated serum concentration of inflammation markers is known as an independent risk factor of metabolic syndrome (MS) and dietary intake is an important factor to control MS. The purpose of this study was to investigated the hypothesis that inflammatory indices are associated with dietary intake and diet quality index-international (DQI-I) in subjects with MS. A cross-sectional study was conducted on 156 men and 73 postmenopausal women with MS, defined by three or more risk factors of the modified Adult Treatment Panel III criteria. Serum levels of high sensitive C-reactive protein (hs-CRP), adiponectin were examined and nutrients intake and DQI-I were assessed using a semiquantitative food frequency questionnaire. The total DQI-I score was significantly higher in female subjects (65.87 ± 9.86) than in male subjects (62.60 ± 8.95). There was a positive association between hs-CRP and polyunsaturated fatty acid intake (p < 0.05) and a negative association between adiponectin and lipid (p < 0.05), total sugar (p < 0.01), and total fatty acids (p < 0.05). When the subjects were divided into 5 groups by quintile according to serum adiponectin and hs-CRP level, there was no association between DQI-I score and hs-CRP levels. Moderation score of DQI-I was significantly higher in highest quintile group than the lower quintile groups. Therefore, our results provide some evidence that dietary intake and diet quality are associated with inflammation markers and dietary modification might be a predictor to decrease risk for metabolic syndrome complications. However further research is needed to develop the dietary quality index reflecting the inflammatory change by considering the dietary habit and pattern of Koreans. (Korean J Community Nutr 16(1) : 51~61, 2011)
Fig. 1.Comparison of nutrient intakes of the two groups with KDRIs1)(%) DRI for reference : Energy EER2), Protein EAR3), Fiber AI4), Calcium EAR, Phosphorus EAR, Iron EAR, Sodium AI, Zinc EAR, Vitamin A EAR, Vitamin B1 EAR, Vitamin B2 EAR, Vitamin B6 EAR, Niacin EAR, Vitamin C EAR, Folate EAR, Vitamin E AI 1) KDRIs : Dietary Reference Intakes for Koreans 2) EER : Estimated energy requirement 3) EAR : Estimated average requirement 4) RNI : Recommended nutrient intake Significantly different between men and women groups by student's t test at ∗: P < 0.05, ∗∗: P < 0.01 and ∗∗∗: P < 0.001
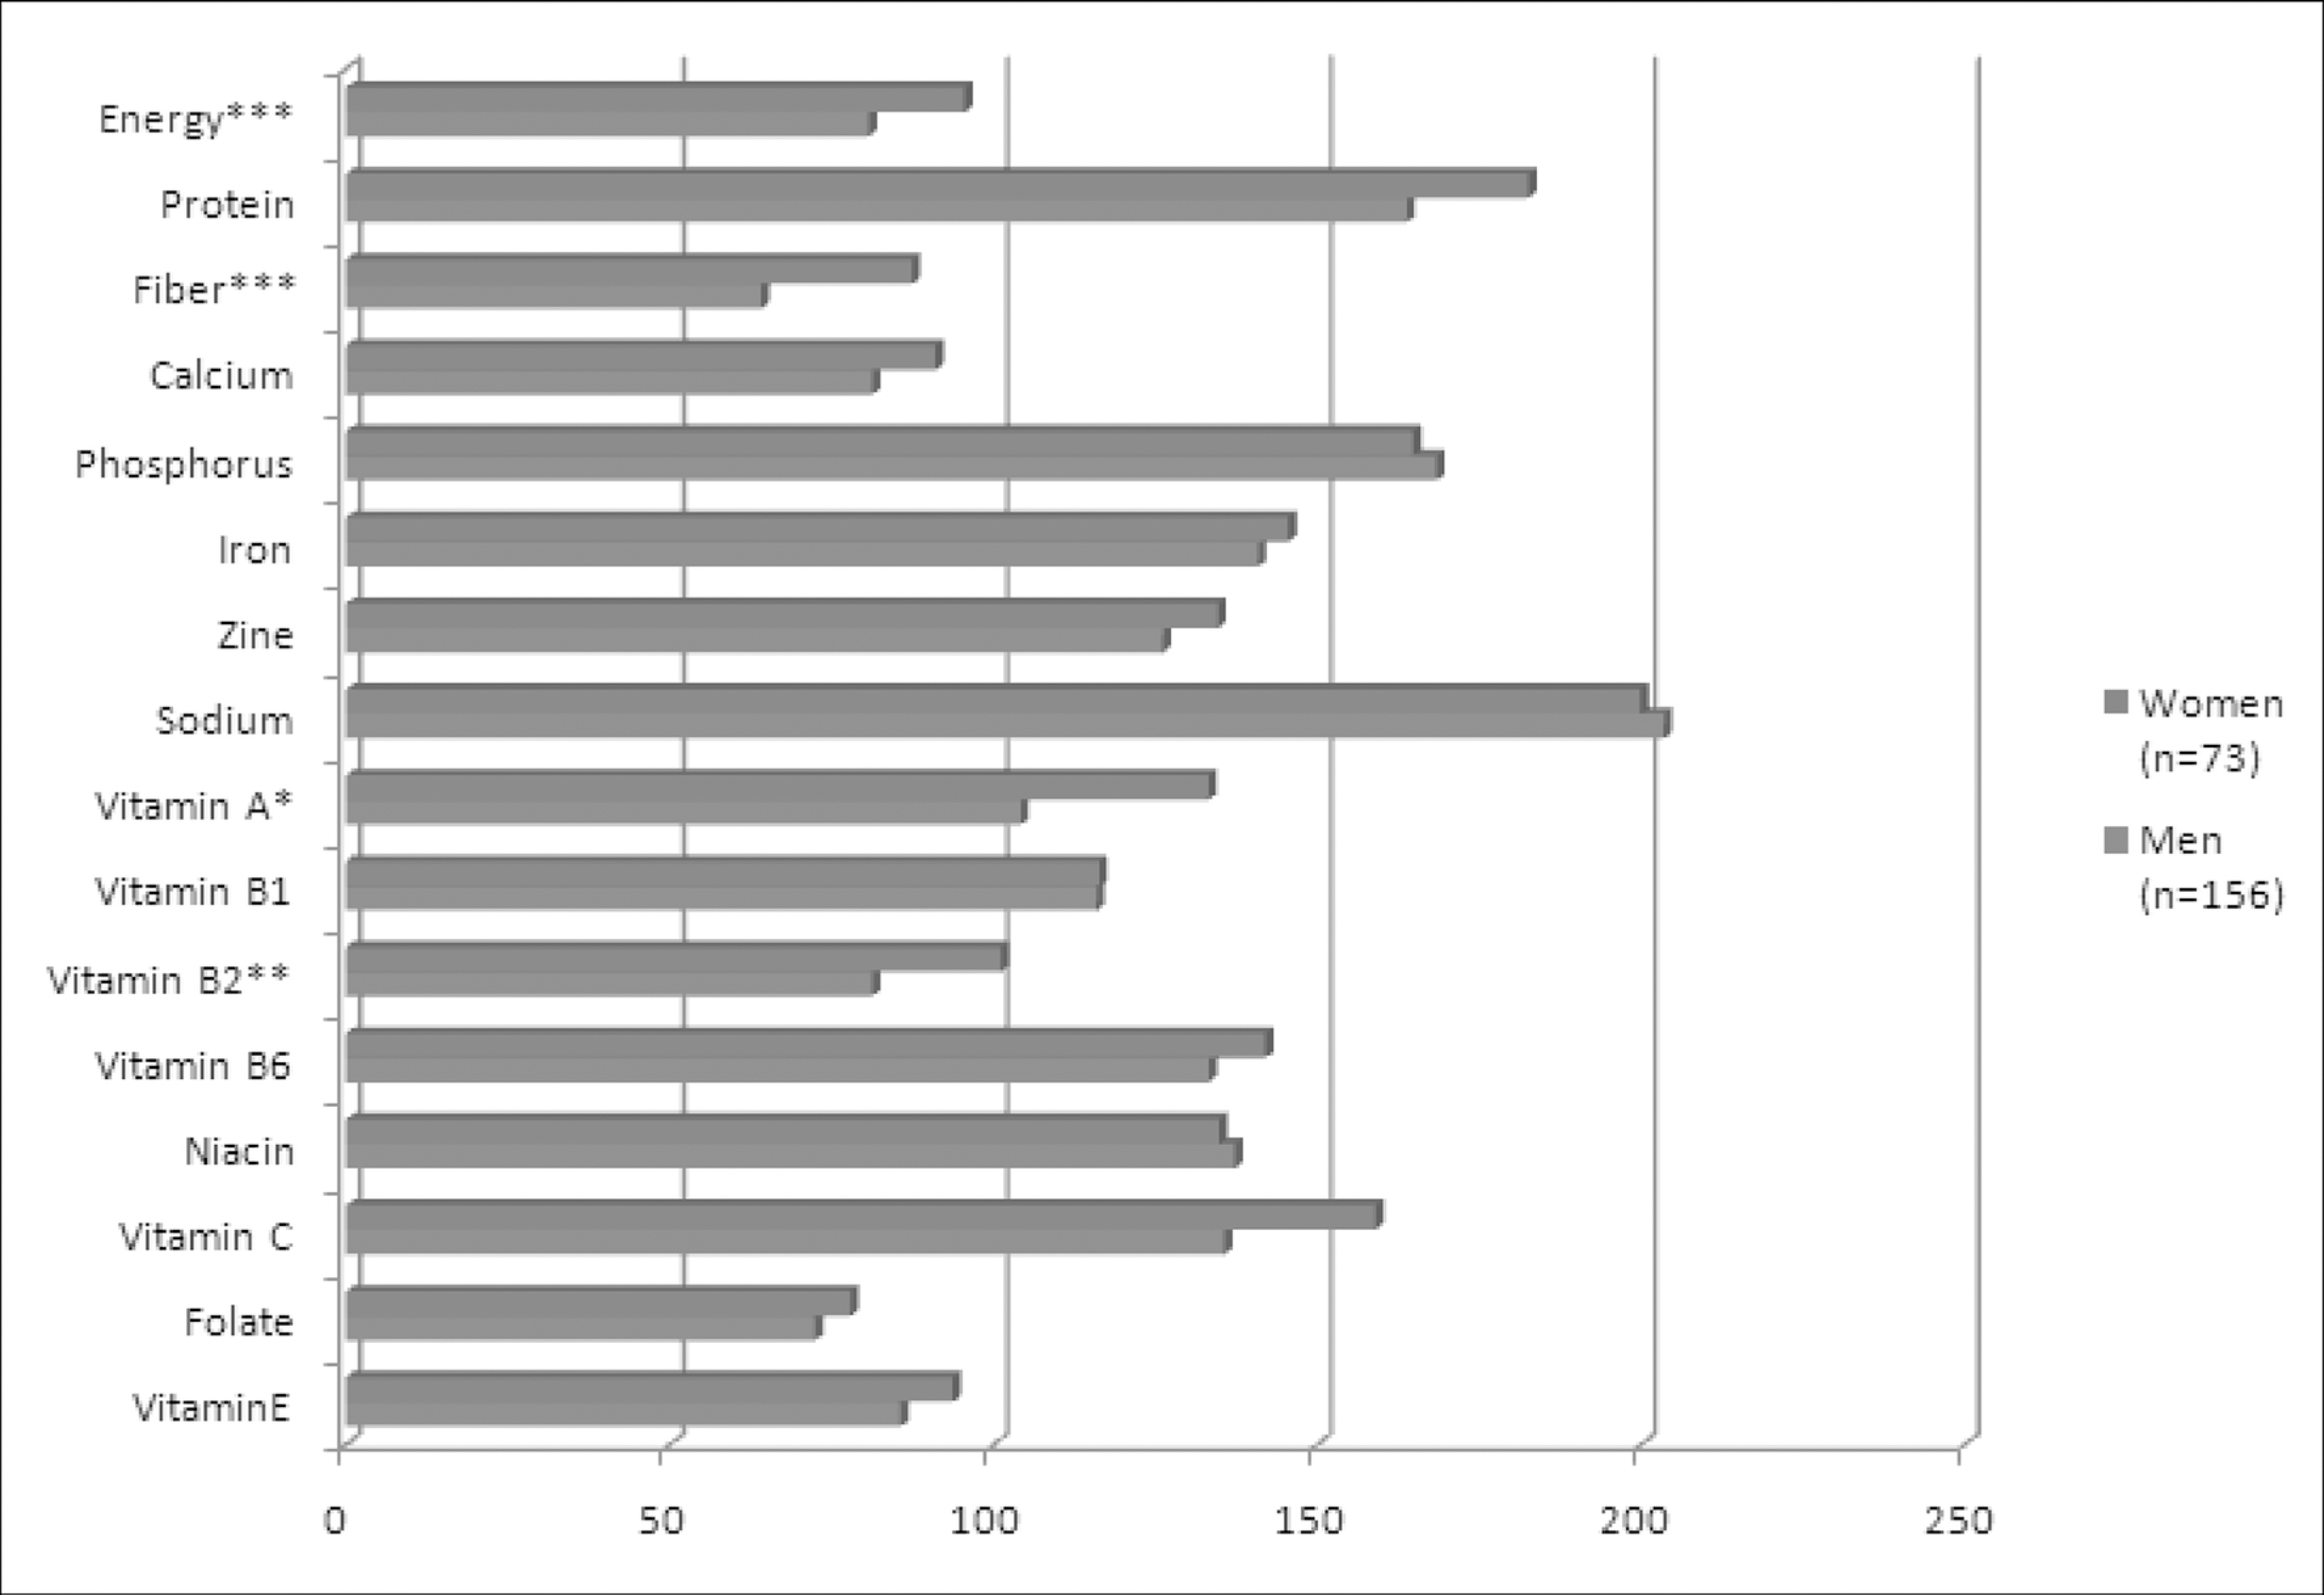
Table 1.Comparison of anthropometric measurements, blood pressure and biochemical indices in men and women groups
1) Values are Mean ± SD, 2) BMI: Body Mass Index, 3) WC: Waist Circumference, 4) SBP: Systolic Blood Pressure, 5) DBP: Diastolic Blood Pressure, 6) GGT: Gamma Glutamyl Transferase, 7) HDL-C: high-density lipoprotein cholesterol, 8) LDL-C: low-density lipoprotein cholesterol, 9) hs-CRP: High-sensitivity C-reactive protein, Significantly different between men and women groups by student's t test at ∗: P < 0.05, ∗∗: P < 0.01 and ∗∗∗: P < 0.001
Table 2.Correlation of inflammatory markers and metabolic syndrome factors
| Factors | log hs-CRP | log Adiponectin |
|---|---|---|
| WC | −0.184∗∗ | −0.165∗ |
| Glucose | −0.056 | −0.147∗ |
| Triglyceride | −0.078 | −0.193∗∗ |
| HDL-C | −0.028 | −0.222∗∗ |
| SBP | −0.037 | −0.110 |
| DBP | −0.091 | −0.020 |
Table 3.Comparison of daily nutrients intake in men and women groups
Table 4.Correlation of inflammatory markers and nutrients Intake
Table 5.Comparison of Diet Quality index-international(DQI-I) in men and women groups
Table 6.Comparison of DQI-I in the subjects according to serum hs-CRP and Adiponectin level
- Ahn Y, Lee JE, Cho NH, Shin C, Park C, Oh BS, Kimm K. 2004; Validation and calibration of semi-quantitative food frequency questionnaire. Korean J Community Nutr 9(2): 173-182.
- Arita Y, Kihara S, Ouchi N, Takahashi M, Maeda K, Miyagawa J, Hotta K, Shimomura I, Nakamura T, Miyaoka K, Kuriyama H, Nishida M, Yamashita S, Okubo K, Matsubara K, Muraguchi M, Ohmoto Y, Funahashi T, Matsuzawa Y. 1999; Paradoxical decrease of an adipose-specific protein, adiponectin, in obesity. Biochem Biophys Res Commun 257: 79-83.ArticlePubMed
- Bae SJ, Son HY, Pyun DK, Nah SS, Koh JM, Kim GS. 2004; Higher circulating hs-CRP levels are associated with lower bone mineral density in healthy premenopausal and postmenopausal women: evidence for link between systemic inflammation and osteoporosis. Korean J Bone Metab 11: 147-157.
- Choi EY, Park EH, Cheong YS, Rheem I, Park SG, Yoo S. 2006; Association of C-reactive protein with the metabolic risk factors among young and middle-aged Koreans. Metabolism 55: 415-422.ArticlePubMed
- Choi MK, Jun YS, Bae YJ, Sung CJ. 2007; A study on nutrient intakes and blood parameters of adult men and women with metabolic syndrome. J Korean Soc Food Sci Nutr 36(3): 311-317.Article
- Esmaillzadeh A, Kimiagar M, Mehrabi Y, Asadbakht L, Hu FB, Willett WC. 2006; Fruit and vegetable intakes, C-reactive protein, and the metabolic syndrome. Am J Clin Nutr 84(6): 1489-1497.ArticlePubMed
- Esposito K, Nappo F, giugliano F, DiPalo C, Ciotola M, Barbieri M, Paolisso G, Giugliano D. 2003; Meal modulation of circulating interleukin 18 and adiponectin concentrations in healthy subjects and in patients with type 2 diabetes mellitus. Am J Clin Nutr 78(6): 1135-1140.ArticlePubMed
- Esteve E, Ricart W, Fernández-Real JM. 2009; Adipocytokines and insulin resistance: the possible role of lipocalin-2, retinol binding protein-4, and adiponectin. Diabetes Care 32(Suppl 2): S362-367.
- Feingold KR, Grunfeld C. 1992; Role of cytokines in inducing hyperlipidemia. Diabetes 41(2): 97-101.ArticlePubMedPDF
- Fredrikson GN, Hedblad B, Nilsson JA, Alm R, Berglund G, Nilsson J. 2004; Association between diet, lifestyle, metabolic cardiovascular risk factors, and plasma C-reactive protein levels. Metabolism 53(11): 1436-1442.ArticlePubMed
- Fung TT, McCullough ML, Newby PK, Manson JE, Meigs JB, Rifai N, Willett WC, Hu FB. 2005; Diet-quality scores and plasma concentrations of markers of inflammation and endothelial dysfunction. Am J Clin Nutr 82(1): 163-173.ArticlePubMed
- Gabay C, Kushner I. 1999; Acute-phase proteins and other systemic responses to inflammation. N Engl J Med 340: 448-454.ArticlePubMed
- Ghayour-Mobarhan M, Yaghootkar H, Lanham-New SA, Lamb DJ, Ferns GA. 2007; Association between serum CRP concentrations with dietary intake in healthy and dyslipidaemic patients. Asia Pac J Clin Nutr 16(2): 262-268.PubMed
- Giugliano D, Ceriello A, Esposito K. 2006; The effects of diet on inflammation: Emphasis on the metabolic syndrome. J Am Coll Cardiol 48(4): 677-685.PubMed
- International Obesity Task Force (1999): Asia-Pacific regional obesity guideline. International Association for the Study of Obesity. Sydney Isomaa B, Almgren P, Tuomi T, Forsen B, Lahti K, Lissen M, Taskinen MR, Groop L. 2001; Cardiovascular morbidity and mortality associated with the metabolic syndrome. Diabetes Care 24(4): 683-689.ArticlePubMedPDF
- Jang M. 2010; . Repeated nutrition education has positive effect on health improvement at workplace. MS thesis, Kyunghee University Kasim-Karakas SE, Tsodikov A, Singh U, Jialal I (2006): Responses of inflammatory markers to a low-fat, high-carbohydrate diet; effects of energy intake. Am J Clin Nutr 83(4): 774-779.
- Kim BJ, Kim WG, Jung CH, Byun SW, Koh JM, Kim GS. 2006; Relationship between bone turnover rate and a systemic inflammatory marker in Korean women. Korean J Bone Metab 13: 129-138.
- Kim S, Haines PS, Siega-Riz AM, Popkin BM. 2003; The diet quality index-international (DQI-I) provides an effective tool for cross-national comparison of diet quality as illustrated by China and the United States. J Nutr 133(11): 3476-3484.ArticlePubMed
- Koenig W, Sund M, Frohlich M, Fischer HG, Lowel H, Doring A, Hutchinson WL, Pepys MB. 1999; C-Reactive protein, a sensitive marker of inflammation, predicts future risk of coronary heart disease in initially healthy middle-aged men: results from the MONICA (Monitoring Trends and Determinants in Cardiovascular Disease) Augsburg Cohort Study, 1984 to 1992. Circulation 99: 237-242.ArticlePubMed
- Krakoff J, Funahashi T, Stehouwer CD, Schalkwijk CG, Tanaka S, Matsuzawa Y, Kobes S, Tataranni PA, Hanson RL, Knowler WE, Lindsay RS. 2003; Inflammatory markers, adiponectin, and risk of type 2 diabetes in the Pima Indian. Diabetes Care 26(6): 1745-1751.ArticlePubMedPDF
- Kumada M, Kihara S, Sumitsuji S, Kawamoto T, Matsumoto S, Ouchi N, Arita Y, Okamoto Y, Shimomura I, HIraoka H, Nakamura T, Funahashi T, Matsuzawa Y. for the Osaka CAD study group. 2003; Association of hypoadiponectinemia with coronary artery disease in men. Arterioscler Thromb Vasc Biol 23: 85-89.ArticlePubMed
- Lakka HM, Laaksonen DE, Lakka TA, Niskanen LK, Kumpusalo E, Tuomilehto J, Salonen JT. 2002; The metabolic syndrome and total and cardiovascular disease mortality in middle-aged men. JAMA 288: 2709-2716.ArticlePubMed
- Lara-Castro C, Fu Y, Chung BH, Garvey WT. 2007; Adiponectin and the metabolic syndrome: mechanisms mediating risk for metabolic and cardiovascular disease. Curr Opin Lipidol 18(3): 263-267.ArticlePubMed
- Lee MY, Kim JH. 2010; Association of serum lipids and dietary intakes with serum adiponectin level in overweight and obese Korean women. Korean J Community Nutr 15(1): 27-35.
- Mckeown NM, Liu E, Meigs JB, Rogers G, D'Agostino R, Jacques P. 2009; Carbohydrate-related dietary factors and plasma adiponectin levels in healthy adults in the Framingham Offspring Cohort. FASEB J 23 (Meeting abstract supplement) 229.5.
- Ministry of Health and Welfare (MOHW). 2005; Korea national health and nutrition examination survey report (KNHANES III).
- Mohamed-Ali V, Goodrick S, Rawesh A, Katz DR, Miles JM, Yudkin JS. 1997; Subcutaneous adipose tissue releases interleukin-6, but not tumor necrosis factor-a, in vivo. J Clin Endocrinol Metab 82(12): 4196-4200.PubMed
- Mottillo S, Filion KB, Genest J, Joseph L, Pilote L, Poirier P, Rinfret S, Schiffrin EL, Eisenberg MJ. 2010; The metabolic syndrome and cardiovascular risk a systematic review and meta-analysis. J Am Coll Cardiol 56(14): 1113-1132.PubMed
- National Cholesterol Education Program(NCEP) Expert Panel on Detection, Evaluation, and Treatment of High Blood Cholesterol in Adults. 2002; Third report of the National Cholesterol Education Program (NCEP) Expert Panel on Detection, Evaluation, and Treatment of High Blood Cholesterol in Adults (Adult Treatment Panel III) final report. Circulation 106: 3143-3421.ArticlePubMed
- Palmieri VO, Grattagliano I, Portincasa P, Palasciano G. 2006; Systemic oxidative alterations are associated with visceral adiposity and liversteatosis in patients with metabolic syndrome. J Nutr 136(12): 3022-3326.ArticlePubMed
- Park JY, Kim JW, Kim JM, Han Y, Park SK, Mok JY, Park MK, Lee HJ, Kim DK. 2008; Adiponectin concentrations in type 2 diabetic patients with or without metabolic syndrome. Korean Diabetes J 32: 224-235.Article
- Ridker PM. 2001; High-sensitivity C-reactive protein; potential adjunct for global risk assessment in the primary prevention of cardiovascular disease. Circulation 103(13): 1813-1818.ArticlePubMed
- Ridker PM. 2003; Clinical application of C-reactive protein for cardiovascular disease detection and prevention. Circulation 107: 363-369.ArticlePubMed
- Ridker PM, Buring JE, Cook NR, Rifai N. 2003; C-reactive protein, the metabolic syndrome and risk of incident cardiovascular events: an 8-year follow-up of 14719 initially healthy American women. Circulation 107(3): 391-397.ArticlePubMed
- Salmeron J, Manson JE, Stampfer MJ, Colditz GA, Wing AL, Willett WC. 1997; Dietary fiber, glycemic load, and risk of non-insulin-dependent diabetes mellitus in women. JAMA 277(6): 472-477.ArticlePubMed
- Seddon JM, Gensler G, Klein ML, Milton RC. 2006; C-reactive protein and homocysteine are associated with dietary and behavioral risk factors for age-related macular degeneration. Nutrition 22(4): 441-443.ArticlePubMed
- Tamakoshi K, Yatsuya H, Kondo T, Hori Y, Ishikawa M, Zhang H, Murata C, Otsuka R, Zhu S, Toyoshima H. 2003; The metabolic syndrome is associated with elevated circulating C-reactive protein in healthy reference range, a systemic low-grade inflammatory state. Int J Obes Relat Metab Disord 27(4): 443-449.ArticlePubMedPDF
- The Korean Nutrition Society (2010): Dietary reference intakes for Koreans. Hanareum. Seoul Timar O, Sestier F, Levy E. 2000; Metabolic syndrome X: a review. Can J Cardiol 16(6): 779-789.PubMed
- Tracy RP, Lemaitre RN, Psaty BM, Ives DG, Evans RW, Cushman M, Meilahn EN, Kuller LH. 1997; Relationship of C-reactive protein to risk of cardiovascular disease in the elderly. Results from the cardiovascular health study and the rural health promotion project. Arterioscler Thromb Vasc Biol 17: 1121-1127.PubMed
- Tur JA, Romaguera D, Pons A. 2005; The diet quality index-internaitonal (DQI-I): is it a useful tool to evaluate the quality of the mediterranean diet? Br J Nutr 93(3): 369-376.ArticlePubMed
- Yun HK, Kim H, Chang N. 2009; Diet quality index-international score is correlated with weight loss in female college students on a weight management program. Korean J Nutr 42(5): 453-463.Article
REFERENCES
Figure & Data
REFERENCES
Citations
Citations to this article as recorded by 
- The relationship between diet quality index (DQI) with inflammatory indices and body mass index (BMI) in inflammatory bowel disease (IBD) patients
Parisa Karimi, Elmira Ramezani, Naser Ebrahimi Daryani, Ariyo Movahedi
Scientific Reports.2025;[Epub] CrossRef - Exploring metabolic syndrome and dietary quality in Iranian adults: a cross-sectional study
Zahra Namkhah, Kiyavash Irankhah, Sina Sarviha, Seyyed Reza Sobhani
BMC Nutrition.2024;[Epub] CrossRef - Association of Diet Quality and Food Insecurity with Metabolic Syndrome in Obese Adults
Ahmed Abdurahman, Mohammed Bule, Masoume Fallahyekt, Maryem Abshirini, Leila Azadbakht, Mostafa Qorbani, A. R. Dorosty
International Journal of Preventive Medicine.2021;[Epub] CrossRef - A Comparisons of Nutritional Intake and Diet Quality Index-International in Gynecological Cancer Survivors and Normal Women: Using the Korea National Health and Nutrition Examination Survey 2013~2016
Bo-Young Seo, Eun-Sil Her
Korean Journal of Community Nutrition.2020; 25(5): 406. CrossRef - Relation between the Total Diet Quality based on Korean Healthy Eating Index and the Incidence of Metabolic Syndrome Constituents and Metabolic Syndrome among a Prospective Cohort of Korean Adults
Saerom Shin, Seungmin Lee
Korean Journal of Community Nutrition.2020; 25(1): 61. CrossRef - Development of a food-based index of dietary inflammatory potential for Koreans and its relationship with metabolic syndrome
Woori Na, Tae Yang Yu, Cheongmin Sohn
Nutrition Research and Practice.2019; 13(2): 150. CrossRef - Association between Total Diet Quality and Metabolic Syndrome Incidence Risk in a Prospective Cohort of Korean Adults
Saerom Shin, Seungmin Lee
Clinical Nutrition Research.2019; 8(1): 46. CrossRef - Effects of food items and related nutrients on metabolic syndrome using Bayesian multilevel modelling using the Tehran Lipid and Glucose Study (TLGS): a cohort study
Zahra Cheraghi, Saharnaz Nedjat, Parvin Mirmiran, Nazanin Moslehi, Nasrin Mansournia, Mahyar Etminan, Mohammad Ali Mansournia, Lawrence C McCandless
BMJ Open.2018; 8(12): e020642. CrossRef - Development and Validation of Korean Inflammtory Index(K-DII) for Metabolic Disease Patients: by Using the Health Examinee Cohort (2012-2014)
Woori Na, Misung Kim, Susan Park, Minhyung Lee, Cheongmin Sohn
Korean Journal of Human Ecology.2017; 26(4): 369. CrossRef - Amelioration of metabolic disturbances and adipokine dysregulation by mugwort (Artemisia princeps P.) extract in high-fat diet-induced obese rats
Yun-Hye Kim, Chung-Mu Park, Gun-Ae Yoon
Journal of Nutrition and Health.2016; 49(6): 411. CrossRef - Development of dietary pattern evaluation tool for adults and correlation with Dietary Quality Index
Yeo Do Lee, Kyung Won Kim, Kyung-Suk Choi, Misung Kim, Yeo Jin Cho, Cheongmin Sohn
Nutrition Research and Practice.2016; 10(3): 305. CrossRef - Analysis of Dietary Inflammatory Index of Metabolic Syndrome in Korean : Data from the Health Examinee Cohort (2012-2014)
Mi-Sung Kim, Cheong-Min Sohn
Korean Journal of Human Ecology.2016; 25(6): 823. CrossRef - A study on dietary habits, nutrient intakes and dietary quality in adults of a health screening and promotion center according to non-alcoholic fatty liver disease
Ji Ho Chang, Hye Seung Lee, Eun Hee Kang
Journal of Nutrition and Health.2014; 47(5): 330. CrossRef - Correlation between vitamin D and cardiovascular disease predictors in overweight and obese Koreans
Misung Kim, Woori Na, Cheongmin Sohn
Journal of Clinical Biochemistry and Nutrition.2013; : 167. CrossRef - Comparison of health outcomes according to intervention compliance in male Korean workers with metabolic syndrome
Kyung-Hui Nam, Ji-Yeon Kang, Yeon-Ju Lee, Sook-Hee Sung, Youn-Koun Chang, Ji-Young Lee, Ill-Keun Park, Tae-In Choi
Korean Journal of Nutrition.2013; 46(2): 156. CrossRef - Effect of the Telephone-Delivered Nutrition Education on Dietary Intake and Biochemical Parameters in Subjects with Metabolic Syndrome
Juyoung Kim, Wookyung Bea, Kiheon Lee, Jongsoo Han, Sohye Kim, Misung Kim, Woori Na, Cheongmin Sohn
Clinical Nutrition Research.2013; 2(2): 115. CrossRef - Evaluation of nutrient intake and diet quality of gastric cancer patients in Korea
Heesook Lim, Gyuseok Cho, Soonkyung Kim
Nutrition Research and Practice.2012; 6(3): 213. CrossRef - The framingham risk score, diet, and inflammatory markers in Korean men with metabolic syndrome
Cheongmin Sohn, Juyong Kim, Wookyung Bae
Nutrition Research and Practice.2012; 6(3): 246. CrossRef - The Effects of 12-Weeks Intensive Intervention Program on Cardiovascular Risk Factors, Adipocytokines and Nutrients Intakes in Industrial Male Workers
Kieun Moon, Ill Keun Park, Yeon Sang Jo, Yun Kyun Chang, Yun Mi Paek, Tae In Choi
The Korean Journal of Nutrition.2011; 44(4): 292. CrossRef
 Cite
CiteRelationship between Nutrients Intakes, Dietary Quality, and Serum Concentrations of Inflammatory Markers in Metabolic Syndrome Patients

Fig. 1. Comparison of nutrient intakes of the two groups with KDRIs1)(%) DRI for reference : Energy EER2), Protein EAR3), Fiber AI4), Calcium EAR, Phosphorus EAR, Iron EAR, Sodium AI, Zinc EAR, Vitamin A EAR, Vitamin B1 EAR, Vitamin B2 EAR, Vitamin B6 EAR, Niacin EAR, Vitamin C EAR, Folate EAR, Vitamin E AI 1) KDRIs : Dietary Reference Intakes for Koreans 2) EER : Estimated energy requirement 3) EAR : Estimated average requirement 4) RNI : Recommended nutrient intake Significantly different between men and women groups by student's t test at ∗: P < 0.05, ∗∗: P < 0.01 and ∗∗∗: P < 0.001
Fig. 1.
Relationship between Nutrients Intakes, Dietary Quality, and Serum Concentrations of Inflammatory Markers in Metabolic Syndrome Patients
Comparison of anthropometric measurements, blood pressure and biochemical indices in men and women groups
| Men (n = 156) | Women (n = 73) | t-score | |
|---|---|---|---|
| Age (years) | 49.39 ± 10.101) | 48.72 ± 81.02 | 0.542 |
| Height (cm) | 172.86 ± 6.37 | 157.13 ± 5.16 | 18.454∗∗∗ |
| BMI (kg/m2)2) | 26.66 ± 2.85 | 26.00 ± 3.80 | 1.315 |
| Weight (kg) | 79.79 ± 10.85 | 64.17 ± 9.82 | 10.450∗∗∗ |
| WC (cm)3) | 93.48 ± 7.11 | 88.05 ± 7.56 | 5.274∗∗∗ |
| SBP (mmHg)4) | 128.14 ± 13.94 | 129.75 ± 14.40 | 0.807 |
| DBP (mmHg)5) | 81.03 ± 10.68 | 77.41 ± 9.06 | 2.505∗ |
| GGT (IU/L)6) | 56.60 ± 31.52 | 42.33 ± 43.98 | 2.644∗∗ |
| Glucose (mg/dL) | 106.44 ± 22.33 | 99.16 ± 17.52 | 2.453∗ |
| Cholesterol (mg/dL) | 196.72 ± 36.16 | 212.01 ± 36.14 | 2.983∗∗ |
| Triglyceride (mg/dL) | 175.92 ± 74.40 | 159.71 ± 58.22 | 1.790 |
| HDL-C (mg/dL)7) | 43.64 ± 9.22 | 46.18 ± 9.70 | 1.911 |
| LDL-C (mg/dL)8) | 109.37 ± 29.77 | 121.90 ± 32.23 | 2.888∗∗ |
| hs-CRP (µg/mL)9) | 1.82 ± 2.55 | 1.97 ± 2.78 | 0.406 |
| Adiponectin (µg/mL) | 8.10 ± 2.75 | 12.10 ± 4.79 | 6.663∗∗∗ |
1) Values are Mean ± SD, 2) BMI: Body Mass Index, 3) WC: Waist Circumference, 4) SBP: Systolic Blood Pressure, 5) DBP: Diastolic Blood Pressure, 6) GGT: Gamma Glutamyl Transferase, 7) HDL-C: high-density lipoprotein cholesterol, 8) LDL-C: low-density lipoprotein cholesterol, 9) hs-CRP: High-sensitivity C-reactive protein, Significantly different between men and women groups by student's t test at ∗: P < 0.05, ∗∗: P < 0.01 and ∗∗∗: P < 0.001
Correlation of inflammatory markers and metabolic syndrome factors
| Factors | log hs-CRP | log Adiponectin |
|---|---|---|
| WC | −0.184∗∗ | −0.165∗ |
| Glucose | −0.056 | −0.147∗ |
| Triglyceride | −0.078 | −0.193∗∗ |
| HDL-C | −0.028 | −0.222∗∗ |
| SBP | −0.037 | −0.110 |
| DBP | −0.091 | −0.020 |
Significantly different at ∗: P < 0.05 and ∗∗: P < 0.01 Serum hs-CRP and Adiponectin concentrations were logarithmically transformed because of their right-skewed deviation.
Comparison of daily nutrients intake in men and women groups
| Men (n = 156) | Women (n = 73) | Total (N = 229) | t-score | |
|---|---|---|---|---|
| Energy (kcal)1) | 1859.28 ± 7613.14 | 1721.94 ± 7731.72 | 1815.50 ± 7654.80 | 1.483 |
| Protein (g) | 7769.97 ± 7734.85 | 7763.95 ± 7732.02 | 7768.05 ± 7734.02 | 1.250 |
| Fiber (g) | 7717.73 ± 7779.26 | 7719.44 ± 7710.85 | 7718.28 ± 7779.80 | 1.228 |
| Calcium (mg) | 7471.56 ± 7311.86 | 7528.36 ± 7338.89 | 7489.67 ± 7321.07 | 1.249 |
| Phosphorus (mg) | 7977.00 ± 7451.78 | 7956.00 ± 7457.85 | 7970.31 ± 7452.82 | 0.326 |
| Iron (mg) | 7711.27 ± 7776.33 | 7711.19 ± 7776.28 | 7711.25 ± 7776.30 | 0.088 |
| Sodium (mg) | 2845.75 ± 1827.75 | 2639.56 ± 1699.65 | 2780.02 ± 1786.78 | 0.813 |
| Zinc (mg) | 7779.73 ±777 5.93 | 7778.59 ± 7774.50 | 7779.36 ± 7775.53 | 1.455 |
| Vitamin A (µgRE) | 7533.74 ± 7403.36 | 7579.57 ± 7441.79 | 7548.35 ± 7415.58 | 0.777 |
| Vitamin B1 (mg) | 7771.16 ± 7770.60 | 7771.05 ± 7770.55 | 7771.12 ± 7770.59 | 1.345 |
| Vitamin B2 (mg) | 7771.06 ±777 0.57 | 7771.01 ± 7770.58 | 7771.04 ± 7770.57 | 0.539 |
| Vitamin B6 (mg) | 7771.73 ±777 0.85 | 7771.70 ± 7770.92 | 7771.72 ± 7770.87 | 0.228 |
| Niacin (mg) | 7716.47 ± 7778.32 | 7714.84 ± 7777.56 | 7715.95 ± 7778.11 | 1.418 |
| Vitamin C (mg) | 7101.81 ± 7773.44 | 7119.30 ± 789.40 | 7107.38 ± 779.10 | 1.564 |
| Folate (µg) | 7232.05 ± 7137.35 | 7249.42 ± 7155.88 | 7237.59 ± 7143.40 | 0.853 |
| Vitamin E (mg) | 7778.57 ± 7774.43 | 7779.38 ± 7776.89 | 7778.83 ± 7775.34 | 1.067 |
1) Values are Mean ± SD All values are not significantly different between the two groups by student's t-test
Correlation of inflammatory markers and nutrients Intake
| Factors | log hs-CRP1) | log Adiponectin2) |
|---|---|---|
| Lipid | 0.071 | 0.125∗ |
| Total sugar | 0.025 | 0.167∗∗ |
| Fiber | 0.023 | 0.076 |
| β-carotene | 0.015 | 0.101 |
| Vitamin C | 0.011 | 0.049 |
| Cholesterol | 0.105 | 0.082 |
| Total fatty acid | 0.082 | 0.128∗ |
| Saturated fatty acids | s −0.067 | 0.099 |
| Monounsaturated fa | tty acids −0.073 | 0.116∗ |
| Polyunsaturated fatty | y acids −0.122∗ | 0.194∗∗ |
1) Adjustment for waist circumference
2) Adjustment for waist circumference, glucose, triglyceride, and HDL-cholesterol
Significantly different at ∗: P < 0.05 and ∗∗: P < 0.01
Comparison of Diet Quality index-international(DQI-I) in men and women groups
| Score ranges (points) | Men (n = 156) | Women (n = 73) | t-score | |
|---|---|---|---|---|
| Overall food group variety | 0 − 15 | 10.48 ± 2.221) | 10.89 ± 2.37 | 1.272 |
| Within-group variety for protein source | 0 − 5 | 83.00 ± 1.93 | 82.68 ± 2.05 | 1.127 |
| Variety | 0 − 20 | 13.48 ± 3.26 | 13.58 ± 3.66 | 0.197 |
| Vegetable group | 0 − 5 | 82.68 ± 1.41 | 82.97 ± 1.55 | 1.422 |
| Fruits group | 0 − 5 | 81.90 ± 1.71 | 82.52 ± 1.94 | 2.347∗ |
| Grain group | 0 − 5 | 84.29 ± 1.01 | 84.21 ± 1.04 | 0.618 |
| Fiber | 0 − 5 | 83.28 ± 1.27 | 83.60 ± 1.28 | 1.774 |
| Protein | 0 − 5 | 84.95 ± 0.32 | 84.97 ± 0.23 | 0.574 |
| Iron | 0 − 5 | 83.88 ± 1.16 | 83.85 ± 1.29 | 0.207 |
| Calcium | 0 − 5 | 82.44 ± 1.43 | 82.56 ± 1.38 | 0.625 |
| Vitamin C | 0 − 5 | 83.37 ± 1.50 | 83.68 ± 1.38 | 1.506 |
| Adequacy | 0 − 40 | 26.79 ± 5.94 | 28.37 ± 6.14 | 1.850 |
| Total fat | 0 − 6 | 85.02 ± 1.64 | 85.10 ± 1.63 | 0.330 |
| Saturated fat | 0 − 6 | 85.63 ± 1.10 | 85.42 ± 1.38 | 1.140 |
| Cholesterol | 0 − 6 | 83.85 ± 2.48 | 84.44 ± 2.07 | 1.893 |
| Sodium | 0 − 6 | 82.68 ± 0.61 | 82.44 ± 0.72 | 2.582∗∗ |
| Empty calorie foods | 0 − 6 | 82.23 ± 2.52 | 84.44 ± 2.07 | 7.001∗∗∗ |
| Moderation | 0 − 30 | 19.46 ± 4.95 | 21.73 ± 4.00 | 3.378∗∗∗ |
| Macronutrient ratio (Carbohydrate : Protein : Fat) | 0 − 6 | 82.13 ± 2.10 | 81.89 ± 2.31 | 0.773 |
| Fatty acid ratio (PUFA : MUFA : SFA) | 0 − 4 | 80.41 ± 0.96 | 80.30 ± 0.86 | 0.828 |
| Overall balance | 0 − 10 | 82.54 ± 2.09 | 82.19 ± 2.31 | 1.131 |
| Total | 100 | 62.60 ± 8.95 | 65.87 ± 9.86 | 2.525∗ |
1) Values are Mean ± SD
Significantly different between men and women groups by student's t test at ∗: P < 0.05, ∗∗: P < 0.01 and ∗∗∗: P < 0.001
Comparison of DQI-I in the subjects according to serum hs-CRP and Adiponectin level
| hs-CRP (µg/mL) | ||||||
|---|---|---|---|---|---|---|
| Q 1 (n = 47) | Q 2 (n = 44) | Q 3 (n = 47) | Q 4 (n = 45) | Q 5 (n = 46) | Total (N = 229) | |
| Variety | 13.51 ± 83.8721) | 13.27 ± 3.252 | 13.26 ± 82.952 | 13.64 ± 3.524 | 13.87 ± 3.344 | 13.51 ± 3.382 |
| Adequacy | 27.68 ± 86.058 | 27.23 ± 5.665 | 27.00 ± 85.912 | 26.22 ± 6.153 | 28.33 ± 6.415 | 27.30 ± 6.036 |
| Moderation | 21.34 ± 84.620 | 20.43 ± 4.133 | 19.23 ± 85.230 | 19.69 ± 4.709 | 20.27 ± 4.901 | 20.18 ± 4.757 |
| Balance | 82.34 ± 81.970 | 82.82 ± 2.414 | 82.64 ± 81.961 | 82.67 ± 2.132 | 82.70 ± 1.942 | 82.63 ± 2.075 |
| Total | 64.84 ± 10.163 | 64.38 ± 8.307 | 62.12 ± 89.504 | 62.22 ± 8.468 | 65.45 ± 9.959 | 63.77 ± 9.338 |
| Adiponectin (µg/mL) | ||||||
| Q 1 (n = 45) | Q 2 (n = 46) | Q 3 (n = 46) | Q 4 (n = 46) | Q 5 (n = 46) | Total (N = 229) | |
| Variety | 13.67 ± 83.268 | 13.26 ± 3.587 | 13.65 ± 83.261 | 13.17 ± 3.440 | 13.80 ± 3.442 | 13.51 ± 3.382 |
| Adequacy | 28.73 ± 85.561 | 26.70 ± 6.397 | 26.48 ± 86.257 | 26.24 ± 6.201 | 28.37 ± 5.511 | 27.30 ± 6.036 |
| Moderation | 19.71 ± 84.883a | 19.96 ± 4.871ab | 19.47 ± 85.459a | 19.93 ± 4.590ab | 21.93 ± 3.502b | 20.18 ± 4.757 |
| Balance | 82.98 ± 81.840 | 82.35 ± 1.946 | 82.83 ± 82.407 | 82.57 ± 2.051 | 82.43 ± 2.105 | 82.63 ± 2.075 |
| Total | 65.08 ± 89.253ab | 62.57 ± 8.457a | 62.68 ± 10.394a | 61.82 ± 9.504a | 66.88 ± 8.349b | 63.77 ± 9.338 |
1) Values are Mean ± SD
a, b values with different letters within the same line are significantly different from each other by Duncan's test at P = 0.05


