
Articles
- Page Path
- HOME > Korean J Community Nutr > Volume 16(1); 2011 > Article
-
Original Article
- Relationship between Nutrients Intakes, Dietary Quality, and Serum Concentrations of Inflammatory Markers in Metabolic Syndrome Patients
- Misung Kim1), Juyoung Kim, Wookyung Bae, Sohye Kim, Yesong Lee1), Woori Na1), Cheongmin Sohn†,1)†
-
Korean Journal of Community Nutrition 2011;16(1):51-61.
DOI: https://doi.org/10.5720/KJCN.2011.16.1.51
Published online: January 18, 2011
Health Promotion Center, Seoul National Universitiy of Bundang Hospital, Seongnam, Korea
1)Major in Food and Nutrition, Wonkwang University, Iksan, Korea
Health Promotion Center, Seoul National Universitiy of Bundang Hospital, Seongnam, Korea
1)Major in Food and Nutrition, Wonkwang University, Iksan, Korea
- †Corresponding author: Cheongmin Sohn, Major in Food and Nutriton, Wonkwang University, 344-2 Sinyong-Dong, Iksan, Jeonbuk 570-749, Korea Tel: (063) 850-6656, Fax: (063) 850-7301 E-mail: ccha@wku.ac.kr
Copyright © 2011 Korean Ophthalmological Society
This is an Open Access article distributed under the terms of the Creative Commons Attribution Non-Commercial License (http://creativecommons.org/licenses/by-nc/3.0/) which permits unrestricted non-commercial use, distribution, and reproduction in any medium, provided the original work is properly cited.
- 2,098 Views
- 4 Download
- 19 Crossref
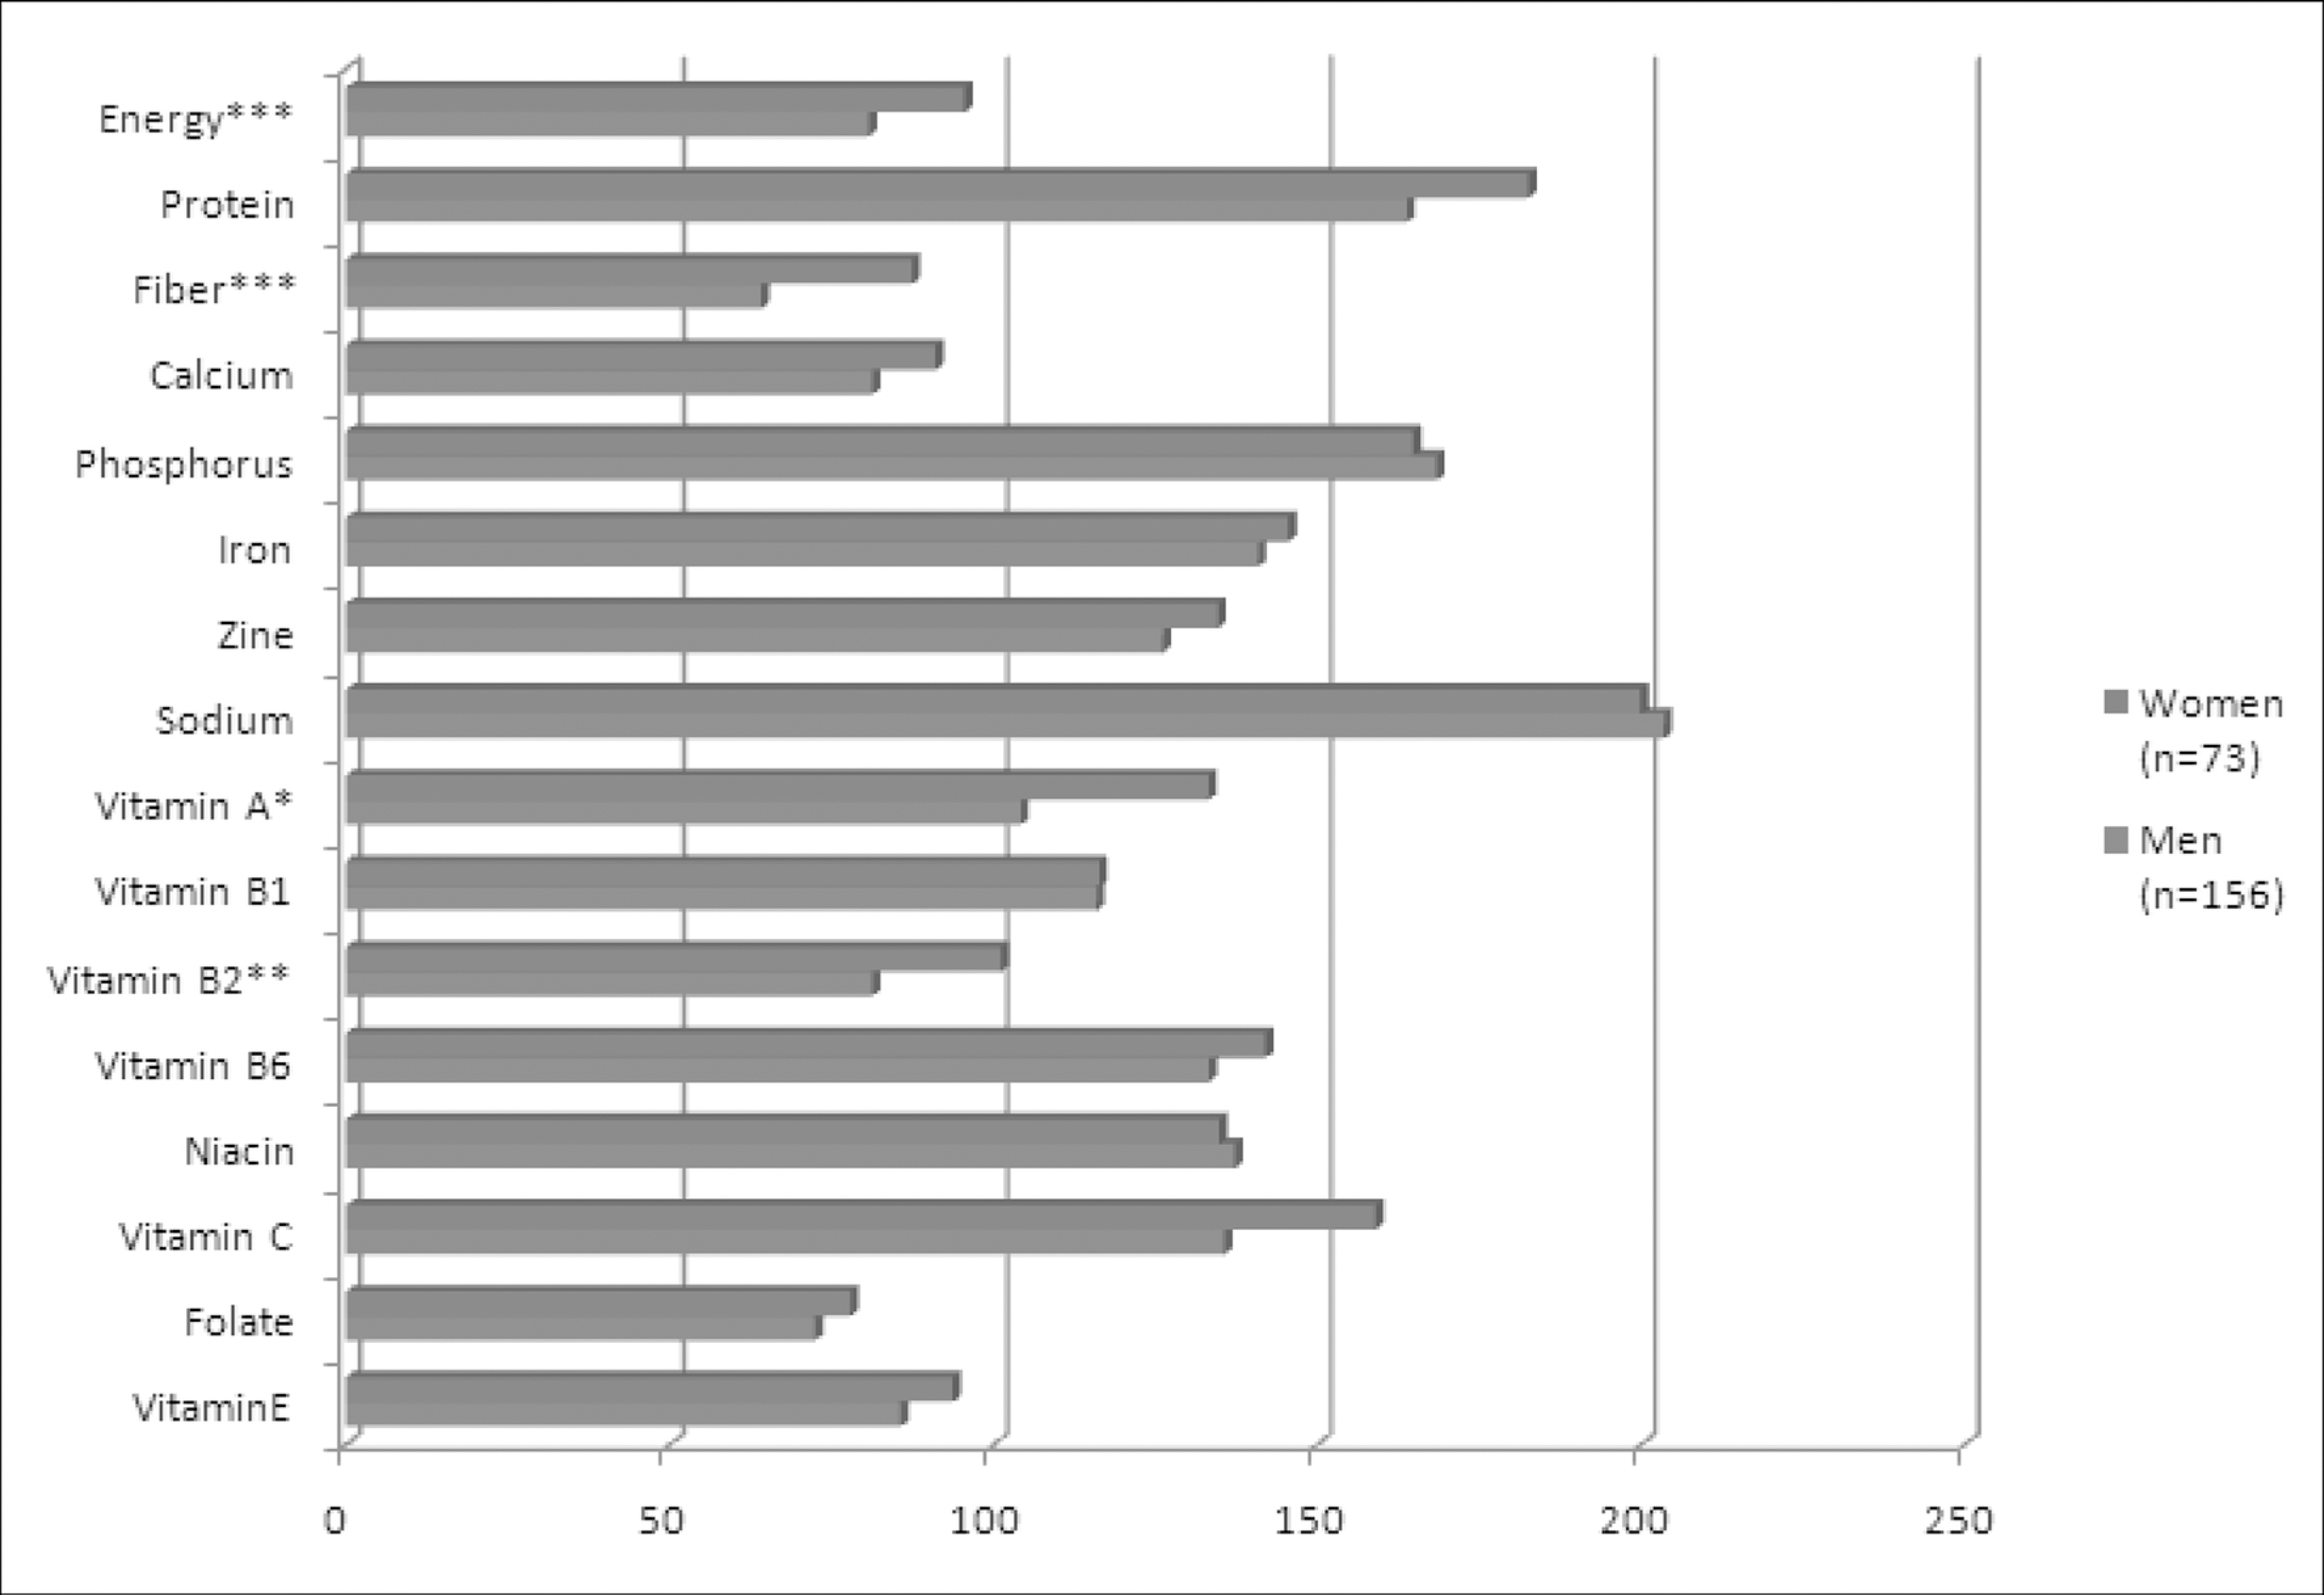
Figure & Data
REFERENCES
Citations
Citations to this article as recorded by 
- The relationship between diet quality index (DQI) with inflammatory indices and body mass index (BMI) in inflammatory bowel disease (IBD) patients
Parisa Karimi, Elmira Ramezani, Naser Ebrahimi Daryani, Ariyo Movahedi
Scientific Reports.2025;[Epub] CrossRef - Exploring metabolic syndrome and dietary quality in Iranian adults: a cross-sectional study
Zahra Namkhah, Kiyavash Irankhah, Sina Sarviha, Seyyed Reza Sobhani
BMC Nutrition.2024;[Epub] CrossRef - Association of Diet Quality and Food Insecurity with Metabolic Syndrome in Obese Adults
Ahmed Abdurahman, Mohammed Bule, Masoume Fallahyekt, Maryem Abshirini, Leila Azadbakht, Mostafa Qorbani, A. R. Dorosty
International Journal of Preventive Medicine.2021;[Epub] CrossRef - A Comparisons of Nutritional Intake and Diet Quality Index-International in Gynecological Cancer Survivors and Normal Women: Using the Korea National Health and Nutrition Examination Survey 2013~2016
Bo-Young Seo, Eun-Sil Her
Korean Journal of Community Nutrition.2020; 25(5): 406. CrossRef - Relation between the Total Diet Quality based on Korean Healthy Eating Index and the Incidence of Metabolic Syndrome Constituents and Metabolic Syndrome among a Prospective Cohort of Korean Adults
Saerom Shin, Seungmin Lee
Korean Journal of Community Nutrition.2020; 25(1): 61. CrossRef - Development of a food-based index of dietary inflammatory potential for Koreans and its relationship with metabolic syndrome
Woori Na, Tae Yang Yu, Cheongmin Sohn
Nutrition Research and Practice.2019; 13(2): 150. CrossRef - Association between Total Diet Quality and Metabolic Syndrome Incidence Risk in a Prospective Cohort of Korean Adults
Saerom Shin, Seungmin Lee
Clinical Nutrition Research.2019; 8(1): 46. CrossRef - Effects of food items and related nutrients on metabolic syndrome using Bayesian multilevel modelling using the Tehran Lipid and Glucose Study (TLGS): a cohort study
Zahra Cheraghi, Saharnaz Nedjat, Parvin Mirmiran, Nazanin Moslehi, Nasrin Mansournia, Mahyar Etminan, Mohammad Ali Mansournia, Lawrence C McCandless
BMJ Open.2018; 8(12): e020642. CrossRef - Development and Validation of Korean Inflammtory Index(K-DII) for Metabolic Disease Patients: by Using the Health Examinee Cohort (2012-2014)
Woori Na, Misung Kim, Susan Park, Minhyung Lee, Cheongmin Sohn
Korean Journal of Human Ecology.2017; 26(4): 369. CrossRef - Amelioration of metabolic disturbances and adipokine dysregulation by mugwort (Artemisia princeps P.) extract in high-fat diet-induced obese rats
Yun-Hye Kim, Chung-Mu Park, Gun-Ae Yoon
Journal of Nutrition and Health.2016; 49(6): 411. CrossRef - Development of dietary pattern evaluation tool for adults and correlation with Dietary Quality Index
Yeo Do Lee, Kyung Won Kim, Kyung-Suk Choi, Misung Kim, Yeo Jin Cho, Cheongmin Sohn
Nutrition Research and Practice.2016; 10(3): 305. CrossRef - Analysis of Dietary Inflammatory Index of Metabolic Syndrome in Korean : Data from the Health Examinee Cohort (2012-2014)
Mi-Sung Kim, Cheong-Min Sohn
Korean Journal of Human Ecology.2016; 25(6): 823. CrossRef - A study on dietary habits, nutrient intakes and dietary quality in adults of a health screening and promotion center according to non-alcoholic fatty liver disease
Ji Ho Chang, Hye Seung Lee, Eun Hee Kang
Journal of Nutrition and Health.2014; 47(5): 330. CrossRef - Correlation between vitamin D and cardiovascular disease predictors in overweight and obese Koreans
Misung Kim, Woori Na, Cheongmin Sohn
Journal of Clinical Biochemistry and Nutrition.2013; : 167. CrossRef - Comparison of health outcomes according to intervention compliance in male Korean workers with metabolic syndrome
Kyung-Hui Nam, Ji-Yeon Kang, Yeon-Ju Lee, Sook-Hee Sung, Youn-Koun Chang, Ji-Young Lee, Ill-Keun Park, Tae-In Choi
Korean Journal of Nutrition.2013; 46(2): 156. CrossRef - Effect of the Telephone-Delivered Nutrition Education on Dietary Intake and Biochemical Parameters in Subjects with Metabolic Syndrome
Juyoung Kim, Wookyung Bea, Kiheon Lee, Jongsoo Han, Sohye Kim, Misung Kim, Woori Na, Cheongmin Sohn
Clinical Nutrition Research.2013; 2(2): 115. CrossRef - Evaluation of nutrient intake and diet quality of gastric cancer patients in Korea
Heesook Lim, Gyuseok Cho, Soonkyung Kim
Nutrition Research and Practice.2012; 6(3): 213. CrossRef - The framingham risk score, diet, and inflammatory markers in Korean men with metabolic syndrome
Cheongmin Sohn, Juyong Kim, Wookyung Bae
Nutrition Research and Practice.2012; 6(3): 246. CrossRef - The Effects of 12-Weeks Intensive Intervention Program on Cardiovascular Risk Factors, Adipocytokines and Nutrients Intakes in Industrial Male Workers
Kieun Moon, Ill Keun Park, Yeon Sang Jo, Yun Kyun Chang, Yun Mi Paek, Tae In Choi
The Korean Journal of Nutrition.2011; 44(4): 292. CrossRef
 Cite
CiteRelationship between Nutrients Intakes, Dietary Quality, and Serum Concentrations of Inflammatory Markers in Metabolic Syndrome Patients

Fig. 1. Comparison of nutrient intakes of the two groups with KDRIs1)(%) DRI for reference : Energy EER2), Protein EAR3), Fiber AI4), Calcium EAR, Phosphorus EAR, Iron EAR, Sodium AI, Zinc EAR, Vitamin A EAR, Vitamin B1 EAR, Vitamin B2 EAR, Vitamin B6 EAR, Niacin EAR, Vitamin C EAR, Folate EAR, Vitamin E AI 1) KDRIs : Dietary Reference Intakes for Koreans 2) EER : Estimated energy requirement 3) EAR : Estimated average requirement 4) RNI : Recommended nutrient intake Significantly different between men and women groups by student's t test at ∗: P < 0.05, ∗∗: P < 0.01 and ∗∗∗: P < 0.001
Fig. 1.
Relationship between Nutrients Intakes, Dietary Quality, and Serum Concentrations of Inflammatory Markers in Metabolic Syndrome Patients
Comparison of anthropometric measurements, blood pressure and biochemical indices in men and women groups
| Men (n = 156) | Women (n = 73) | t-score | |
|---|---|---|---|
| Age (years) | 49.39 ± 10.101) | 48.72 ± 81.02 | 0.542 |
| Height (cm) | 172.86 ± 6.37 | 157.13 ± 5.16 | 18.454∗∗∗ |
| BMI (kg/m2)2) | 26.66 ± 2.85 | 26.00 ± 3.80 | 1.315 |
| Weight (kg) | 79.79 ± 10.85 | 64.17 ± 9.82 | 10.450∗∗∗ |
| WC (cm)3) | 93.48 ± 7.11 | 88.05 ± 7.56 | 5.274∗∗∗ |
| SBP (mmHg)4) | 128.14 ± 13.94 | 129.75 ± 14.40 | 0.807 |
| DBP (mmHg)5) | 81.03 ± 10.68 | 77.41 ± 9.06 | 2.505∗ |
| GGT (IU/L)6) | 56.60 ± 31.52 | 42.33 ± 43.98 | 2.644∗∗ |
| Glucose (mg/dL) | 106.44 ± 22.33 | 99.16 ± 17.52 | 2.453∗ |
| Cholesterol (mg/dL) | 196.72 ± 36.16 | 212.01 ± 36.14 | 2.983∗∗ |
| Triglyceride (mg/dL) | 175.92 ± 74.40 | 159.71 ± 58.22 | 1.790 |
| HDL-C (mg/dL)7) | 43.64 ± 9.22 | 46.18 ± 9.70 | 1.911 |
| LDL-C (mg/dL)8) | 109.37 ± 29.77 | 121.90 ± 32.23 | 2.888∗∗ |
| hs-CRP (µg/mL)9) | 1.82 ± 2.55 | 1.97 ± 2.78 | 0.406 |
| Adiponectin (µg/mL) | 8.10 ± 2.75 | 12.10 ± 4.79 | 6.663∗∗∗ |
1) Values are Mean ± SD, 2) BMI: Body Mass Index, 3) WC: Waist Circumference, 4) SBP: Systolic Blood Pressure, 5) DBP: Diastolic Blood Pressure, 6) GGT: Gamma Glutamyl Transferase, 7) HDL-C: high-density lipoprotein cholesterol, 8) LDL-C: low-density lipoprotein cholesterol, 9) hs-CRP: High-sensitivity C-reactive protein, Significantly different between men and women groups by student's t test at ∗: P < 0.05, ∗∗: P < 0.01 and ∗∗∗: P < 0.001
Correlation of inflammatory markers and metabolic syndrome factors
| Factors | log hs-CRP | log Adiponectin |
|---|---|---|
| WC | −0.184∗∗ | −0.165∗ |
| Glucose | −0.056 | −0.147∗ |
| Triglyceride | −0.078 | −0.193∗∗ |
| HDL-C | −0.028 | −0.222∗∗ |
| SBP | −0.037 | −0.110 |
| DBP | −0.091 | −0.020 |
Significantly different at ∗: P < 0.05 and ∗∗: P < 0.01 Serum hs-CRP and Adiponectin concentrations were logarithmically transformed because of their right-skewed deviation.
Comparison of daily nutrients intake in men and women groups
| Men (n = 156) | Women (n = 73) | Total (N = 229) | t-score | |
|---|---|---|---|---|
| Energy (kcal)1) | 1859.28 ± 7613.14 | 1721.94 ± 7731.72 | 1815.50 ± 7654.80 | 1.483 |
| Protein (g) | 7769.97 ± 7734.85 | 7763.95 ± 7732.02 | 7768.05 ± 7734.02 | 1.250 |
| Fiber (g) | 7717.73 ± 7779.26 | 7719.44 ± 7710.85 | 7718.28 ± 7779.80 | 1.228 |
| Calcium (mg) | 7471.56 ± 7311.86 | 7528.36 ± 7338.89 | 7489.67 ± 7321.07 | 1.249 |
| Phosphorus (mg) | 7977.00 ± 7451.78 | 7956.00 ± 7457.85 | 7970.31 ± 7452.82 | 0.326 |
| Iron (mg) | 7711.27 ± 7776.33 | 7711.19 ± 7776.28 | 7711.25 ± 7776.30 | 0.088 |
| Sodium (mg) | 2845.75 ± 1827.75 | 2639.56 ± 1699.65 | 2780.02 ± 1786.78 | 0.813 |
| Zinc (mg) | 7779.73 ±777 5.93 | 7778.59 ± 7774.50 | 7779.36 ± 7775.53 | 1.455 |
| Vitamin A (µgRE) | 7533.74 ± 7403.36 | 7579.57 ± 7441.79 | 7548.35 ± 7415.58 | 0.777 |
| Vitamin B1 (mg) | 7771.16 ± 7770.60 | 7771.05 ± 7770.55 | 7771.12 ± 7770.59 | 1.345 |
| Vitamin B2 (mg) | 7771.06 ±777 0.57 | 7771.01 ± 7770.58 | 7771.04 ± 7770.57 | 0.539 |
| Vitamin B6 (mg) | 7771.73 ±777 0.85 | 7771.70 ± 7770.92 | 7771.72 ± 7770.87 | 0.228 |
| Niacin (mg) | 7716.47 ± 7778.32 | 7714.84 ± 7777.56 | 7715.95 ± 7778.11 | 1.418 |
| Vitamin C (mg) | 7101.81 ± 7773.44 | 7119.30 ± 789.40 | 7107.38 ± 779.10 | 1.564 |
| Folate (µg) | 7232.05 ± 7137.35 | 7249.42 ± 7155.88 | 7237.59 ± 7143.40 | 0.853 |
| Vitamin E (mg) | 7778.57 ± 7774.43 | 7779.38 ± 7776.89 | 7778.83 ± 7775.34 | 1.067 |
1) Values are Mean ± SD All values are not significantly different between the two groups by student's t-test
Correlation of inflammatory markers and nutrients Intake
| Factors | log hs-CRP1) | log Adiponectin2) |
|---|---|---|
| Lipid | 0.071 | 0.125∗ |
| Total sugar | 0.025 | 0.167∗∗ |
| Fiber | 0.023 | 0.076 |
| β-carotene | 0.015 | 0.101 |
| Vitamin C | 0.011 | 0.049 |
| Cholesterol | 0.105 | 0.082 |
| Total fatty acid | 0.082 | 0.128∗ |
| Saturated fatty acids | s −0.067 | 0.099 |
| Monounsaturated fa | tty acids −0.073 | 0.116∗ |
| Polyunsaturated fatty | y acids −0.122∗ | 0.194∗∗ |
1) Adjustment for waist circumference
2) Adjustment for waist circumference, glucose, triglyceride, and HDL-cholesterol
Significantly different at ∗: P < 0.05 and ∗∗: P < 0.01
Comparison of Diet Quality index-international(DQI-I) in men and women groups
| Score ranges (points) | Men (n = 156) | Women (n = 73) | t-score | |
|---|---|---|---|---|
| Overall food group variety | 0 − 15 | 10.48 ± 2.221) | 10.89 ± 2.37 | 1.272 |
| Within-group variety for protein source | 0 − 5 | 83.00 ± 1.93 | 82.68 ± 2.05 | 1.127 |
| Variety | 0 − 20 | 13.48 ± 3.26 | 13.58 ± 3.66 | 0.197 |
| Vegetable group | 0 − 5 | 82.68 ± 1.41 | 82.97 ± 1.55 | 1.422 |
| Fruits group | 0 − 5 | 81.90 ± 1.71 | 82.52 ± 1.94 | 2.347∗ |
| Grain group | 0 − 5 | 84.29 ± 1.01 | 84.21 ± 1.04 | 0.618 |
| Fiber | 0 − 5 | 83.28 ± 1.27 | 83.60 ± 1.28 | 1.774 |
| Protein | 0 − 5 | 84.95 ± 0.32 | 84.97 ± 0.23 | 0.574 |
| Iron | 0 − 5 | 83.88 ± 1.16 | 83.85 ± 1.29 | 0.207 |
| Calcium | 0 − 5 | 82.44 ± 1.43 | 82.56 ± 1.38 | 0.625 |
| Vitamin C | 0 − 5 | 83.37 ± 1.50 | 83.68 ± 1.38 | 1.506 |
| Adequacy | 0 − 40 | 26.79 ± 5.94 | 28.37 ± 6.14 | 1.850 |
| Total fat | 0 − 6 | 85.02 ± 1.64 | 85.10 ± 1.63 | 0.330 |
| Saturated fat | 0 − 6 | 85.63 ± 1.10 | 85.42 ± 1.38 | 1.140 |
| Cholesterol | 0 − 6 | 83.85 ± 2.48 | 84.44 ± 2.07 | 1.893 |
| Sodium | 0 − 6 | 82.68 ± 0.61 | 82.44 ± 0.72 | 2.582∗∗ |
| Empty calorie foods | 0 − 6 | 82.23 ± 2.52 | 84.44 ± 2.07 | 7.001∗∗∗ |
| Moderation | 0 − 30 | 19.46 ± 4.95 | 21.73 ± 4.00 | 3.378∗∗∗ |
| Macronutrient ratio (Carbohydrate : Protein : Fat) | 0 − 6 | 82.13 ± 2.10 | 81.89 ± 2.31 | 0.773 |
| Fatty acid ratio (PUFA : MUFA : SFA) | 0 − 4 | 80.41 ± 0.96 | 80.30 ± 0.86 | 0.828 |
| Overall balance | 0 − 10 | 82.54 ± 2.09 | 82.19 ± 2.31 | 1.131 |
| Total | 100 | 62.60 ± 8.95 | 65.87 ± 9.86 | 2.525∗ |
1) Values are Mean ± SD
Significantly different between men and women groups by student's t test at ∗: P < 0.05, ∗∗: P < 0.01 and ∗∗∗: P < 0.001
Comparison of DQI-I in the subjects according to serum hs-CRP and Adiponectin level
| hs-CRP (µg/mL) | ||||||
|---|---|---|---|---|---|---|
| Q 1 (n = 47) | Q 2 (n = 44) | Q 3 (n = 47) | Q 4 (n = 45) | Q 5 (n = 46) | Total (N = 229) | |
| Variety | 13.51 ± 83.8721) | 13.27 ± 3.252 | 13.26 ± 82.952 | 13.64 ± 3.524 | 13.87 ± 3.344 | 13.51 ± 3.382 |
| Adequacy | 27.68 ± 86.058 | 27.23 ± 5.665 | 27.00 ± 85.912 | 26.22 ± 6.153 | 28.33 ± 6.415 | 27.30 ± 6.036 |
| Moderation | 21.34 ± 84.620 | 20.43 ± 4.133 | 19.23 ± 85.230 | 19.69 ± 4.709 | 20.27 ± 4.901 | 20.18 ± 4.757 |
| Balance | 82.34 ± 81.970 | 82.82 ± 2.414 | 82.64 ± 81.961 | 82.67 ± 2.132 | 82.70 ± 1.942 | 82.63 ± 2.075 |
| Total | 64.84 ± 10.163 | 64.38 ± 8.307 | 62.12 ± 89.504 | 62.22 ± 8.468 | 65.45 ± 9.959 | 63.77 ± 9.338 |
| Adiponectin (µg/mL) | ||||||
| Q 1 (n = 45) | Q 2 (n = 46) | Q 3 (n = 46) | Q 4 (n = 46) | Q 5 (n = 46) | Total (N = 229) | |
| Variety | 13.67 ± 83.268 | 13.26 ± 3.587 | 13.65 ± 83.261 | 13.17 ± 3.440 | 13.80 ± 3.442 | 13.51 ± 3.382 |
| Adequacy | 28.73 ± 85.561 | 26.70 ± 6.397 | 26.48 ± 86.257 | 26.24 ± 6.201 | 28.37 ± 5.511 | 27.30 ± 6.036 |
| Moderation | 19.71 ± 84.883a | 19.96 ± 4.871ab | 19.47 ± 85.459a | 19.93 ± 4.590ab | 21.93 ± 3.502b | 20.18 ± 4.757 |
| Balance | 82.98 ± 81.840 | 82.35 ± 1.946 | 82.83 ± 82.407 | 82.57 ± 2.051 | 82.43 ± 2.105 | 82.63 ± 2.075 |
| Total | 65.08 ± 89.253ab | 62.57 ± 8.457a | 62.68 ± 10.394a | 61.82 ± 9.504a | 66.88 ± 8.349b | 63.77 ± 9.338 |
1) Values are Mean ± SD
a, b values with different letters within the same line are significantly different from each other by Duncan's test at P = 0.05


