
Articles
- Page Path
- HOME > Korean J Community Nutr > Volume 21(3); 2016 > Article
-
Research Article
- Relationship between Bone Mineral Density and Bone Metabolic Biochemical Markers and Diet Quality Index-International(DQI-I) in Postmenopausal Obese Women
-
Yeonah Jeong, Misung Kim, Saeron Shin, Ahreum Han, Geomsuk Seo, Cheongmin Sohn

-
Korean Journal of Community Nutrition 2016;21(3):284-292.
DOI: https://doi.org/10.5720/kjcn.2016.21.3.284
Published online: June 30, 2016
1Department of Nutrition Services, Wonkwnag University Hospital, Iksan, Korea.
2Department of Food and Nutrition, Wonkwang University, Iksan, Korea.
3Department of Family Medicine, Wonkwang University Hospital, Iksan, Korea.
4Department of Internal Medicine, Digestive Disease Research Institute, Wonkwang University College of Medicine, Iksan, Korea.
- Corresponding author: Cheongmin Sohn. Department of Food and Nutrition, Wonkwang University, 460 Iksandae-ro, Iksan, Jeonbuk 54538, Korea. Tel: (063) 850-6656, Fax: (063) 850-7301, ccha@wku.ac.kr
• Received: June 13, 2016 • Revised: June 22, 2016 • Accepted: June 22, 2016
Copyright © 2016 The Korean Society of Community Nutrition
This is an Open-Access article distributed under the terms of the Creative Commons Attribution Non-Commercial License (http://creativecommons.org/licenses/by-nc/3.0/) which permits unrestricted non-commercial use, distribution, and reproduction in any medium, provided the original work is properly cited.
- 1,555 Views
- 0 Download
Abstract
-
Objectives
- This study compared the differences of postmenopausal women's bone mineral density in relation to the degree of obesity, metabolism index and dietary factors that affect bone mineral density.
-
Methods
- The subjects included in the study are 39 postmenopausal women of normal weight with body mass index less than 25 kg/m2 and 32 postmenopausal who are obese. Anthropometry and biochemical analysis were performed and nutrient intakes and DQI-I were assessed.
-
Results
- Normal weight women were 56.03 ± 3.76 years old and obese women were 58.09 ± 5.13 years old and there was no significant difference in age between the two groups. The T-score of bone mineral density was 0.03 ± 1.06 in normal weight women and −0.60 ± 1.47 in obese women and this was significantly different between the two groups (p<0.05). Blood Leptin concentration was significantly lower in normal weight women (6.09 ± 3.37 ng/mL) compared to obese women in (9.01 ± 4.99 ng/mL) (p<0.05). The total score of diet quality index-international was 70.41±9.34 in normal weight women and 64.93 ± 7.82 in obese women (p<0.05). T-score of bone mineral density showed negative correlations with percentage of body fat (r = −0.233, p=0.05), BMI (r = −0.197, p=0.017), triglyceride (r = −0.281, p=0.020) and leptin (r = −0.308, p=0.011). The results of multiple regression analysis performed as the method of entry showed that with 22.0% of explanation power, percentage of body fat (β =−0.048, p<0.05), triglyceride (β=−0.005, p<0.05) and HDL-cholesterol (β=0.034, p<0.01), moderation of DQI-I (β=−0.231, p<0.05) affected T-score significantly.
-
Conclusions
- The results of the study showed that obese women have less bone density than those with normal weight women. In addition, the factor analysis result that affect bone mineral density showed that intake of fat is a very important factor. Therefore, postmenopausal women need to maintain normal weight and manage blood lipid levels within normal range. They also need to take various sources of protein and reduce consumption of empty calorie foods that have high calories, fat, cholesterol and sodium.
Acknowledgments
Acknowledgments
- 1. Baik I, Shin C. Association of daily sleep duration with obesity, macronutrient intake, and physical activity. Korean J Community Nutr 2011; 16(3): 315-323.Article
- 2. Ministry of Health and Welfare and Korea Centers for Disease Control and Prevention. Korea Health Statistics 2014: Korea National Health and Nutrition Examination Survey [KNHANES VI-2] [internet]. 2015; cited 2016 May 01]. Available from: https://knhanes.cdc.go.kr/knhanes/index.do.
- 3. Neeland IJ, Turer AT, Ayers CR, Powell-Wiley TM, Vega GL, Farzaneh-Far R. Dysfunctional adiposity and the risk of prediabetes and type 2 diabetes in obese adults. JAMA 2012; 308(11): 1150-1159.ArticlePubMedPMC
- 4. Meier U, Gressner AM. Endocrine regulation of energy metabolism: review of pathobiochemical and clinical chemical aspects of leptin, ghrelin, adiponectin, and resistin. Clin Chem 2004; 50(9): 1511-1525.ArticlePubMedPDF
- 5. Kershaw EE, Flier JS. Adipose tissue as an endocrine organ. J Clin Endocrinol Metab 2004; 89(6): 2548-2556.ArticlePubMed
- 6. Christenson RH. Biochemical markers of bone metabolism: an overview. Clin Biochem 1997; 30(8): 573-593.ArticlePubMed
- 7. Ministry of Health and Welfare and Korea Centers for Disease Control and Prevention. Korea Health Statistics 2010: Korea National Health and Nutrition Examination Survey [KNHANES V-1] [internet]. 2012; cited 2016 May 01]. Available from: https://knhanes.cdc.go.kr/knhanes/index.do.
- 8. Park JY, Choi MY, Lee SH, Choi YH, Park YK. The association between bone mineral density, bone turnover markers and nutrient intake in pre- and postmenopausal women. Korean J Nutr 2011; 44(1): 29-40.Article
- 9. Filip R, Raszewski G. Bone mineral density and bone turnover in relation to serum leptin, alpha-ketoglutarate and sex steroids in overweight and obese postmenopausal women. Clin Endocrinol (Oxf) 2009; 70(2): 214-220.PubMed
- 10. Choi YH, Sung CJ. Effects of physiological factors and lifestyles on bone mineral density in postmenopausal women. Korean J Nutr 2007; 40(6): 517-525.
- 11. Oh HJ, Lim CH, Chung HY, Han KO, Chang HC, Yoon HK. Effect of obesity on BMD in postmenopausal women. Korean J Obes 2000; 9(2): 122-127.
- 12. Compston JE, Watts NB, Chapurlat R, Cooper C, Boonen S, Greenspan S. Obesity is not protective against fracture in postmenopausal women: GLOW. Am J Med 2011; 124(11): 1043-1050.ArticlePubMedPMC
- 13. Hu FB. Dietary pattern analysis: a new direction in nutritional epidemiology. Curr Opin Lipidol 2002; 13(1): 3-9.ArticlePubMed
- 14. Kim S, Haines PS, Siega-Riz AM, Popkin BM. The Diet Quality Index-International (DQI-I) provides an effective tool for cross-national comparison of diet quality as illustrated by China and the United States. J Nutr 2003; 133(11): 3476-3484.ArticlePubMed
- 15. Sipila S, Narici M, Kjaer M, Pollanen E, Atkinson RA, Hansen M. Sex hormones and skeletal muscle weakness. Biogerontology 2013; 14(3): 231-245.ArticlePubMedPDF
- 16. Czarkowska-Paczek B, Milczarczyk S. Age-related muscle mass loss. Przegl Lek 2006; 63(8): 658-661.PubMed
- 17. Christenson RH. Biochemical markers of bone metabolism: an overview. Clin Biochem 1997; 30(8): 573-593.ArticlePubMed
- 18. Ho-Pham LT, Nguyen ND, Lai TQ, Nguyen TV. Contributions of lean mass and fat mass to bone mineral density: a study in postmenopausal women. BMC Musculoskelet Disord 2010; ArticlePDF
- 19. Ijuin M, Douchi T, Matsuo T, Yamamoto S, Uto H, Nagata Y. Difference in the effects of body composition on bone mineral density between pre- and postmenopausal women. Maturitas 2002; 43(4): 239-244.ArticlePubMed
- 20. Reid IR, Ames R, Evans MC, Sharpe S, Gamble G, France JT. Determinants of total body and regional bone mineral density in normal postmenopausal women-a key role for fat mass. J Clin Endocrinol Metab 1992; 75(1): 45-51.ArticlePubMed
- 21. Hsu YH, Venners SA, Terwedow HA, Feng Y, Niu T, Li Z. Relation of body composition, fat mass, and serum lipids to osteoporotic fractures and bone mineral density in Chinese men and women. Am J Clin Nutr 2006; 83(1): 146-154.ArticlePubMed
- 22. Park SJ, Ahn YJ, Min HS, Oh KS, Park C, Cho NH. Osteoporosis prevalence of radius and tibia and related factors using multiple bone sites quantitative ultrasound measurement of the Korean health and genome study cohort women. Korean J Community Nutr 2005; 10(4): 536-545.
- 23. Koo JO, Park SY. Analysis of BMI menopose, blood pressure and dietary habits affecting born mineral density of 30-60 years women. Korean J Community Nutr 2010; 15(3): 403-414.
- 24. Ducy P, Amling M, Takeda S, Priemel M, Schilling AF, Beil FT. Leptin inhibits bone formation through a hypothalamic relay: a central control of bone mass. Cell 2000; 100(2): 197-207.ArticlePubMed
- 25. Burguera B, Hofbauer LC, Thomas T, Gori F, Evans GL, Khosla S. Leptin reduces ovariectomy-induced bone loss in rats. Endocrinology 2001; 142(8): 3546-3553.ArticlePubMed
- 26. Holloway WR, Collier FM, Aitken CJ, Myers DE, Hodge JM, Malakellis M. Leptin inhibits osteoclast generation. J Bone Miner Res 2002; 17(2): 200-209.ArticlePubMedPDF
- 27. Lee MY, Kim JH. Comparison of serum insulin, leptin, adiponectin and high sensitivity C-reactive protein levels according to body mass index and their associations in adult women. Korean J Community Nutr 2011; 16(1): 126-135.Article
- 28. Yeo JK, Lee SJ, Joo IW, Kim JA, Oh HJ. Age-related changes of serum bone turnover marker (osteocalcin, bone specific alkaline phosphatase and cross-linked C telopeptides of type I collagen) and the relationship with bone mineral density in Korean women. Osteoporosis 2008; 6(1): 43-50.
- 29. Yang R, Ma X, Pan X, Wang F, Luo Y, Gu C. Serum osteocalcin levels in relation to metabolic syndrome in Chinese postmenopausal women. Menopause 2013; 20(5): 548-553.ArticlePubMed
- 30. Bae SJ, Choe JW, Chung YE, Kim BJ, Lee SH, Kim HY. The association between serum osteocalcin levels and metabolic syndrome in Koreans. Osteoporos Int 2011; 22(11): 2837-2846.ArticlePubMedPDF
- 31. Zeng FF, Xue WQ, Cao WT, Wu BH, Xie HL, Fan F. Diet-quality scores and risk of hip fractures in elderly urban Chinese in Guangdong, China: a case-control study. Osteoporos Int 2014; 25(8): 2131-2141.ArticlePubMedPDF
- 32. Yamaguchi T, Sugimoto T, Yano S, Yamauchi M, Sowa H, Chen Q. Plasma lipids and osteoporosis in postmenopausal women. Endocr J 2002; 49(2): 211-217.ArticlePubMed
- 33. Cui LH, Shin MH, Chung EK, Lee YH, Kweon SS, Park KS. Association between bone mineral densities and serum lipid profiles of pre- and post-menopausal rural women in South Korea. Osteoporos Int 2005; 16(12): 1975-1981.ArticlePubMedPDF
- 34. Luegmayr E, Glantschnig H, Wesolowski GA, Gentile MA, Fisher JE, Rodan GA. Osteoclast formation, survival and morphology are highly dependent on exogenous cholesterol/lipoproteins. Cell Death Differ 2004; 11: Suppl 1. S108-S118.ArticlePubMedPDF
- 35. Parhami F, Demer LL. Arterial calcification in face of osteoporosis in ageing: can we blame oxidized lipids? Curr Opin Lipidol 1997; 8(5): 312-314.ArticlePubMed
REFERENCES
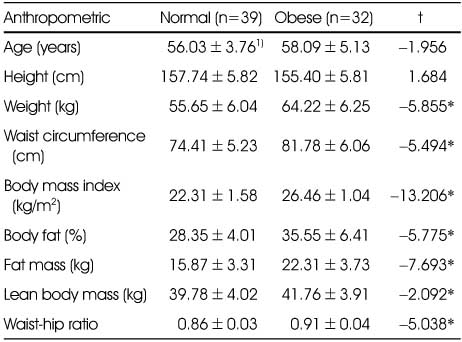
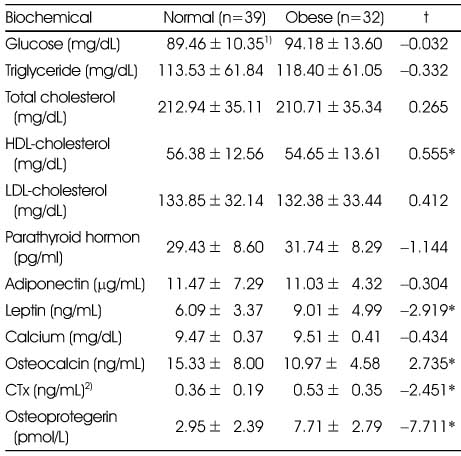
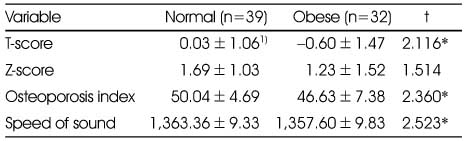
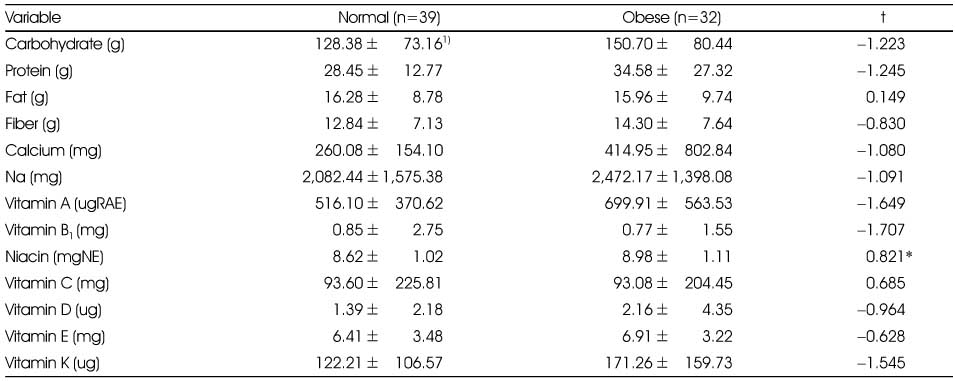
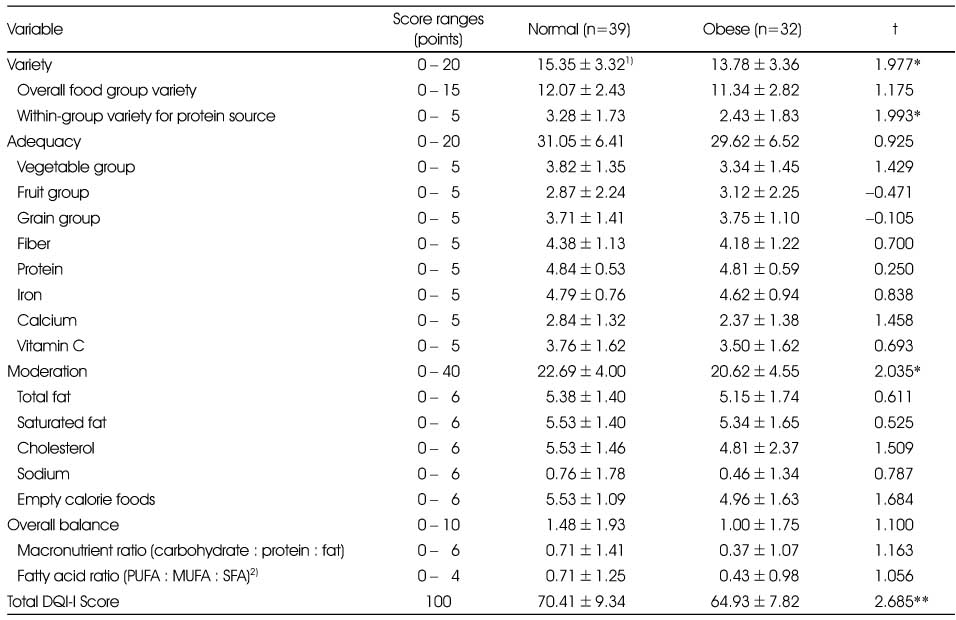
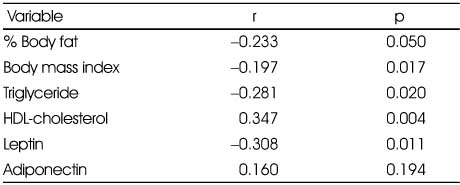
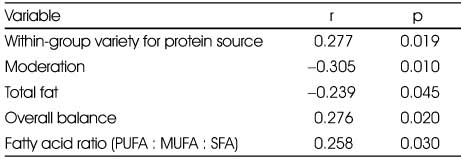
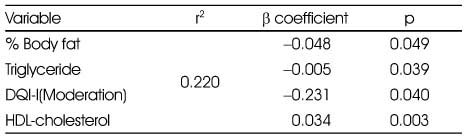
Figure & Data
REFERENCES
Citations
Citations to this article as recorded by 
 Cite
CiteRelationship between Bone Mineral Density and Bone Metabolic Biochemical Markers and Diet Quality Index-International(DQI-I) in Postmenopausal Obese Women
Relationship between Bone Mineral Density and Bone Metabolic Biochemical Markers and Diet Quality Index-International(DQI-I) in Postmenopausal Obese Women
Comparison of anthropometric measurements
1) Mean±SD
*: p < 0.05 Significantly different between postmenopausal normal women and obese women by Student t-test
Comparison of biochemical indices of subjects
1) Mean±SD
2) CTx: C-terminal telopeptides of Type l collagen
*: p < 0.05 Significantly different between postmenopausal normal women and obese women by Student t-test
Comparison of bone mineral density of subjects
1) Mean±SD
*: p < 0.05 Significantly different between postmenopausal normal women and obese women by Student t-test
Nutrient intakes compared to 1,000 kcal energy intake
1) Mean±SD
*: p < 0.05 Significantly different between postmenopausal normal women and obese women by Student t-test
Diet Quality Index-International (DQI-I)
1) Mean±SD
2) PUFA: Polyunsaturated Fatty Acid, MUFA: Monounsaturated Fatty Acid, SFA: Saturated Fatty Acid
*: p < 0.05, **: p < 0.01 Significantly different between postmenopausal normal women and obese women by Student t-test
Correlation of bone mineral density (T-score) with related anthropometric and biochemical index
Correlation of bone mineral density (T-score) with related Diet Quality Index-International
Multiple regression analysis on bone mineral density (T-score) by anthropometric and biochemical index and Diet Quality Index-International
Adjusted for age, weight, height, dietary supplement, hormonal replacement therapy
Table 1
Comparison of anthropometric measurements
1) Mean±SD *: p < 0.05 Significantly different between postmenopausal
normal women and obese women by Student t-test
Table 2
Comparison of biochemical indices of subjects
1) Mean±SD 2) CTx: C-terminal telopeptides of Type l collagen *: p < 0.05 Significantly different between postmenopausal
normal women and obese women by Student t-test
Table 3
Comparison of bone mineral density of subjects
1) Mean±SD *: p < 0.05 Significantly different between postmenopausal
normal women and obese women by Student t-test
Table 4
Nutrient intakes compared to 1,000 kcal energy intake
1) Mean±SD *: p < 0.05 Significantly different between postmenopausal normal women and obese women by Student t-test
Table 5
Diet Quality Index-International (DQI-I)
1) Mean±SD 2) PUFA: Polyunsaturated Fatty Acid, MUFA: Monounsaturated Fatty Acid, SFA: Saturated Fatty Acid *: p < 0.05, **: p < 0.01 Significantly different between postmenopausal normal women and obese women by Student t-test
Table 6
Correlation of bone mineral density (T-score) with related anthropometric and biochemical index
Table 7
Correlation of bone mineral density (T-score) with related Diet Quality Index-International
Table 8
Multiple regression analysis on bone mineral density (T-score) by anthropometric and biochemical index and Diet Quality Index-International
Adjusted for age, weight, height, dietary supplement, hormonal replacement therapy


