
Articles
- Page Path
- HOME > Korean J Community Nutr > Volume 20(4); 2015 > Article
-
Research Article
- The Effect of Obesity-Related Quality of Life on selecting a Goal for Weight Management in Overweight and Obese Patients
- Min Young Chun
-
Korean Journal of Community Nutrition 2015;20(4):281-290.
DOI: https://doi.org/10.5720/kjcn.2015.20.4.281
Published online: August 30, 2015
Department of Global Medical Science, Sungshin Women's University, Seoul, Korea.
- Corresponding author: Min Young Chun. Department of Global Medical Science, Sungshin Women's University, 55 Dobong-ro, 76ga-gil, Gangbuk-gu, Seoul 01133, Korea. Tel: (02) 920-7232, Fax: (02) 920-2027, sunrise91@sungshin.ac.kr
• Received: August 3, 2015 • Revised: August 23, 2015 • Accepted: August 29, 2015
Copyright © 2015 The Korean Society of Community Nutrition
This is an Open-Access article distributed under the terms of the Creative Commons Attribution Non-Commercial License (http://creativecommons.org/licenses/by-nc/3.0/) which permits unrestricted non-commercial use, distribution, and reproduction in any medium, provided the original work is properly cited.
- 1,840 Views
- 15 Download
- 2 Crossref
Abstract
-
Objectives
- Obesity is known to influence physical and mental health as well as the general quality of life. The aim of this study was to evaluate the effect of obesity related quality of life on selecting a goal for weight management in overweight and obese female patients.
-
Methods
- A total of 140 overweight or obese (Body mass index 23 kg/m2) female outpatients aged ≥ 20 and ≤ 60 years from one clinic participated in this study. Patients' desired weight (goal weight, ideal weight, satisfactory weight, acceptable weight and disappointed weight) and obesity related quality of life measures were evaluated. Univariate and multivariate analysis were performed to evaluate the effect of obesity related quality of life on goal weight reduction (%) and goal body mass index (BMI).
-
Results
- Mean BMI of overweight group, mild obesity group and severe obesity group were 62.0 ± 4.8 kg, 68.5 ± 5.5 kg and 83.5 ± 9.6 kg, respectively. Mean weight loss expectations of the three groups were 16.4 ± 4.7%, 19.5 ± 5.3% and 30.2 ± 6.8%, respectively and goal weight was significantly different among the three groups. Severe obesity group had a lower total quality of life score including physical, work-related, daily living domains than overweight or mild obesity groups. In univariate and multivariate regression analysis, psychosocial domain of quality of life had an effect on goal weight reduction (%) and goal BMI.
-
Conclusions
- The results of this study demonstrated that the obese patients with poorer quality of life and psychosocial health tended to choose higher goal weight reduction and lower goal BMI.
- 1. World Health Organization. Media centre: obesity and overweight [Internet]. Geneva: World Health Organization; 2014; cited 2015 Jun 18]. Available from: http://www.who.int/medicentre/factsheets/fs311/en/.
- 2. Ministry of Health and Welfare & Korea Center for Disease Control and Prevention. The fifth Korean national health and nutrition examination survey (KNHANESV) [internet]. 2011; cited 2015 Jun 22]. Available from: http://knhanes.cdc.go.kr.
- 3. Larsson B, Svärdsudd K, Welin L, Wilhelmsen L, Björntorp P, Tibblin G. Abdominal adipose tissue distribution, obesity, and risk of cardiovascular disease and death: 13 year follow up of participants in the study of men born in 1913. Br Med J (Clin Res Ed) 1984; 288(6428): 1401-1404.ArticlePubMedPMC
- 4. Neeland IJ, Turer AT, Ayers CR, Powell-Wiley TM, Vega GL, Farzaneh-Far R. Dysfunctional adiposity and the risk of prediabetes and type 2 diabetes in obese adults. JAMA 2012; 308(11): 1150-1159.ArticlePubMedPMC
- 5. Klop B, Elte JW, Cabezas MC. Dyslipidemia in obesity: mechanisms and potential targets. Nutrients 2013; 5(4): 1218-1240.ArticlePubMedPMC
- 6. Jo JS, Hand DM, Park HS. The depression in the obese. J Korean Acad Fam Med 1995; 16(4): 239-245.
- 7. Mathias SD, Williamson CL, Colwell HH, Cisternas MG, Pasta DJ, Stolshek BS. Assessing health-related quality-of-life and health state preference in persons with obesity: a validation study. Qual Life Res 1997; 6(4): 311-322.ArticlePubMedPDF
- 8. Pi-Sunyer FX. Sort-term medical benefits and adverse effects of weight loss. Ann Intern Med 1993; 119(7 Part 2): 722-726.ArticlePubMed
- 9. Foster GD, Wadden TA, Phelan S, Sarwer DB, Sanderson RS. Obese patients' perceptions of treatment outcomes and the factors that influence them. Arch Intern Med 2001; 161(17): 2133-2139.ArticlePubMed
- 10. Foster GD, Wadden TA, Vogt RA, Brewer G. What is a reasonable weight loss? Patients' expectations and evaluations of obesity treatment outcomes. J Consult Clin Psychol 1997; 65(1): 79-85.ArticlePubMed
- 11. Chun MY. Factors of selecting a goal weight in female obesity patient. Health Commun 2013; 8(1): 26-34.
- 12. Park HS, Sun WS, Ou SW, Lee KY, Kim BS, Han JH, et al. Development of Korean version of obesity-related quality of life scale. J Korean Soc Study Obes 2003; 12(4): 280-293.
- 13. Lee JS, Shin CI, Kim BT, Lee KW, Park HS. Effect of weight reduction on obesity-specific quality of life (QOL) in obese subjects. Korean J Obes 2006; 15(2): 106-113.
- 14. Chaung SK, Kim CG. Obesity-related quality of life in overweight and obese female college students. J Korean Acad Community Health Nurs 2007; 18(4): 543-551.
- 15. Park HA, Sung EJ, Park YW, Oh SW, Park HS. Desired weight of obesity patients. J Korean Acad Fam Med 2003; 24(10): 904-911.
- 16. Park HA, Cho JJ. Economic activities and socioeconomic status of morbidly obese Korean adults. Korean J Obes 2011; 20(4): 210-218.Article
- 17. Roehling MV. Weight-based discrimination in employment: Psychological and legal aspects. Pers Psychol 1999; 52(4): 969-1016.Article
- 18. Hall JE. Pathophysiology of obesity hypertension. Curr Hypertens Rep 2000; 2(2): 139-147.ArticlePubMedPDF
- 19. Hall JE, Crook ED, Jones DW, Wofford MR, Dubbert PM. Mechanisms of obesity-associated cardiovascular and renal disease. Am J Med Sci 2002; 324(3): 127-137.ArticlePubMed
- 20. Frohlich ED. Clinical management of the obese hypertensive patient. Cardiol Rev 2002; 10(3): 127-138.ArticlePubMed
- 21. Ziegler O, Filipecki J, Girod I, Guillemin F. Development and validation of a French obesity specific quality of life questionnaire: Quality of life, obesity and dietetics(QOLOD) rating scale. Diabetes Metab 2005; 31(3): 273-283.ArticlePubMed
- 22. Kolotkin RL, Crosby RD. Psychometric evaluation of the impact of weight on quality of life-lite questionnaire(IWQOL-Lite) in a community sample. Qual Life Res 2002; 11(2): 157-171.ArticlePubMedPDF
- 23. Bennett GA. Expectations in the treatment of obesity. Br J Clin Psychol 1986; 25(4): 311-312.ArticlePubMed
REFERENCES
Appendix
Supplement 1


Table 2

Total and subscales of KOQOL1) scores by initial body mass index (BMI)
1) KOQOL: Korean version of obesity-related quality of life : higher score means poorer quality of life
2) Overweight: 23.0 ≤ BMI < 25.0, 3) Obesity I: 25.0 ≤ BMI < 30.0, 4) Obesity II; 30.0 ≤ BMI
5) Mean±SD
ab: Values with different alphabets within each row are significantly different at P=0.05 by Duncan's multiple range test.
*: P < 0.05, **: P < 0.01, ***: P < 0.001
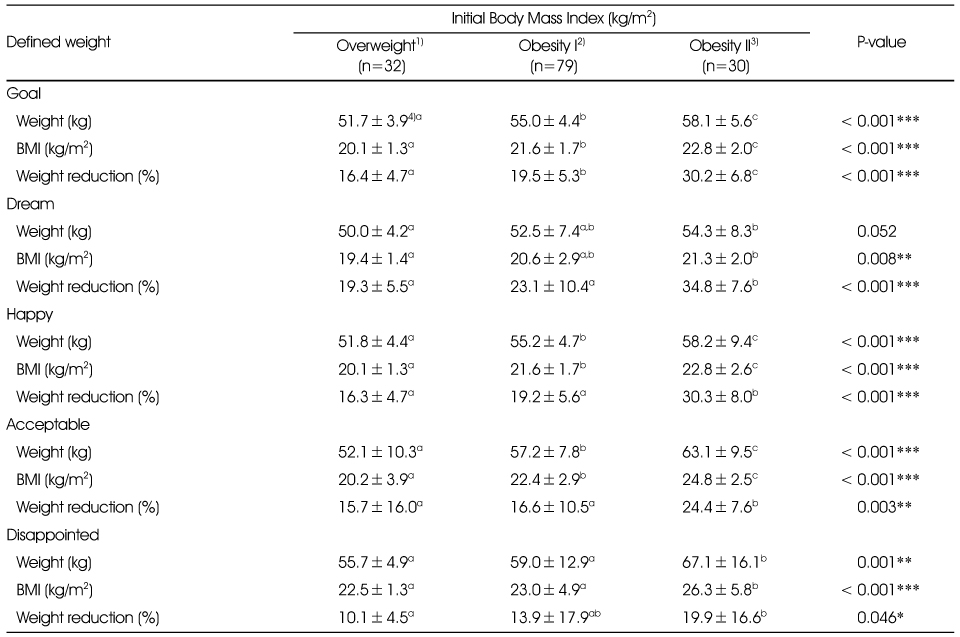

Table 5

Multivariate linear regression analysis with KOQOL1) scores for goal weight reduction(%)
1) KOQOL: Korean version of obesity-related quality of life : higher score means poorer quality of life, Significant difference using Multivariate linear regression analysis adjusted by initial body weight, height, age, marital status, economic status, education.
2) B: unstandardized regression coefficients, 3) SE: standard error, 4) β: standardized regression coefficients, 5) t: the value of the t test
**: P < 0.01
Table 6
Multivariate linear regression analysis with KOQOL1) scores for goal BMI2)
1) KOQOL: Korean version of obesity-related quality of life : higher score means poorer quality of life,
2) BMI: Body mass index, significant difference using Multivariate linear regression analysis adjusted by initial body weight, height, age, marital status, economic status, education.
3) B: unstandardized regression coefficients, 4) SE: standard error, 5) β: standardized regression coefficients, 6) t: the value of the t test
*: P < 0.05
Figure & Data
REFERENCES
Citations
Citations to this article as recorded by 
- Search for Personalized Health and Beauty Care Using DTC Gene Analysis Data
Esther Choi, Myoung-Joo Lee
Journal of the Korean Society of Cosmetology.2025; 31(1): 174. CrossRef - Effect on 12-week Intensive Dietary and Exercise Program on Weight Reduction and Maintenance in Obese Women with Weight Cycling History
Ha Nui Kwon, Sang-Seok Nam, Yoo Kyoung Park
Clinical Nutrition Research.2017; 6(3): 183. CrossRef
 Cite
CiteThe Effect of Obesity-Related Quality of Life on selecting a Goal for Weight Management in Overweight and Obese Patients
The Effect of Obesity-Related Quality of Life on selecting a Goal for Weight Management in Overweight and Obese Patients
General characteristics of the study subjects
1) Overweight: 23.0 ≤ BMI < 25.0, 2) Obesity I: 25.0 ≤ BMI < 30.0, 3) Obesity II: 30.0 ≤ BMI
4) Mean±SD, 5) N (%)
abc: Values with different alphabets within each row are significantly different at P=0.05 by Duncan's multiple range test.
**: P < 0.01, ***: P < 0.001
Total and subscales of KOQOL1) scores by initial body mass index (BMI)
1) KOQOL: Korean version of obesity-related quality of life : higher score means poorer quality of life
2) Overweight: 23.0 ≤ BMI < 25.0, 3) Obesity I: 25.0 ≤ BMI < 30.0, 4) Obesity II; 30.0 ≤ BMI
5) Mean±SD
ab: Values with different alphabets within each row are significantly different at P=0.05 by Duncan's multiple range test.
*: P < 0.05, **: P < 0.01, ***: P < 0.001
Desired body weight by initial body mass index (BMI)
1) Overweight: 23.0 ≤ BMI < 25.0, 2) Obesity I: 25.0 ≤ BMI < 30.0, 3) Obesity II; 30.0 ≤ BMI, 4) Mean±SD
abc: Values with different alphabets with in each row are significantly different at P=0.05 by Duncan's multiple range test.
*: P < 0.05, **: P < 0.01, ***: P < 0.001
Univariate regression analysis with KOQOL1) scores for goal weight reduction and goal BMI2)
1) KOQOL: Korean version of obesity-related quality of life : higher score means poorer quality of life
2) BMI: Body mass index, significant difference using Univariate regression analysis
3) β: standardized regression coefficients
**: P < 0.01
Multivariate linear regression analysis with KOQOL1) scores for goal weight reduction(%)
1) KOQOL: Korean version of obesity-related quality of life : higher score means poorer quality of life, Significant difference using Multivariate linear regression analysis adjusted by initial body weight, height, age, marital status, economic status, education.
2) B: unstandardized regression coefficients, 3) SE: standard error, 4) β: standardized regression coefficients, 5) t: the value of the t test
**: P < 0.01
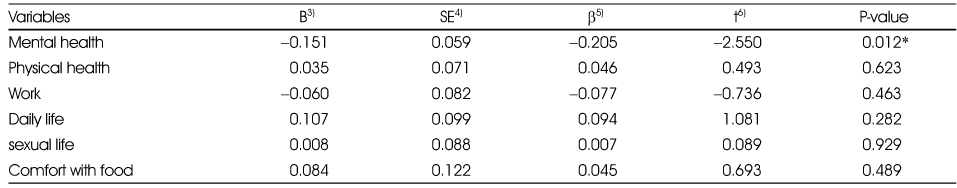
Multivariate linear regression analysis with KOQOL1) scores for goal BMI2)
1) KOQOL: Korean version of obesity-related quality of life : higher score means poorer quality of life,
2) BMI: Body mass index, significant difference using Multivariate linear regression analysis adjusted by initial body weight, height, age, marital status, economic status, education.
3) B: unstandardized regression coefficients, 4) SE: standard error, 5) β: standardized regression coefficients, 6) t: the value of the t test
*: P < 0.05
Table 1
General characteristics of the study subjects
1) Overweight: 23.0 ≤ BMI < 25.0, 2) Obesity I: 25.0 ≤ BMI < 30.0, 3) Obesity II: 30.0 ≤ BMI 4) Mean±SD, 5) N (%) abc: Values with different alphabets within each row are significantly different at P=0.05 by Duncan's multiple range test. **: P < 0.01, ***: P < 0.001
Table 2
Total and subscales of KOQOL1) scores by initial body mass index (BMI)
1) KOQOL: Korean version of obesity-related quality of life : higher score means poorer quality of life 2) Overweight: 23.0 ≤ BMI < 25.0, 3) Obesity I: 25.0 ≤ BMI < 30.0, 4) Obesity II; 30.0 ≤ BMI 5) Mean±SD ab: Values with different alphabets within each row are significantly different at P=0.05 by Duncan's multiple range test. *: P < 0.05, **: P < 0.01, ***: P < 0.001
Table 3
Desired body weight by initial body mass index (BMI)
1) Overweight: 23.0 ≤ BMI < 25.0, 2) Obesity I: 25.0 ≤ BMI < 30.0, 3) Obesity II; 30.0 ≤ BMI, 4) Mean±SD abc: Values with different alphabets with in each row are significantly different at P=0.05 by Duncan's multiple range test. *: P < 0.05, **: P < 0.01, ***: P < 0.001
Table 4
Univariate regression analysis with KOQOL1) scores for goal weight reduction and goal BMI2)
1) KOQOL: Korean version of obesity-related quality of life : higher score means poorer quality of life 2) BMI: Body mass index, significant difference using Univariate regression analysis 3) β: standardized regression coefficients **: P < 0.01
Table 5
Multivariate linear regression analysis with KOQOL1) scores for goal weight reduction(%)
1) KOQOL: Korean version of obesity-related quality of life : higher score means poorer quality of life, Significant difference using Multivariate linear regression analysis adjusted by initial body weight, height, age, marital status, economic status, education. 2) B: unstandardized regression coefficients, 3) SE: standard error, 4) β: standardized regression coefficients, 5) t: the value of the t test **: P < 0.01
Table 6
Multivariate linear regression analysis with KOQOL1) scores for goal BMI2)
1) KOQOL: Korean version of obesity-related quality of life : higher score means poorer quality of life, 2) BMI: Body mass index, significant difference using Multivariate linear regression analysis adjusted by initial body weight, height, age, marital status, economic status, education. 3) B: unstandardized regression coefficients, 4) SE: standard error, 5) β: standardized regression coefficients, 6) t: the value of the t test *: P < 0.05


