Articles
- Page Path
- HOME > Korean J Community Nutr > Volume 20(4); 2015 > Article
-
Research Article
- The Effect of Obesity-Related Quality of Life on selecting a Goal for Weight Management in Overweight and Obese Patients
- Min Young Chun
-
Korean Journal of Community Nutrition 2015;20(4):281-290.
DOI: https://doi.org/10.5720/kjcn.2015.20.4.281
Published online: August 30, 2015
Department of Global Medical Science, Sungshin Women's University, Seoul, Korea.
- Corresponding author: Min Young Chun. Department of Global Medical Science, Sungshin Women's University, 55 Dobong-ro, 76ga-gil, Gangbuk-gu, Seoul 01133, Korea. Tel: (02) 920-7232, Fax: (02) 920-2027, sunrise91@sungshin.ac.kr
Copyright © 2015 The Korean Society of Community Nutrition
This is an Open-Access article distributed under the terms of the Creative Commons Attribution Non-Commercial License (http://creativecommons.org/licenses/by-nc/3.0/) which permits unrestricted non-commercial use, distribution, and reproduction in any medium, provided the original work is properly cited.
- 1,158 Views
- 7 Download
- 2 Crossref
Figure & Data
REFERENCES
Citations

- Search for Personalized Health and Beauty Care Using DTC Gene Analysis Data
Esther Choi, Myoung-Joo Lee
Journal of the Korean Society of Cosmetology.2025; 31(1): 174. CrossRef - Effect on 12-week Intensive Dietary and Exercise Program on Weight Reduction and Maintenance in Obese Women with Weight Cycling History
Ha Nui Kwon, Sang-Seok Nam, Yoo Kyoung Park
Clinical Nutrition Research.2017; 6(3): 183. CrossRef
General characteristics of the study subjects
1) Overweight: 23.0 ≤ BMI < 25.0, 2) Obesity I: 25.0 ≤ BMI < 30.0, 3) Obesity II: 30.0 ≤ BMI
4) Mean±SD, 5) N (%)
abc: Values with different alphabets within each row are significantly different at P=0.05 by Duncan's multiple range test.
**: P < 0.01, ***: P < 0.001
Total and subscales of KOQOL1) scores by initial body mass index (BMI)
1) KOQOL: Korean version of obesity-related quality of life : higher score means poorer quality of life
2) Overweight: 23.0 ≤ BMI < 25.0, 3) Obesity I: 25.0 ≤ BMI < 30.0, 4) Obesity II; 30.0 ≤ BMI
5) Mean±SD
ab: Values with different alphabets within each row are significantly different at P=0.05 by Duncan's multiple range test.
*: P < 0.05, **: P < 0.01, ***: P < 0.001
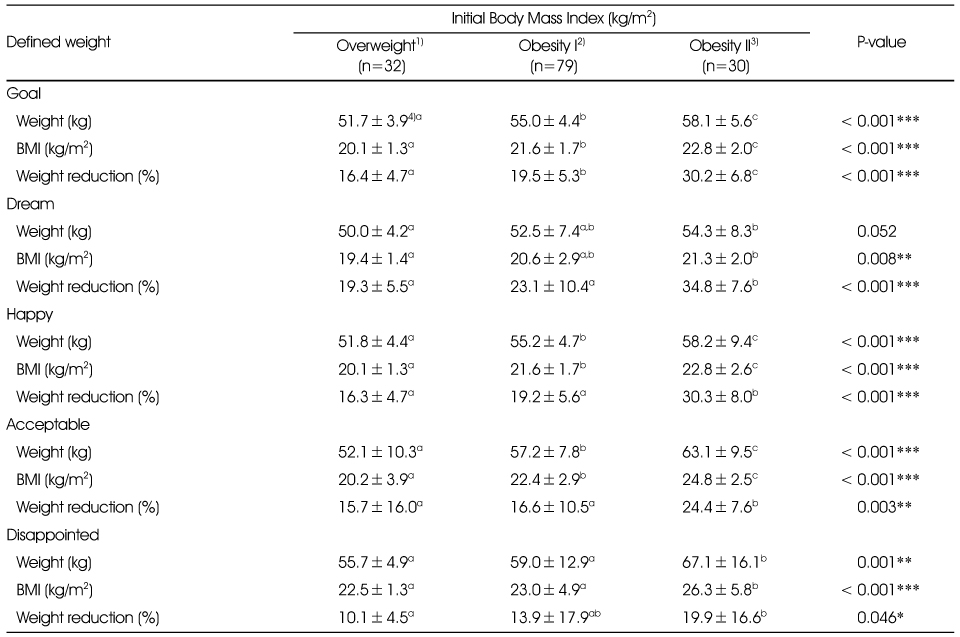
Desired body weight by initial body mass index (BMI)
1) Overweight: 23.0 ≤ BMI < 25.0, 2) Obesity I: 25.0 ≤ BMI < 30.0, 3) Obesity II; 30.0 ≤ BMI, 4) Mean±SD
abc: Values with different alphabets with in each row are significantly different at P=0.05 by Duncan's multiple range test.
*: P < 0.05, **: P < 0.01, ***: P < 0.001
Univariate regression analysis with KOQOL1) scores for goal weight reduction and goal BMI2)
1) KOQOL: Korean version of obesity-related quality of life : higher score means poorer quality of life
2) BMI: Body mass index, significant difference using Univariate regression analysis
3) β: standardized regression coefficients
**: P < 0.01
Multivariate linear regression analysis with KOQOL1) scores for goal weight reduction(%)
1) KOQOL: Korean version of obesity-related quality of life : higher score means poorer quality of life, Significant difference using Multivariate linear regression analysis adjusted by initial body weight, height, age, marital status, economic status, education.
2) B: unstandardized regression coefficients, 3) SE: standard error, 4) β: standardized regression coefficients, 5) t: the value of the t test
**: P < 0.01
Multivariate linear regression analysis with KOQOL1) scores for goal BMI2)
1) KOQOL: Korean version of obesity-related quality of life : higher score means poorer quality of life,
2) BMI: Body mass index, significant difference using Multivariate linear regression analysis adjusted by initial body weight, height, age, marital status, economic status, education.
3) B: unstandardized regression coefficients, 4) SE: standard error, 5) β: standardized regression coefficients, 6) t: the value of the t test
*: P < 0.05
1) Overweight: 23.0 ≤ BMI < 25.0, 2) Obesity I: 25.0 ≤ BMI < 30.0, 3) Obesity II: 30.0 ≤ BMI 4) Mean±SD, 5) N (%) abc: Values with different alphabets within each row are significantly different at P=0.05 by Duncan's multiple range test. **: P < 0.01, ***: P < 0.001
1) KOQOL: Korean version of obesity-related quality of life : higher score means poorer quality of life 2) Overweight: 23.0 ≤ BMI < 25.0, 3) Obesity I: 25.0 ≤ BMI < 30.0, 4) Obesity II; 30.0 ≤ BMI 5) Mean±SD ab: Values with different alphabets within each row are significantly different at P=0.05 by Duncan's multiple range test. *: P < 0.05, **: P < 0.01, ***: P < 0.001
1) Overweight: 23.0 ≤ BMI < 25.0, 2) Obesity I: 25.0 ≤ BMI < 30.0, 3) Obesity II; 30.0 ≤ BMI, 4) Mean±SD abc: Values with different alphabets with in each row are significantly different at P=0.05 by Duncan's multiple range test. *: P < 0.05, **: P < 0.01, ***: P < 0.001
1) KOQOL: Korean version of obesity-related quality of life : higher score means poorer quality of life 2) BMI: Body mass index, significant difference using Univariate regression analysis 3) β: standardized regression coefficients **: P < 0.01
1) KOQOL: Korean version of obesity-related quality of life : higher score means poorer quality of life, Significant difference using Multivariate linear regression analysis adjusted by initial body weight, height, age, marital status, economic status, education. 2) B: unstandardized regression coefficients, 3) SE: standard error, 4) β: standardized regression coefficients, 5) t: the value of the t test **: P < 0.01
1) KOQOL: Korean version of obesity-related quality of life : higher score means poorer quality of life, 2) BMI: Body mass index, significant difference using Multivariate linear regression analysis adjusted by initial body weight, height, age, marital status, economic status, education. 3) B: unstandardized regression coefficients, 4) SE: standard error, 5) β: standardized regression coefficients, 6) t: the value of the t test *: P < 0.05

 KSCN
KSCN


 Cite
Cite


