
Articles
- Page Path
- HOME > Korean J Community Nutr > Volume 19(5); 2014 > Article
-
Research Article
- The Differences in Preference for Vegetables among Primary School to University Students in Gyeongbuk Area
- Yun Kyeong Lee, Youngnam Kim
-
Korean Journal of Community Nutrition 2014;19(5):415-424.
DOI: https://doi.org/10.5720/kjcn.2014.19.5.415
Published online: October 31, 2014
1Gwang Pyeong Middle School, Gyeongbuk, Korea.
2Department of Home Economics Education, Korea National University of Education, Chungbuk, Korea.
- Corresponding author: Youngnam Kim. Department of Home Economics Education, Korea National University of Education, 250 Taeseongtabyeon-ro, Cheongju, Chungbuk 363-791, Korea. Tel: (043) 230-3709, Fax: (043) 231-4087, youngnam@knue.ac.kr
• Received: August 5, 2014 • Revised: October 13, 2014 • Accepted: October 25, 2014
Copyright © 2014 The Korean Society of Community Nutrition
This is an Open-Access article distributed under the terms of the Creative Commons Attribution Non-Commercial License (http://creativecommons.org/licenses/by-nc/3.0/) which permits unrestricted non-commercial use, distribution, and reproduction in any medium, provided the original work is properly cited.
- 1,457 Views
- 3 Download
- 5 Crossref
Abstract
-
Objectives
- Vegetables are the most left over side dishes in school lunch programs. This study intended to analyze the differences in preference for vegetables among the students of different age groups in order to determine potential ways of increasing vegetable consumption in this study group.
-
Methods
- A total of 308 primary to university students in Gyeongbuk area were recruited and a questionnaire-based survey was conducted. The preference score (7-Likert scale: very much dislike (1)~so-so (4)~like very much (7)) and intake frequency (5-Likert scale) of 48 kinds of vegetables in 4 vegetable groups, such as vegetable (fruit-, root-, leaf-, and stalk- vegetable), seaweeds, mushrooms, and kimchi were investigated, and data were analyzed by SPSS WIN (ver 12.0).
-
Results
- The preference scores of vegetables except for seaweeds were significantly different among school groups, university was the highest, followed by high school. Primary and middle school students showed the lowest preference score, especially for leaf- and stalk- vegetables. The preference score for seaweeds was the highest of 5.28, followed by kimchi of 4.99. With regard to kimchis, the preference score was the highest in university', followed by high school, middle school, and primary school' was the lowest. The number of vegetables with < 4.0 preference score was the highest in primary school of 16, 15 in middle school, 11 in high school, and 7, the lowest in university. The vegetable with preference score of < 4.0 in all 4 school groups were mallow, chard, bud, radish leaf, mugwort, butterbur and sweet potato stalk. With regard to the intake frequency of vegetables, kimchis, an indispensable part of the Korean diet, was the highest of 2 times/day, followed by cooked vegetables of 1.5 times/day. The correlation coefficients between preference scores and intake frequencies were statistically significant in all groups of vegetables. As for the coefficient of variation (CV) of preference score, primary school' was the highest and university' was the lowest. The number of vegetables with high CV and high inexperience were highest in primary school students.
-
Conclusions
- Providing more opportunities for consuming a variety of vegetables, such as leaf- and stalk- vegetable, it may be possible to increase vegetable consumption, especially for the primary school students.
- 1. Ahn YK, Ro HK. A survey on preferences for vegetable cooking methods and vegetable-aversion-related factors among elementary school students in Kwangju and Chonnam regions. Korean J Community Nutr 2009; 14(5): 531-544.
- 2. Baek JY, Kim HY. Vegetable eating behavior and preference of elementary school students by stage of change for vegetable intake. Korean J Food Cult 2009; 24(2): 146-154.
- 3. Cheong HS. A study on the relationship between nutrition knowledge and food habit of mothers and food preference and other factors of their elementary school children. J Korean Home Econ Assoc 1995; 33(3): 207-223.
- 4. Choi NR. Study on consumption status and preference level for vegetables. Sookmyung Women's University; 2007; 39-41 Dissertation.
- 5. Chung S. Preference and intake of vegetables among high school students in Daegu. Keimyung University; 2012; 20-30 Dissertation.
- 6. Hong JH, Cho MS. Acceptance of vegetable menus of a school lunch program by high school students in Seoul and its association with health and dietary behavioral factors. Korean J Food Sci Technol 2012; 44(1): 121-134.Article
- 7. Jang MA, Choi MJ. Satisfaction with school food service of middle school students in Daegu. J East Asian Soc Diet Life 2005; 15(2): 226-234.
- 8. Kim HH, Kim Y. A preference analysis of vegetable group foods in primary school students and their mothers. J Korean Home Econ Educ Assoc 2012; 24(3): 73-88.
- 9. Kim KA, Kim EY, Jung LH, Jeon ER. A survey of the management of elementary school foodservice - II. Satisfaction of food service and food preferences of the elementary school students in the Kwangju & Chonnam area -. Korean J Soc Food Sci 1999; 15(3): 272-287.
- 10. Kim KA, Kim SJ, Jeong NH, Jeon ER. Meal preference on the school food service of middle school students in Gwangju and Chollanamdo area. Korean J Soc Food Cookery Sci 2003; 19(2): 144-154.
- 11. Kim SJ. Vegetable intakes and preferences of elementary school students living in Incheon. Inha University; 2012; 1-2. 21-25 Dissertation.
- 12. Koo JO, Lim HS, Chung YJ, Yoon JS, Lee AR, Lee JH. Understanding basic nutrition. Seoul: Power book; 2011. p. 61-62.
- 13. Kweon NS, Koh BK. Dietary behaviors and vegetable intakes of elementary school students at Daegu and Gyeong-Sang Buk Do. Korean J Food Cookery Sci 2005; 21(4): 496-504.
- 14. Lee KA, Jeong BY, Moon SK, Kim IS, Nakajima S, Nakamura S. Comparisons of Korean and Japanese college students' eating habits and food preferences. J Korean Soc Food Sci Nutr 2010; 39(11): 1619-1626.Article
- 15. Lee YK, Kim Y. Comparisons of consumption attitude toward vegetables and fragrance vegetables preference among primary school to university students in Gyeongbuk area. Korean J Community Nutr 2014; 19(3): 223-230.Article
- 16. Ministry of Health and Welfare. The third Development Strategies for the National Health Plan (2011~2020). 2011; cited May 1, 2013]. Available from http://www.mw.go.kr.
- 17. Ministry of Health and Welfare. Dietary guidelines for Koreans. 2009; cited May 1, 2013]. Available from http://www.hp.go.kr.
- 18. Ministry of Health and Welfare, Korea Centers for Disease Control and Prevention. Korea Health Statistics 2011: Korea National Health and Nutrition Examination Survey (KNHANES V-2). 2012; cited May 1, 2013]. Available from http://knhanes.cdc.go.kr.
- 19. Ministry of Health and Welfare, The Korean Nutrition Society, Korea Food and Drug Administration. Dietary reference intakes for Koreans. 1st revision. Seoul: The Korean Nutrition Society; 2010. p. 532-534.
- 20. Park SH, Kim MJ. Acceptance and preference of vegetables in menus for middle school students. J Korean Soc Food Sci Nutr 2008; 37(12): 1660-1666.Article
- 21. Yoo JY, Kim HY. A study on the preference and acceptance of vegetables in menus for primary school students. J Table Food Coord 2012; 7(1): 1-14.
REFERENCES
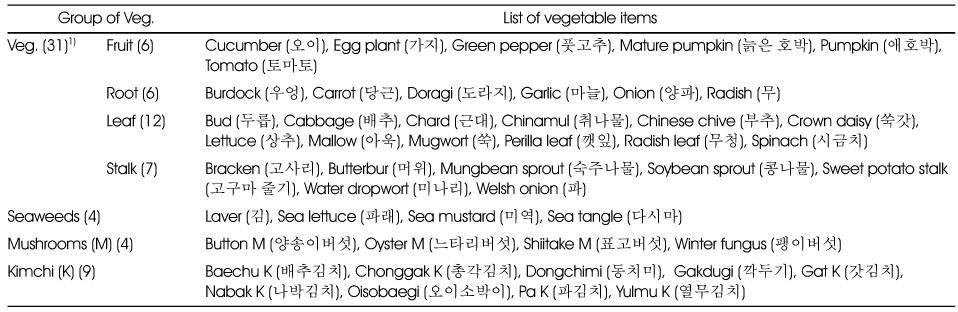


Table 5Vegetable with significant difference in preference score,1) by school group

1) 7-point Likert scale (1: very much dislike ~ 4: so-so ~ 7: like very much)
2) Mean ± SD
3) N of vegetables with sig. difference/Total N of vegetables investigated
*: p < 0.05, **: p < 0.01, ***: p < 0.001 by F-test
abc: Different letters in the same row represent statistical differences by Duncan's multiple range test
Table 6Seaweeds, mushrooms, and kimchis with significant difference in preference score1) by school group

1) 7-point Likert scale (1: very much dislike ~ 4: so-so ~ 7: like very much)
2) Mean ± SD
3) N of vegetables with sig. difference/Total N of vegetables investigated
*: p < 0.05, **: p < 0.01, ***: p < 0.001 by F-test
abc: Different letters in the same row represent statistical differences by Duncan's multiple range test


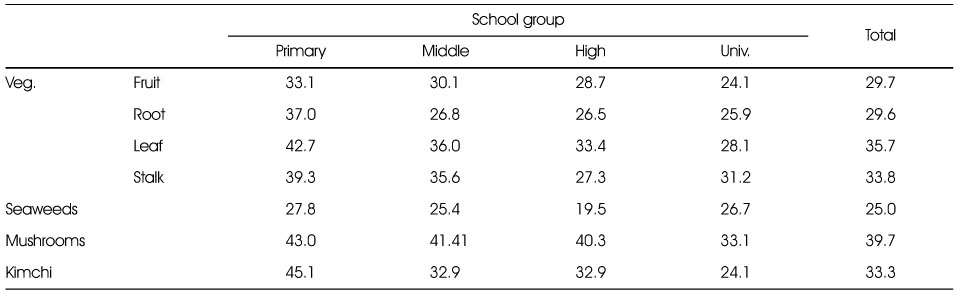

Figure & Data
REFERENCES
Citations
Citations to this article as recorded by 
- Dietary Lifestyle Status of Adolescents: Analysis of Large-Scale Survey Data in Korea
Soo Jin Lee, Ho Kyung Ryu
Journal of the Korean Society of Food Science and Nutrition.2021; 50(1): 95. CrossRef - Analysis of the Dietary Life of Adolescents by Household Types in Korea using the Korea National Health and Nutrition Examination Survey
Soo Jin Lee, Ho Kyung Ryu
The Korean Journal of Community Living Science.2021; 32(2): 285. CrossRef - Consumption Status of Foods Using Kimchi by Korean Adults: Analysis of the 2015 Korea National Health and Nutrition Examination Survey
Mi-Kyung Choi
Korean Journal of Food and Cookery Science.2018; 34(3): 319. CrossRef - Study on Perception and Preference of Vegetable Intake of Alienated Children in Gyeongbuk Area according to Gender and Grade
Won-Hui Choe, Eun-Soon Lyu, Kyung-A Lee
Korean Journal of Food and Cookery Science.2018; 34(4): 394. CrossRef - The Development of Institutional Food-Service Menu with Temple Food
Sim-Yeol Lee, Jin-A Kim
Korean Journal of Community Nutrition.2015; 20(5): 338. CrossRef
 Cite
CiteThe Differences in Preference for Vegetables among Primary School to University Students in Gyeongbuk Area
The Differences in Preference for Vegetables among Primary School to University Students in Gyeongbuk Area
List of vegetables investigated
1) Total N of vegetables investigated
Composition of the study subjects
1) N (%)
Preference score1) comparison of vegetables by school group
1) 7-point Likert scale (1: very much dislike ~ 4: so-so ~ 7: like very much)
2) Total N of vegetables investigated
3) Mean ± SD
*: p < 0.05, **: p < 0.01, ***: p < 0.001 by F-test
abc: Different letters in the same row represent statistical differences by Duncan's multiple range test
List of vegetables with preference score less than 4.01) by school group
1) 7-point Likert scale(1: very much dislike~4: so-so~7: like very much)
2) Total N of vegetables investigated
Listing order: Preference score of low to high
Vegetable with significant difference in preference score,1) by school group
1) 7-point Likert scale (1: very much dislike ~ 4: so-so ~ 7: like very much)
2) Mean ± SD
3) N of vegetables with sig. difference/Total N of vegetables investigated
*: p < 0.05, **: p < 0.01, ***: p < 0.001 by F-test
abc: Different letters in the same row represent statistical differences by Duncan's multiple range test
Seaweeds, mushrooms, and kimchis with significant difference in preference score1) by school group
1) 7-point Likert scale (1: very much dislike ~ 4: so-so ~ 7: like very much)
2) Mean ± SD
3) N of vegetables with sig. difference/Total N of vegetables investigated
*: p < 0.05, **: p < 0.01, ***: p < 0.001 by F-test
abc: Different letters in the same row represent statistical differences by Duncan's multiple range test
Intake frequency score1) difference of vegetables by school group
1) N of intake/day
2) Mean ± SD,
*: p < 0.05, **: p < 0.01 by F-test
ab: Different letters in the same row represent statistical differences by Duncan's multiple range test
Correlation coefficient between preference score and intake frequency of vegetables
*: p < 0.05, **: p < 0.01 by Pearson's correlation
CV1) of the vegetable food groups' preference score
1) Coefficient of variation
Vegetables with more than 10% of inexperience intake ratio
1) N (%)
Table 1
List of vegetables investigated
1) Total N of vegetables investigated
Table 2
Composition of the study subjects
1) N (%)
Table 3
Preference score1) comparison of vegetables by school group
1) 7-point Likert scale (1: very much dislike ~ 4: so-so ~ 7: like very much) 2) Total N of vegetables investigated 3) Mean ± SD *: p < 0.05, **: p < 0.01, ***: p < 0.001 by F-test abc: Different letters in the same row represent statistical differences by Duncan's multiple range test
Table 4
List of vegetables with preference score less than 4.01) by school group
1) 7-point Likert scale(1: very much dislike~4: so-so~7: like very much) 2) Total N of vegetables investigated Listing order: Preference score of low to high
Table 5
Vegetable with significant difference in preference score,1) by school group
1) 7-point Likert scale (1: very much dislike ~ 4: so-so ~ 7: like very much) 2) Mean ± SD 3) N of vegetables with sig. difference/Total N of vegetables investigated *: p < 0.05, **: p < 0.01, ***: p < 0.001 by F-test abc: Different letters in the same row represent statistical differences by Duncan's multiple range test
Table 6
Seaweeds, mushrooms, and kimchis with significant difference in preference score1) by school group
1) 7-point Likert scale (1: very much dislike ~ 4: so-so ~ 7: like very much) 2) Mean ± SD 3) N of vegetables with sig. difference/Total N of vegetables investigated *: p < 0.05, **: p < 0.01, ***: p < 0.001 by F-test abc: Different letters in the same row represent statistical differences by Duncan's multiple range test
Table 7
Intake frequency score1) difference of vegetables by school group
1) N of intake/day 2) Mean ± SD, *: p < 0.05, **: p < 0.01 by F-test ab: Different letters in the same row represent statistical differences by Duncan's multiple range test
Table 8
Correlation coefficient between preference score and intake frequency of vegetables
*: p < 0.05, **: p < 0.01 by Pearson's correlation
Table 9
CV1) of the vegetable food groups' preference score
1) Coefficient of variation
Table 10
Vegetables with more than 10% of inexperience intake ratio
1) N (%)


