
Articles
- Page Path
- HOME > Korean J Community Nutr > Volume 29(2); 2024 > Article
-
Research Article
- Exploring factors of nutrition teachers’ intentions for sustainable dietary education in South Korea: an application of the theory of planned behavior
-
Eunseo Yang1)
 , Borham Yoon2),†
 -
Korean Journal of Community Nutrition 2024;29(2):114-128.
DOI: https://doi.org/10.5720/kjcn.2024.29.2.114
Published online: April 24, 2024
1)Graduate Student, Major in Nutrition Education, Sunchon National University, Suncheon, Korea
2)Professor, Department of Food Science and Nutrition, Sunchon National University, Suncheon, Korea
- †Corresponding author: Borham Yoon Department of Food and Nutrition, Sunchon National University, 255 Jungang-ro, Suncheon 57922, Korea. Tel: +82-61-750-3658 Fax: +82-61-750-3650 Email: byoon@scnu.ac.kr
• Received: February 2, 2024 • Revised: April 1, 2024 • Accepted: April 8, 2024
© 2024 The Korean Society of Community Nutrition
This is an Open-Access article distributed under the terms of the Creative Commons Attribution Non-Commercial License (http://creativecommons.org/licenses/by-nc/4.0) which permits unrestricted non-commercial use, distribution, and reproduction in any medium, provided the original work is properly cited.
- 2,402 Views
- 60 Download
- 3 Crossref
Abstract
-
Objectives
- The purpose of this study was to investigate the perception of nutrition teachers and the factors influencing their intention toward sustainable dietary education utilizing the theory of planned behavior (TPB).
-
Methods
- The self-administered online survey was completed by nutrition teachers in Jeollanam-do, South Korea. A total of 151 valid questionnaires were analyzed. Factor analysis and multiple regressions were employed to test the research model.
-
Results
- The study findings demonstrated that all TPB variables significantly influenced the sustainable dietary educational intention, with the degree of influence ranking as follows: external perceived behavioral control (β = 0.417), attitude (β = 0.240), internal perceived behavioral control (β = 0.207), and subjective norms (β = 0.181). For external perceived behavioral control, nutrition teachers and elementary schools exhibited higher levels compared to dietitians and middle/high schools, respectively. The participants in sustainable dietary education training programs exhibited a higher level of internal perceived behavioral control compared to those who did not participate. The highest perception levels were reported for attitude (4.26), followed by subjective norms (4.02), internal perceived behavioral control (3.67), and external perceived behavioral control (3.20).
-
Conclusions
- This study affirmed that the TPB variables elucidated the sustainable dietary educational intentions of nutrition teachers. The significant impacts of external and internal perceived behavioral control, attitude, and subjective norms on educational intentions were confirmed. Consequently, proactive support from schools and governments is essential to enhance the facilitating factors and mitigate the barriers toward sustainable dietary education in schools.
INTRODUCTION
METHODS
1) Study model and variables
2) Development of the questionnaire
3) Questionnaire items
RESULTS
DISCUSSION
CONCLUSIONS
-
Conflict of Interest
There are no financial or other issues that might lead to conflict of interest.
-
Data Availability
The participants of this study did not give written consent for their data to be shared publicly, so due to the sensitive nature of the research supporting data is not available.
NOTES
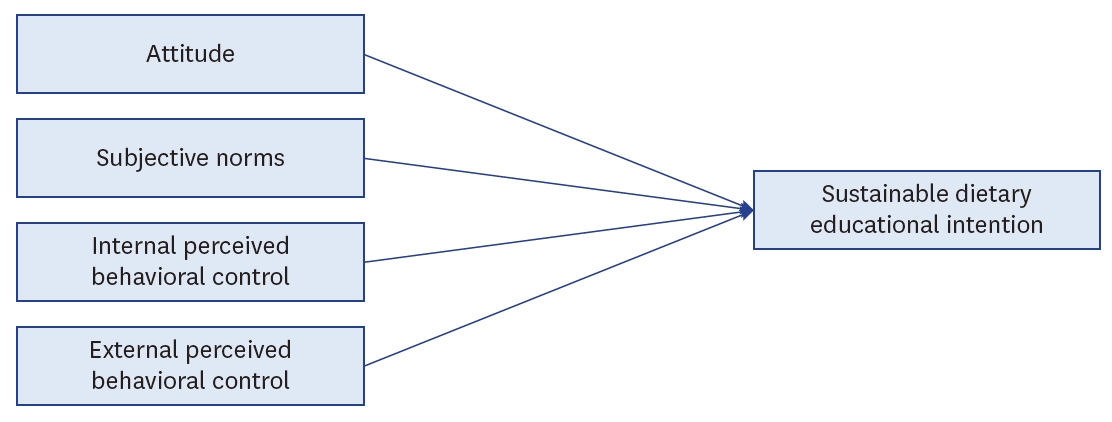
Table 1.General characteristics of the participants (n = 151)
Table 2.Exploratory factor analysis of the theory of planned behavior variables
Table 3.Regression analysis for factors influencing educational intention
| Variables | Unstandardized B | SE | Standardized β | t |
|---|---|---|---|---|
| (Constant) | −0.141 | 0.267 | −0.528 | |
| A | 0.288 | 0.066 | 0.240 | 4.365*** |
| SN | 0.202 | 0.069 | 0.181 | 2.927* |
| IPBC | 0.214 | 0.064 | 0.207 | 3.331** |
| EPBC | 0.319 | 0.047 | 0.417 | 6.867*** |
| F | 81.105 | |||
| P-value | < 0.001 | |||
| Adjusted R2 | 0.681 | |||
| Durbin-Watson | 1.977 | |||
Table 4.Internal perceived behavioral control by general characteristics of the participants
| Variables | IPBC |
|---|---|
| Participation in training programs | |
| Participant | 3.79 ± 0.98 |
| Non-participant | 3.45 ± 0.95 |
| t-value | 2.036* |
Table 5.External perceived behavioral control by general characteristics of the participants
| Variables | EPBC |
|---|---|
| Occupation | |
| Nutrition teacher | 3.36 ± 1.26 |
| Dietitian | 2.54 ± 1.43 |
| t-value | 3.046* |
| School level | |
| Elementary school | 3.45 ± 1.27 |
| Middle/high school | 2.65 ± 1.31 |
| t-value | 3.561*** |
| Number of meals served (per day) | |
| 1 | 3.32 ± 1.30 |
| ≥ 2 | 2.67 ± 1.35 |
| t-value | 2.338* |
- 1. Intergovernmental Panel on Climate Change (IPCC). Climate change 2023: synthesis report [Internet]. IPCC; 2023 [updated 2023; cited 2023 Apr 4]. Available from: https://www.ipcc.ch/report/ar6/syr/downloads/report/IPCC_AR6_SYR_SPM.pdf
- 2. Kang MJ, Lee SH, Kim YT, Lee SW. The development and application of ESD education program on sustainable development goals 1-4 area. Korean J Elementary Educ 2018; 29(1): 81-99.
- 3. Lee KA. Exploring the necessity and practical tasks of dietary education in food plans. J Korean Pract Arts Educ Res 2020; 26(1): 51-72.Article
- 4. Ministry of Agriculture, Food and Rural Affairs. 3rd ('20~'24) basic plan for dietary education [Internet]. Ministry of Agriculture, Food and Rural Affairs; 2020 [updated 2020 Jan; cited 2023 Nov 23]. Available from: https://www.mafra.go.kr/home/5109/subview.do?enc=Zm5jdDF8QEB8JTJGYmJzJTJGaG9tZSUyRjc5MiUyRjU2MTg3MSUyRmFydGNsVmlldy5kbyUzRg%3D%3D
- 5. Nam YM, Kana A, Yoon JH. Comparison of the sustainable dietary policy among countries - focusing on France, the UK, the USA, and Japan -. Korean J Community Living Sci 2019; 2019(4): 75-75.
- 6. Kwon HI, Lee YM. The effect of the gardening activity program for sustainable eating education on infants’ sustainable eating capacity and environmentally friendly attitudes. Early Child Educ Res Rev 2023; 27(3): 101-127.Article
- 7. Oh YJ, Min JY, Ryu HW, Cho KS. Development and application of low-carbon environmental education program using food mileage and plant factory. J Korean Soc Environ Educ 2016; 29(4): 400-411.Article
- 8. Kim SR, Yu KH, Kim MJ, Ly SY. Effects of vegetable-focused nutrition education on improving nutrition knowledge and dietary habits in young Children. Korean J Hum Ecol 2023; 32(5): 665-678.Article
- 9. Han HM, Lee SS. A nutrition education program development and the application for the elementary students - focused on sugar intake education -. J Korean Pract Arts Educ 2008; 21(2): 111-131.
- 10. Yoo HR, Kim KS. The effect of character education activities based on green diet on children’s perception of life respect, community spirit and caring behavior. J Korea Open Assoc Early Child Educ 2018; 23(6): 29-54.Article
- 11. Woo TJ, Lee KH. Development of a sensory education textbook and teaching guidebook for preference improvement toward traditional Korean foods in schoolchildren. Korean J Nutr 2011; 44(4): 303-311.Article
- 12. Jeollanamdo Office of Education. Basic plan for school meals [Internet]. Jeollanamdo Office of Education; 2023 [updated 2023 Jan 30; cited 2023 Dec 22]. Available from: https://www.jne.go.kr/sse/na/ntt/selectNttInfo.do?mi=794&bbsId=454&nttSn=5055200#none
- 13. Ministry of Government Legislation. Enforcement degree of the school meals act [Internet]. Ministry of Government Legislation; 2023 [updated 2023 Apr 25; cited 2023 Dec]. Available from: https://www.law.go.kr/lsSc.do?menuId=1&subMenuId=15&query=%ED%95%99%EA%B5%90%EA%B8%89%EC%8B%9D%EB%B2%95%20%EC%8B%9C%ED%96%89%EB%A0%B9&dt=20201211#undefined
- 14. Chung MJ. Factors influencing the sustainable practices in school food service operations - an application of the extended theory of the planned behavior model -. Korean J Food Nutr 2021; 34(2): 242-253.
- 15. Lee NY. Dietitians’ self-evaluation and barriers to sustainable practices for school foodservice management - focused on Daejeon and Chungnam area -. Korean J Food Cook Sci 2017; 33(3): 342-352.Article
- 16. Park SH. Awareness and operation status about green meal service in school nutrition teachers at Seoul area [master's thesis]. Kookmin University; 2021.
- 17. Ajzen I. The theory of planned behavior. Organ Behav Hum Decis Process 1991; 50(2): 179-211.Article
- 18. Bang HW, Kim MJ. A study on application validity of the theory of planned behavior including perceived behavior control to the international tourism study. J Hosp Tour Stud 2020; 22(2): 35-48.Article
- 19. Kim WB, An JY, Um JB. A study of consumers’ intentions to purchase alternative meats using the theory of planned behavior. J Agric Ext Community Dev 2023; 30(3): 143-155.
- 20. Liu AN, Lee SW, Hwang JY. Factors related to the short-term and long-term intentions of healthy eating among Chinese adults living in Shanghai and parts of Anhui Province of China using the theory of planned behavior. J Nutr Health 2022; 55(1): 188-199.ArticleLink
- 21. Shin EM, Kim KW. Psychosocial factors related to dairy product consumption among female university students in Daejeon. Korean J Community Nutr 2003; 8(6): 867-875.
- 22. Kidwell B, Jewell RD. An examination of perceived behavioral control: internal and external influences on intention. Psychol Mark 2003; 20(7): 625-642.Article
- 23. Jong HS. The relationship analysis of the actual condition of nutrition education, job satisfaction and teacher efficacy of nutrition teacher in Gangwon province [master's thesis]. Sangji University; 2019.
- 24. Armitage CJ, Conner M. Distinguishing perceptions of control from self-efficacy: predicting consumption of a low-fat diet using the theory of planned behavior. J Appl Soc Psychol 1999; 29(1): 72-90.
- 25. Ajzen I. Perceived behavioral control, self-efficacy, locus of control, and the theory of planned behavior. J Appl Soc Psychol 2002; 32(4): 665-683.
- 26. Park ES. Operation and training demand on dietary life education of nutrition teachers in Jeonbuk province. Korean J Hum Ecol 2014; 23(1): 149-161.Article
- 27. Oh YY. Understanding and predicting elementary teachers’ intention to change in mathematics instruction. J Educ Res Math 2003; 13(3): 267-286.
- 28. Choi JS, Yim SY. Factors influencing primary school teachers’ reading strategy instruction in social studies classes: applying the theory of planned behavior. J Korean Assn Learn Cent Curric Instr 2021; 21(3): 1031-1049.
- 29. Yu SY. School dietitian’s job satisfaction, job importance and education needs at college level according to the school levels in Sejong [master's thesis]. Kongju National University; 2021.
REFERENCES
Figure & Data
REFERENCES
Citations
Citations to this article as recorded by 
- Perceptions of Sustainable Dietary Practices : A Comparison Between Food and Nutrition Professionals and Food-Related Major Students in South Korea
Eunseo Yang, Borham Yoon
Journal of the East Asian Society of Dietary Life.2026; 36(1): 13. CrossRef - Behavioral intention toward planetary health diet among adult users of government worksite cafeterias in Seoul, South Korea: a mixed-methods study based on the theory of planned behavior and focus groups interviews
Ji-Won Kang, Su-Jin Lee, Sil-Ah Kim, Ji-Yun Hwang
Korean Journal of Community Nutrition.2025; 30(3): 224. CrossRef - An educational needs analysis of sustainable dietary education for nutrition teachers: an application of the IPA, Borich needs assessment and The locus for focus model
Eunseo Yang, Borham Yoon
Korean Journal of Community Nutrition.2024; 29(5): 372. CrossRef
 Cite
CiteExploring factors of nutrition teachers’ intentions for sustainable dietary education in South Korea: an application of the theory of planned behavior

Fig. 1. Research model.
Fig. 1.
Exploring factors of nutrition teachers’ intentions for sustainable dietary education in South Korea: an application of the theory of planned behavior
| Variables | Description | Frequency |
|---|---|---|
| Individual | ||
| Sex | Male | 1 (0.7) |
| Female | 150 (99.3) | |
| Age (year) | ≤ 29 | 22 (14.6) |
| 30–39 | 22 (14.6) | |
| 40–49 | 31 (20.5) | |
| ≥ 50 | 76 (50.3) | |
| Educational attainment | 2-year college | 7 (4.6) |
| 4-year university | 71 (47.0) | |
| Graduate school | 73 (48.4) | |
| Occupation | Nutrition teacher | 122 (80.8) |
| Dietitian | 29 (19.2) | |
| School | ||
| School level | Elementary school | 104 (68.9) |
| Middle/high school | 47 (31.1) | |
| Number of students(per meal) | ≤ 99 | 50 (33.1) |
| 100–299 | 44 (29.1) | |
| 300–499 | 21 (13.9) | |
| ≥ 500 | 36 (23.9) | |
| Number of meals served (per day) | 1 | 124 (82.1) |
| ≥ 2 | 27 (17.9) | |
| Sustainable dietary education | ||
| Frequency of sustainable dietary education lectures delivered (per year) | ≤ 5 | 63 (41.7) |
| 6–10 | 38 (25.2) | |
| 11–15 | 20 (13.2) | |
| 16–20 | 16 (10.6) | |
| ≥ 21 | 14 (9.3) | |
| Participation in training programs | Participant | 99 (65.6) |
| Non-participant | 52 (34.4) |
| Variables | Perception | Factor loading | Eigen value | Variance (%) | |
|---|---|---|---|---|---|
| I think it is __________ to carry out sustainable dietary education at school (α = 0.916). | 7.614 | 47.859 | |||
| A1 | rewarding | 4.40 ± 0.92 | 0.865 | ||
| A2 | wise | 4.32 ± 1.04 | 0.840 | ||
| A3 | exciting | 4.11 ± 1.03 | 0.816 | ||
| A4 | useful | 4.52 ± 0.82 | 0.807 | ||
| A5 | enjoyable | 3.96 ± 1.08 | 0.805 | ||
| ___________ would want me to carry out sustainable dietary education (α = 0.898). | 1.343 | 8.391 | |||
| SN1 | Kitchen staffs | 3.75 ± 1.18 | 0.832 | ||
| SN2 | Other nutrition teachers and dietitians | 4.17 ± 1.01 | 0.788 | ||
| SN3 | Students and their parents | 3.97 ± 1.06 | 0.786 | ||
| SN4 | My colleagues (principals/general teacher) | 4.18 ± 0.90 | 0.771 | ||
| I have a ___________ of sustainable dietary education (α = 0.892). | 1.126 | 7.038 | |||
| IPBC1 | knowledge | 3.66 ± 1.05 | 0.865 | ||
| IPBC2 | teaching skill | 3.48 ± 1.17 | 0.839 | ||
| IPBC3 | confidence | 3.87 ± 1.02 | 0.719 | ||
| I have a __________ of sustainable dietary education (α = 0.887). | 2.375 | 14.844 | |||
| EPBC1 | place (classroom, cooking room) | 3.46 ± 1.45 | 0.866 | ||
| EPBC2 | time | 3.51 ± 1.48 | 0.854 | ||
| EPBC3 | budget (cost of making educational material) | 2.78 ± 1.62 | 0.777 | ||
| EPBC4 | standardized educational material | 3.05 ± 1.58 | 0.687 | ||
| Total variance | 77.862 | ||||
| Variables | Unstandardized B | SE | Standardized β | t |
|---|---|---|---|---|
| (Constant) | −0.141 | 0.267 | −0.528 | |
| A | 0.288 | 0.066 | 0.240 | 4.365 |
| SN | 0.202 | 0.069 | 0.181 | 2.927 |
| IPBC | 0.214 | 0.064 | 0.207 | 3.331 |
| EPBC | 0.319 | 0.047 | 0.417 | 6.867 |
| F | 81.105 | |||
| P-value | < 0.001 | |||
| Adjusted R2 | 0.681 | |||
| Durbin-Watson | 1.977 | |||
| Variables | IPBC |
|---|---|
| Participation in training programs | |
| Participant | 3.79 ± 0.98 |
| Non-participant | 3.45 ± 0.95 |
| t-value | 2.036 |
| Variables | EPBC |
|---|---|
| Occupation | |
| Nutrition teacher | 3.36 ± 1.26 |
| Dietitian | 2.54 ± 1.43 |
| t-value | 3.046 |
| School level | |
| Elementary school | 3.45 ± 1.27 |
| Middle/high school | 2.65 ± 1.31 |
| t-value | 3.561 |
| Number of meals served (per day) | |
| 1 | 3.32 ± 1.30 |
| ≥ 2 | 2.67 ± 1.35 |
| t-value | 2.338 |
Table 1. General characteristics of the participants (n = 151)
n (%).
Table 2. Exploratory factor analysis of the theory of planned behavior variables
Mean ± SD. A, attitude; SN, subjective norms; IPBC, internal perceived behavioral control; EPBC, external perceived behavioral control.
Table 3. Regression analysis for factors influencing educational intention
A, attitude; SN, subjective norms; IPBC, internal perceived behavioral control; EPBC, external perceived behavioral control.
Table 4. Internal perceived behavioral control by general characteristics of the participants
Mean ± SD. IPBC, internal perceived behavioral control.
Table 5. External perceived behavioral control by general characteristics of the participants
Mean ± SD. EPBC, external perceived behavioral control.


