
Articles
- Page Path
- HOME > Korean J Community Nutr > Volume 30(1); 2025 > Article
-
Research Article
- Food and nutrient intake in pregnant women with singletons or multiples and post-delivery changes in intake in Korea: an observational study
-
Cheawon Lee1),*
 , Dahyeon Kim1),*, Yoon Ha Kim2), Myeong Gyun Choi2), Jong Woon Kim2), Clara Yongjoo Park3),†
 -
Korean Journal of Community Nutrition 2025;30(1):1-15.
DOI: https://doi.org/10.5720/kjcn.2024.00325
Published online: February 28, 2025
1)Graduate Student, Department of Food and Nutrition, Chonnam National University, Gwangju, Korea
2)Professor, Department of Obstetrics and Gynecology, Chonnam National University Medical School, Korea
3)Professor, Department of Food and Nutrition, Chonnam National University, Gwangju, Korea
- †Corresponding author: Clara Yongjoo Park Department of Food and Nutrition, Chonnam National University, 77 Yongbong-ro, Buk-gu, Gwangju 61186, Korea Tel: +82-62-530-1354 Fax: +82-62-530-1339 Email: parkcy@jnu.ac.kr
• Received: December 5, 2024 • Revised: February 7, 2025 • Accepted: February 11, 2025
© 2025 The Korean Society of Community Nutrition
This is an Open-Access article distributed under the terms of the Creative Commons Attribution Non-Commercial License (http://creativecommons.org/licenses/by-nc/4.0) which permits unrestricted non-commercial use, distribution, and reproduction in any medium, provided the original work is properly cited.
- 8,578 Views
- 83 Download
- 2 Crossref
Abstract
-
Objectives
- Nutrient intake during pregnancy and lactation is crucial for the health of both mother and offspring. Diet and nutrient metabolism potentially vary according to ethnicity and fetal number; nevertheless, recent studies validating this are inadequate. Furthermore, few studies have tracked changes in intake after delivery. We compared the food and nutrient intakes between pregnant women in Korea carrying singletons and multiples during late pregnancy and assessed their changes through postpartum.
-
Methods
- Ninety-eight pregnant women were recruited from Chonnam National University Hospital between January 2019 and December 2023, and 48 responded to follow-up. Third trimester and postpartum intake were assessed via food frequency questionnaires and supplement questionnaires. Student’s t-test, Mann–Whitney U test, chi-square test, paired t-test or Wilcoxon signed-rank test was performed and adjustments were made for covariates.
-
Results
- Nutrient intake was generally adequate relative to the Dietary Reference Intakes for Koreans, with no differences between singleton- and multiple-pregnancy women. Sixty-six of 98 (67%) pregnant women consumed meat, fish, vegetables, and fruit daily. Dairy intake was low, while the mean iron intake during pregnancy reached 54.2 ± 34.0 mg/d, exceeding the tolerable upper intake level, mainly owing to supplements. Postpartum fruit and vitamin C intake decreased, with no significant differences between breastfeeding and non-breastfeeding women.
-
Conclusion
- Dietary intake did not significantly differ between Korean singleton- and multiple-pregnancy women. Dairy intake was low and iron intake was excessive. Fruit intake decreased after delivery; however, difference in dietary intake according to breastfeeding status was minimal. Nutritional education may be necessary to promote a balanced diet in pregnant and postpartum women.
-
Trial Registration
- Clinical Research Information Service Identifier KCT0005118.
INTRODUCTION
METHODS
RESULTS
DISCUSSION
-
CONFLICT OF INTEREST
There are no financial or other issues that might lead to conflict of interest.
-
FUNDING
This work was supported by the National Research Foundation of Korea (Grant number: 2018R1C1B3003777) and Chonnam National University (Grant number: 2023-0080-01).
-
DATA AVAILABILITY
Research data is optionally available upon a reasonable request to the corresponding author.
-
ACKNOWLEDGMENTS
During the preparation of this work, the author(s) used DeepL in order to translate the manuscript to English. After using this tool/service, the authors reviewed and edited the content as needed and take full responsibility for the content of the publication.
NOTES
SUPPLEMENTARY MATERIALS
Supplementary Table 1.
Supplementary Table 2.
Supplementary Table 3.
Supplementary Table 4.
Supplementary Table 5.
Supplementary Table 6.
Fig. 1.
Flowchart of pregnant women participating in diet assessment during late pregnancy and post-delivery.
FFQ, food frequency questionnaire.
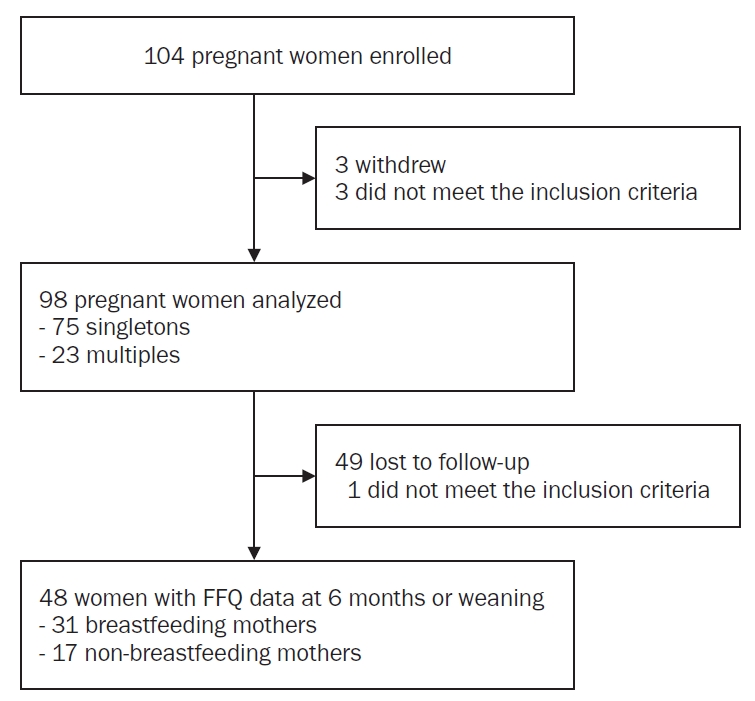
Fig. 2.
(A) Mean nutrient intakes from foods and supplements during late pregnancy shown as percentages of the respective RNIs or AIs. (B) Mean nutrient intakes of women after childbirth shown as percentages of the respective RNIs or AIs. (C) Prevalence of nutrient intake in pregnant women according to the EAR, AI, or UL. (D) Prevalence of nutrient intake in women after delivery according to the EAR, AI, or UL. All nutrients were based on the 2020 KDRIs. EAR, RNI, and UL values were used for all nutrients, except fiber and potassium, which were calculated based on the AI, and sodium, which was based on the chronic disease risk reduction intake. (A, B) Participants consuming extreme amounts of iron (≥ 140 mg/d, n = 2), thiamine (≥ 33 mg/d, n = 2), riboflavin (≥ 27 mg/d, n = 1), or vitamin C [≥ 1,000 mg/d, (A): n = 6, (B): n = 2] were excluded from the analysis of the corresponding nutrient. These extreme intakes emanated from supplements. (C, D) Black, excess is above the UL; gray, adequate is above the EAR or AI but below the UL; light gray, deficient is below the EAR or AI.
RNI, recommended nutrient intakes; AI, adequate intake; EAR, estimated average requirement; UL, tolerable upper intake level.

Table 1.Characteristics of Korean pregnant women carrying singletons or multiples assessed at delivery
Table 2.Mean intakes of food groups and nutrients of Korean pregnant women carrying singletons or multiples during the third trimester of pregnancy
Table 3.Mean food group intakes during the third trimester of pregnancy in singleton- and multiple-pregnancy mothers
Table 4.Mean nutrient intakes from foods during the third trimester of pregnancy of mothers carrying singletons or multiples
Table 5.Characteristics of participants with follow-up
Table 6.Changes in food group intakes from the third trimester of pregnancy to postpartum according to breastfeeding status
| Food group (serving/d) |
Breastfeeding mothers (n = 31) |
Non-breastfeeding mothers (n = 17) |
Difference between groups |
|||||||
|---|---|---|---|---|---|---|---|---|---|---|
| Late pregnancy | After delivery | ∆ in intakes | P1) | Late pregnancy | After delivery | ∆ in intakes | P1) | P2) | P3) | |
| Rice | 2.08 ± 0.91 | 1.99 ± 0.86 | –0.09 ± 1.37 | 0.721 | 2.12 ± 0.88 | 1.62 ± 0.75 | –0.50 ± 1.05 | 0.065 | 0.174 | 0.375 |
| Flour | 1.06 ± 0.71 | 1.13 ± 0.86 | 0.07 ± 0.88 | 0.979 | 1.05 ± 0.71 | 1.18 ± 0.71 | 0.13 ± 0.71 | 0.467 | 0.931 | 0.509 |
| Meat | 1.28 ± 0.96 | 1.14 ± 0.66 | –0.13 ± 0.98 | 0.557 | 1.06 ± 0.99 | 1.18 ± 1.08 | 0.12 ± 0.97 | 0.980 | 0.722 | 0.373 |
| Fish and shellfish | 0.55 ± 0.71 | 0.67 ± 0.87 | 0.12 ± 1.20 | 0.365 | 0.32 ± 0.28 | 0.29 ± 0.31 | –0.03 ± 0.40 | 0.787 | 0.620 | 0.940 |
| Eggs | 0.72 ± 0.79 | 0.73 ± 0.62 | 0.01 ± 0.80 | 0.127 | 0.70 ± 0.66 | 0.73 ± 0.73 | 0.04 ± 0.91 | 0.660 | 0.296 | 0.721 |
| Beans | 0.76 ± 0.82 | 0.49 ± 0.45 | –0.27 ± 0.80 | 0.167 | 0.55 ± 0.51 | 0.43 ± 0.34 | –0.12 ± 0.56 | 0.527 | 0.593 | 0.520 |
| Vegetables | 4.83 ± 3.29 | 4.17 ± 3.65 | –0.66 ± 3.99 | 0.128 | 3.86 ± 2.08 | 2.37 ± 1.42 | –1.50 ± 2.76 | 0.040 | 0.477 | 0.625 |
| Starchy vegetables | 0.45 ± 0.68 | 0.43 ± 0.41 | –0.02 ± 0.76 | 0.216 | 0.30 ± 0.33 | 0.28 ± 0.33 | –0.02 ± 0.52 | 0.881 | 0.826 | 0.824 |
| Leafy vegetables | 2.45 ± 1.61 | 1.72 ± 1.49 | –0.73 ± 1.76 | 0.013 | 1.97 ± 1.35 | 1.14 ± 0.71 | –0.83 ± 1.64 | 0.053 | 0.863 | 0.792 |
| Other vegetables | 1.93 ± 1.67 | 2.02 ± 2.40 | 0.09 ± 2.72 | 0.551 | 1.59 ± 1.43 | 0.95 ± 0.89 | –0.64 ± 1.76 | 0.133 | 0.413 | 0.546 |
| Mushrooms | 0.14 ± 0.33 | 0.17 ± 0.41 | 0.03 ± 0.50 | 0.708 | 0.09 ± 0.14 | 0.04 ± 0.08 | –0.05 ± 0.14 | 0.187 | 0.327 | 0.675 |
| Seaweed | 0.33 ± 0.30 | 0.63 ± 0.72 | 0.30 ± 0.71 | 0.067 | 0.27 ± 0.22 | 0.26 ± 0.27 | –0.004 ± 0.32 | 0.850 | 0.109 | 0.277 |
| Fruits | 2.54 ± 2.31 | 1.55 ± 1.82 | –0.99 ± 2.56 | 0.008 | 2.25 ± 1.53 | 0.86 ± 0.65 | –1.39 ± 1.83 | 0.005 | 0.485 | 0.365 |
| Dairy products | 0.59 ± 0.74 | 0.20 ± 0.22 | –0.39 ± 0.69 | 0.004 | 0.26 ± 0.34 | 0.31 ± 0.37 | 0.04 ± 0.38 | 0.654 | 0.029 | 0.014 |
| Nuts and seeds | 0.04 ± 0.16 | 0.02 ± 0.04 | –0.02 ± 0.14 | 0.426 | 0.04 ± 0.10 | 0.02 ± 0.05 | –0.02 ± 0.11 | 0.557 | > 0.999 | 0.593 |
| Oils and sweets | 1.31 ± 1.04 | 1.57 ± 1.32 | 0.26 ± 1.08 | 0.232 | 1.05 ± 0.94 | 1.89 ± 1.59 | 0.84 ± 1.17 | 0.010 | 0.090 | 0.072 |
| Salty foods | 2.49 ± 2.11 | 2.18 ± 2.16 | –0.31 ± 2.42 | 0.219 | 2.45 ± 1.91 | 1.53 ± 1.07 | –0.92 ± 2.35 | 0.128 | 0.406 | 0.424 |
| Fermented foods | 3.01 ± 2.23 | 2.27 ± 2.16 | –0.74 ± 2.40 | 0.010 | 2.64 ± 1.98 | 1.74 ± 1.11 | –0.90 ± 2.42 | 0.472 | 0.819 | 0.844 |
| Coffee | 0.22 ± 0.36 | 0.63 ± 0.94 | 0.41 ± 0.96 | 0.024 | 0.19 ± 0.31 | 1.62 ± 1.09 | 1.43 ± 1.10 | < 0.001 | 0.001 | 0.002 |
| Alcohol | 0.00 ± 0.00 | 0.16 ± 0.39 | 0.16 ± 0.39 | 0.025 | 0.00 ± 0.00 | 0.30 ± 0.51 | 0.30 ± 0.51 | 0.028 | 0.143 | 0.260 |
Mean ± SD.
1)The paired t-test or Wilcoxon’s signed-rank test were applied to compare intakes between the third trimester of pregnancy and after delivery.
2)Student’s t-test or the Mann–Whitney U test was applied to compare changes in intakes between groups.
3)General linear model was applied and adjusted for maternal age, body mass index at delivery, and number of fetuses.
Table 7.Changes in nutrient intake from food from the third trimester of pregnancy to postpartum according to breastfeeding status
| Nutrients (/d) |
Breastfeeding mothers (n = 31) |
Non-breastfeeding mothers (n = 17) |
Difference between groups |
|||||||
|---|---|---|---|---|---|---|---|---|---|---|
| Late pregnancy | After delivery | ∆ in intakes | P1) | Late pregnancy | After delivery | ∆ in intakes | P1) | P2) | P3) | |
| Energy (kcal) | 2,317.1 ± 865.8 | 2,177.4 ± 697.5 | –146.7 ± 937.7 | 0.448 | 2,167.7 ± 725.4 | 2,008.3 ± 924.1 | –159.4 ± 831.6 | 0.267 | 0.451 | 0.923 |
| Protein (g) | 90.8 ± 45.5 | 82.5 ± 26.2 | –8.3 ± 46.1 | 0.567 | 84.3 ± 43.8 | 76.3 ± 43.7 | –8.0 ± 38.6 | 0.179 | 0.321 | 0.954 |
| % of energy intake | 15.3 ± 2.7 | 15.4 ± 2.3 | 0.1 ± 3.2 | 0.791 | 15.2 ± 3.3 | 14.7 ± 2.2 | –0.5 ± 2.8 | 0.626 | 0.509 | 0.535 |
| Fat (g) | 65.4 ± 32.6 | 60.1 ± 26.9 | –5.3 ± 33.3 | 0.618 | 57.2 ± 31.9 | 56.1 ± 37.0 | –1.1 ± 31.6 | 0.547 | 0.746 | 0.704 |
| % of energy intake | 25.0 ± 6.0 | 24.4 ± 5.6 | –0.6 ± 7.7 | 0.662 | 23.3 ± 8.3 | 23.9 ± 5.5 | 0.5 ± 9.7 | 0.582 | 0.659 | 0.714 |
| SFA (g) | 20.1 ± 9.7 | 18.5 ± 10.0 | –1.6 ± 10.9 | 0.211 | 18.0 ± 10.3 | 17.4 ± 11.6 | –0.6 ± 9.6 | 0.521 | 0.897 | 0.739 |
| MUFA (g) | 20.6 ± 11.1 | 18.8 ± 9.1 | –1.7 ± 11.4 | 0.369 | 18.0 ± 11.0 | 18.0 ± 12.6 | 0.001 ± 10.9 | 0.705 | 0.983 | 0.669 |
| PUFA (g) | 15.8 ± 8.2 | 14.9 ± 6.9 | –0.9 ± 8.7 | 0.774 | 13.1 ± 6.0 | 12.3 ± 7.2 | –0.8 ± 5.9 | 0.305 | 0.189 | 0.948 |
| Omega-3 (g) | 1.9 ± 1.0 | 1.8 ± 0.8 | –0.1 ± 1.2 | 0.795 | 1.5 ± 0.7 | 1.3 ± 0.7 | –0.2 ± 0.6 | 0.131 | 0.244 | 0.933 |
| Omega-6 (g) | 14.1 ± 7.4 | 13.4 ± 6.1 | –0.8 ± 7.7 | 0.748 | 11.7 ± 5.5 | 11.1 ± 6.7 | –0.6 ± 5.4 | 0.305 | 0.181 | 0.915 |
| Cholesterol (mg) | 341.9 ± 124.6 | 366.5 ± 174.5 | –7.8 ± 224.6 | 0.685 | 341.2 ± 218.0 | 343.1 ± 213.9 | 1.9 ± 190.0 | 0.990 | 0.490 | 0.644 |
| Carbohydrate (g) | 341.9 ± 124.6 | 320.0 ± 107.9 | –21.9 ± 154.8 | 0.434 | 326.8 ± 100.4 | 288.7 ± 112.3 | –38.1 ± 144.7 | 0.302 | 0.746 | 0.701 |
| % of energy intake | 59.6 ± 7.9 | 58.8 ± 7.5 | –0.8 ± 10.0 | 0.705 | 61.0 ± 11.5 | 59.0 ± 7.6 | –2.0 ± 12.9 | 0.680 | 0.724 | 0.749 |
| Fiber (mg) | 24.7 ± 13.3 | 21.0 ± 9.8 | –3.7 ± 13.7 | 0.178 | 21.5 ± 7.7 | 17.8 ± 9.2 | –3.7 ± 12.0 | 0.129 | 0.518 | 0.906 |
| Calcium (mg) | 678.2 ± 325.0 | 614.0 ± 301.5 | –64.2 ± 396.7 | 0.278 | 563.3 ± 214.3 | 481.3 ± 229.4 | –82.1 ± 228.9 | 0.131 | 0.844 | 0.942 |
| Phosphorus (mg) | 1,313.0 ± 594.9 | 1,203.8 ± 398.3 | –109.3 ± 641.4 | 0.504 | 1,219.2 ± 463.8 | 1,033.6 ± 501.7 | –185.6 ± 446.3 | 0.070 | 0.281 | 0.745 |
| Total iron (mg) | 16.6 ± 8.2 | 15.0 ± 5.4 | –1.5 ± 8.4 | 0.482 | 15.1 ± 5.0 | 12.7 ± 6.2 | –2.4 ± 6.3 | 0.077 | 0.219 | 0.801 |
| Heme iron (mg) | 1.7 ± 1.6 | 1.4 ± 0.7 | –0.3 ± 1.6 | 0.731 | 1.3 ± 1.1 | 1.3 ± 1.1 | –0.03 ± 1.1 | 0.383 | 0.605 | 0.488 |
| Non-heme iron (mg) | 14.9 ± 7.1 | 13.6 ± 5.0 | –1.2 ± 7.3 | 0.498 | 13.8 ± 4.3 | 11.4 ± 5.3 | –2.3 ± 5.8 | 0.075 | 0.219 | 0.662 |
| Sodium (mg) | 3,801.3 ± 1,915.5 | 3,838.0 ± 1,476.4 | 36.6 ± 2,027.2 | 0.676 | 3,338.4 ± 1,299.4 | 3,319.9 ± 1,883.4 | –18.5 ± 1,708.4 | 0.588 | 0.219 | 0.994 |
| Potassium (mg) | 3,743.9 ± 1,876.5 | 3,256.4 ± 1,192.3 | –487.5 ± 1,879.5 | 0.234 | 3,557.5 ± 1,290.3 | 2,561.3 ± 1,231.3 | –996.2 ± 1,736.0 | 0.027 | 0.149 | 0.415 |
| Vitamin A (μg/RE) | 844.4 ± 451.7 | 699.2 ± 326.6 | –154.2 ± 437.2 | 0.080 | 757.9 ± 324.3 | 594.7 ± 343.2 | –163.2 ± 407.6 | 0.052 | 0.620 | 0.924 |
| Retinol (μg) | 155.9 ± 77.2 | 149.6 ± 91.1 | –6.3 ± 89.9 | 0.447 | 146.3 ± 84.2 | 132.2 ± 74.6 | –14.1 ± 67.2 | 0.538 | 0.590 | 0.742 |
| Carotene (μg) | 3,948.7 ± 2,371.8 | 3,064.4 ± 1,541.9 | –884.3 ± 2,198.8 | 0.036 | 3,469.4 ± 1,724.7 | 2,530.0 ± 1,539.2 | –939.4 ± 2,227.6 | 0.051 | 0.605 | 0.953 |
| Thiamin (mg) | 2.4 ± 1.1 | 2.1 ± 0.8 | –0.3 ± 1.1 | 0.130 | 2.1 ± 0.7 | 1.8 ± 1.0 | –0.3 ± 1.0 | 0.093 | 0.311 | 0.992 |
| Riboflavin (mg) | 1.9 ± 0.8 | 1.7 ± 0.7 | –0.2 ± 0.9 | 0.214 | 1.7 ± 0.7 | 1.6 ± 0.9 | –0.1 ± 0.6 | 0.225 | 0.812 | 0.995 |
| Niacin (mg) | 17.4 ± 9.5 | 15.5 ± 5.3 | –1.9 ± 9.5 | 0.479 | 16.2 ± 6.0 | 14.1 ± 8.6 | –2.1 ± 8.1 | 0.092 | 0.189 | 0.903 |
| Vitamin C (mg) | 207.1 ± 177.0 | 145.0 ± 185.0 | –62.1 ± 231.1 | 0.010 | 202.9 ± 199.8 | 98.6 ± 69.4 | –104.4 ± 229.7 | 0.020 | 0.897 | 0.265 |
Mean ± SD.
SFA, saturated fatty acids; MUFA, mono-unsaturated fatty acids; PUFA, poly-unsaturated fatty acids.
1)The paired t-test or Wilcoxon’s signed-rank test were applied to compare intakes between the third trimester of pregnancy and after delivery.
2)Student’s t-test or the Mann–Whitney U test was applied to compare changes in intakes between groups.
3)General linear model was applied and adjusted for maternal age, body mass index at delivery, and number of fetuses.
- 1. Meltzer HM, Brantsæter AL, Nilsen RM, Magnus P, Alexander J, Haugen M. Effect of dietary factors in pregnancy on risk of pregnancy complications: results from the Norwegian mother and child cohort study. Am J Clin Nutr 2011; 94(6 Suppl): 1970S-1974S. ArticlePubMedPMC
- 2. Hajianfar H, Abbasi K, Azadbakht L, Esmaeilzadeh A, Mollaghasemi N, Arab A. The association between maternal dietary iron intake during the first trimester of pregnancy with pregnancy outcomes and pregnancy-related complications. Clin Nutr Res 2020; 9(1): 52-62. ArticlePubMedPMCLink
- 3. Coletta JM, Bell SJ, Roman AS. Omega-3 fatty acids and pregnancy. Rev Obstet Gynecol 2010; 3(4): 163-171. PubMedPMC
- 4. Kovacs CS. Calcium and bone metabolism during pregnancy and lactation. J Mammary Gland Biol Neoplasia 2005; 10(2): 105-118. ArticlePubMedPDF
- 5. Milman N. Iron and pregnancy--a delicate balance. Ann Hematol 2006; 85(9): 559-565. ArticlePubMedPDF
- 6. Kim H, Jang W, Kim KN, Hwang JY, Chung HK, Yang EJ, et al. Comparison of dietary food and nutrient intakes by supplement use in pregnant and lactating women in Seoul. Nutr Res Pract 2013; 7(3): 199-206. ArticlePubMedPMC
- 7. Kim YJ, Lee SS. The relation of maternal stress with nutrients intake and pregnancy outcome in pregnant women. Korean J Nutr 2008; 41(8): 776-785.
- 8. Bae HS, Kim SY, Ahnv HS, Cho YK. Comparison of nutrient intake, life style variables, and pregnancy outcomes by the depression degree of pregnant women. Nutr Res Pract 2010; 4(4): 323-331. ArticlePubMedPMC
- 9. Tao MH, Liu JL, Nguyen UDT. Trends in diet quality by race/ethnicity among adults in the United States for 2011-2018. Nutrients 2022; 14(19): 4178.ArticlePubMedPMC
- 10. Ye K, Cao C, Lin X, O’Brien KO, Gu Z. Natural selection on HFE in Asian populations contributes to enhanced non-heme iron absorption. BMC Genet 2015; 16: 61.ArticlePubMedPMCPDF
- 11. Osterman MJK, Hamilton BE, Martin JA, Driscoll AK, Valenzuela CP. Births: final data for 2022. Natl Vital Stat Rep 2024; 73(2): 1-56. Article
- 12. KOrean Statistical Information Service (KOSIS). Vital statistics: multiple births by birth order for provinces [Internet]. Statistics Korea; 2024 [cited 2024 Jun 21]. Available from: https://kosis.kr/statHtml/statHtml.do?sso=ok&returnurl=https%3A%2F%2Fkosis.kr%3A443%2FstatHtml%2FstatHtml.do%3Fconn_path%3DI2%26tblId%3DDT_1B81A11%26orgId%3D101%26
- 13. Strengthening the reporting of observational studies in epidemiology (STROBE). What is STROBE? [Internet]. STROBE; 2025 [2025 Feb 7]. Available from: https://www.strobe-statement.org/
- 14. Yun SH, Shim JS, Kweon S, Oh K. Development of a food frequency questionnaire for the Korea National Health and Nutrition Examination Survey: data from the fourth Korea National Health and Nutrition Examination Survey (KNHANES IV). Korean J Nutr 2013; 46(2): 186-196. Article
- 15. Archundia-Herrera MC, Nunes F, Barrios ID, Park CY, Bell RC, O’Brien KO. Development of a database for the estimation of heme iron and nonheme iron content of animal-based foods. Curr Dev Nutr 2024; 8(4): 102130.ArticlePubMedPMC
- 16. Ministry of Health and Welfare (MOHW), The Korean Nutrition Society. Dietary reference intakes for Koreans 2020. MOHW; 2020.
- 17. KOrean Statistical Information Service (KOSIS). Vital statistics: mean age of mother by birth order for provinces [Internet]. Statistics Korea; 2024 [cited 2024 May 2]. Available from: https://kosis.kr/statHtml/statHtml.do?sso=ok&returnurl=https%3A%2F%2Fkosis.kr%3A443%2FstatHtml%2FstatHtml.do%3Fconn_path%3DI2%26tblId%3DDT_1B81A20%26orgId%3D101%26
- 18. Hur I, Jang MJ, Oh K. Food and nutrient intakes according to income in korean men and women. Osong Public Health Res Perspect 2011; 2(3): 192-197. ArticlePubMedPMC
- 19. Oh Y, Park SJ. An economic analysis of the decline in the fertility rate. Korean J Econ 2008; 15(1): 91-112.
- 20. Nam HW, Lee KY. A study on the sodium and potassium intakes and their metabolism of the pregnant women in Korea. Korean J Nutr 1985; 18(3): 194-200.
- 21. Ishitsuka K, Sasaki S, Yamamoto-Hanada K, Mezawa H, Konishi M, Ohya Y; Japan Environment and Children’s Study Group. Changes in dietary intake in pregnant women from periconception to pregnancy in the Japan environment and children’s study: a nationwide Japanese birth cohort study. Matern Child Health J 2020; 24(3): 389-400. ArticlePubMedPDF
- 22. Bouwland-Both MI, Steegers-Theunissen RP, Vujkovic M, Lesaffre EM, Mook-Kanamori DO, Hofman A, et al. A periconceptional energy-rich dietary pattern is associated with early fetal growth: the Generation R study. BJOG 2013; 120(4): 435-445. ArticlePubMed
- 23. 2020 Dietary Guidelines Advisory Committee. Pregnancy and lactation: food group and nutrient intakes [Internet]. U.S. Department of Agriculture; 2020 [cited 2024 Apr 29]. Available from: https://www.dietaryguidelines.gov/sites/default/files/2020-07/DA_Supplement_Pregnancy_and_Lactation_0.pdf
- 24. Ter Borg S, Koopman N, Verkaik-Kloosterman J. An evaluation of food and nutrient intake among pregnant women in the Netherlands: a systematic review. Nutrients 2023; 15(13): 3071.ArticlePubMedPMC
- 25. Heppe DH, van Dam RM, Willemsen SP, den Breeijen H, Raat H, Hofman A, et al. Maternal milk consumption, fetal growth, and the risks of neonatal complications: the Generation R Study. Am J Clin Nutr 2011; 94(2): 501-509. ArticlePubMed
- 26. Organization for Economic Co-operation and Development (OECD). Health at a Glance 2023. OECD Publishing; 2023.
- 27. Korea Health Industry Development Institute (KHIDI). Intake by Nutrients 2021 [Internet]. Korea Disease Control and Prevention Agency; 2021 [cited 2024 Jan 16]. Available from: https://www.khidi.or.kr/kps/dhraStat/result5?menuId=MENU01657&year=2021
- 28. Bailey RL, Pac SG, Fulgoni VL 3rd, Reidy KC, Catalano PM. Estimation of total usual dietary intakes of pregnant women in the United States. JAMA Netw Open 2019; 2(6): e195967. ArticlePubMedPMC
- 29. Yang J, Dang S, Cheng Y, Qiu H, Mi B, Jiang Y, et al. Dietary intakes and dietary patterns among pregnant women in Northwest China. Public Health Nutr 2017; 20(2): 282-293. ArticlePubMed
- 30. Korea Disease Control and Prevention Agency. Dietary supplementation status [Internet]. Korea Health Statistics Plus; 2022 [cited 2024 Apr 29]. Available from: https://www.seoulnutri.co.kr/food-db/115.do
- 31. Jun S, Gahche JJ, Potischman N, Dwyer JT, Guenther PM, Sauder KA, et al. Dietary supplement use and its micronutrient contribution during pregnancy and lactation in the United States. Obstet Gynecol 2020; 135(3): 623-633. ArticlePubMedPMC
- 32. Young MF, Griffin I, Pressman E, McIntyre AW, Cooper E, McNanley T, et al. Utilization of iron from an animal-based iron source is greater than that of ferrous sulfate in pregnant and nonpregnant women. J Nutr 2010; 140(12): 2162-2166. ArticlePubMedPMC
- 33. Scanlon KS, Yip R, Schieve LA, Cogswell ME. High and low hemoglobin levels during pregnancy: differential risks for preterm birth and small for gestational age. Obstet Gynecol 2000; 96(5 Pt 1): 741-748. ArticlePubMed
- 34. Ziaei S, Janghorban R, Shariatdoust S, Faghihzadeh S. The effects of iron supplementation on serum copper and zinc levels in pregnant women with high-normal hemoglobin. Int J Gynaecol Obstet 2008; 100(2): 133-135. ArticlePubMedLink
- 35. Adams PC, Reboussin DM, Barton JC, McLaren CE, Eckfeldt JH, McLaren GD, et al.; Hemochromatosis and Iron Overload Screening (HEIRS) Study Research Investigators. Hemochromatosis and iron-overload screening in a racially diverse population. N Engl J Med 2005; 352(17): 1769-1778. ArticlePubMed
- 36. Khambalia AZ, Aimone A, Nagubandi P, Roberts CL, McElduff A, Morris JM, et al. High maternal iron status, dietary iron intake and iron supplement use in pregnancy and risk of gestational diabetes mellitus: a prospective study and systematic review. Diabet Med 2016; 33(9): 1211-1221. ArticlePubMed
- 37. Alberta Health Services. Nutrition guideline pregnancy: multiples [Internet]. Alberta Health Services; 2018 [cited 2024 Apr 29]. Available from: https://www.albertahealthservices.ca/assets/info/nutrition/if-nfs-ng-pregnancy-multiples.pdf
- 38. Wierzejska RE. Review of dietary recommendations for twin pregnancy: does nutrition science keep up with the growing incidence of multiple gestations? Nutrients 2022; 14(6): 1143.ArticlePubMedPMC
- 39. Nakayama S, Yasui T, Suto M, Sato M, Kaji T, Uemura H, et al. Differences in bone metabolism between singleton pregnancy and twin pregnancy. Bone 2011; 49(3): 513-519. ArticlePubMed
- 40. Kim HC, Lee H, Lee HH, Seo E, Kim E, Han J, et al.; Korean Society of Hypertension (KSH)-Hypertension Epidemiology Research Working Group. Korea hypertension fact sheet 2021: analysis of nationwide population-based data with special focus on hypertension in women. Clin Hypertens 2022; 28(1): 1.ArticlePubMedPMCPDF
- 41. Koo BK, Lee JH, Kim J, Jang EJ, Lee CH. Prevalence of gestational diabetes mellitus in Korea: a national health insurance database study. PLoS One 2016; 11(4): e0153107. ArticlePubMedPMC
- 42. Chung SH, Kim HR, Choi YS, Bae CW. Trends of breastfeeding rate in Korea (1994-2012): comparison with OECD and other countries. J Korean Med Sci 2013; 28(11): 1573-1580. ArticlePubMedPMCLink
REFERENCES
Figure & Data
REFERENCES
Citations
Citations to this article as recorded by 
- Postpartum bone mineral density in Korean women: associations with lactation status and calcium intake
Cheawon Lee, Hangyeol Jeon, Yoon Ha Kim, Myeong Gyun Choi, Jong Woon Kim, Clara Yongjoo Park
Nutrition Research and Practice.2026; 20(1): 145. CrossRef - Placental cadmium and its association with maternal diet and offspring growth in Koreans
Dahyeon Kim, Cheawon Lee, Yoon Ha Kim, Myeong Gyun Choi, Jong Woon Kim, Clara Yongjoo Park
Nutrition Research and Practice.2025; 19(3): 473. CrossRef
 Cite
CiteFood and nutrient intake in pregnant women with singletons or multiples and post-delivery changes in intake in Korea: an observational study

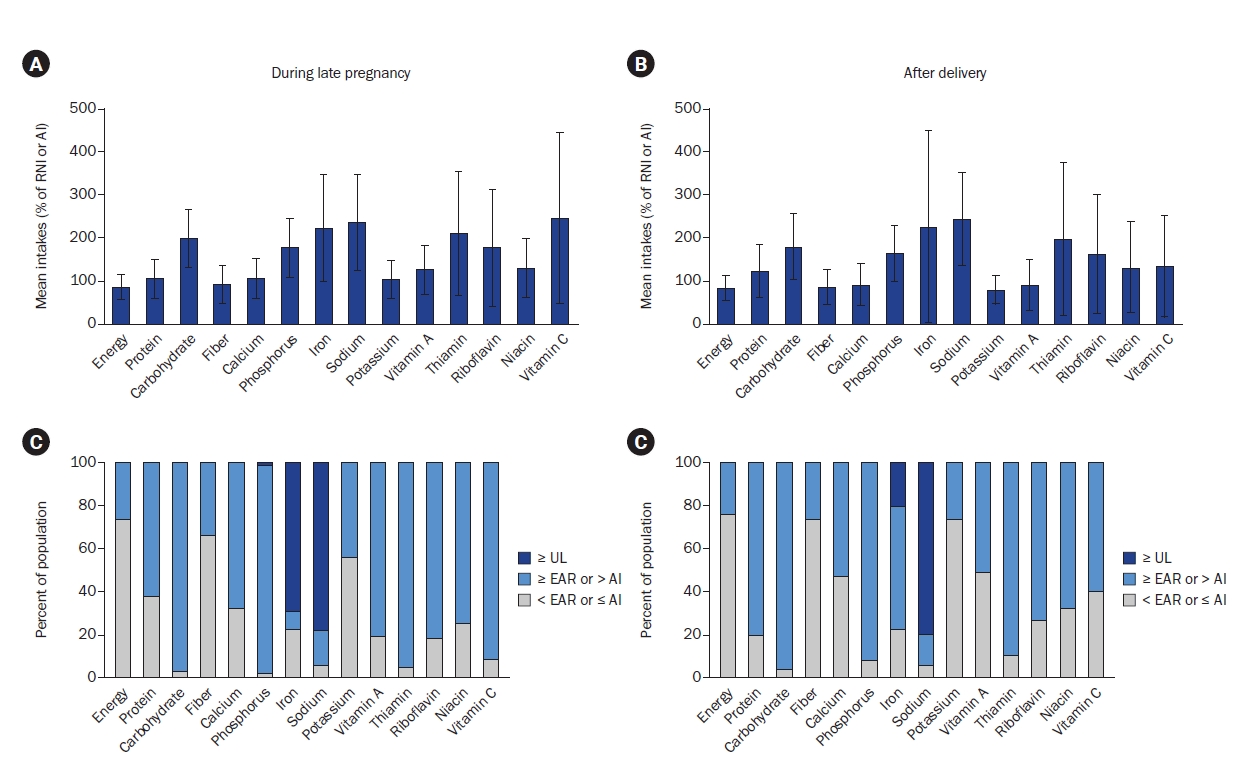
Fig. 1. Flowchart of pregnant women participating in diet assessment during late pregnancy and post-delivery.FFQ, food frequency questionnaire.
Fig. 2. (A) Mean nutrient intakes from foods and supplements during late pregnancy shown as percentages of the respective RNIs or AIs. (B) Mean nutrient intakes of women after childbirth shown as percentages of the respective RNIs or AIs. (C) Prevalence of nutrient intake in pregnant women according to the EAR, AI, or UL. (D) Prevalence of nutrient intake in women after delivery according to the EAR, AI, or UL. All nutrients were based on the 2020 KDRIs. EAR, RNI, and UL values were used for all nutrients, except fiber and potassium, which were calculated based on the AI, and sodium, which was based on the chronic disease risk reduction intake. (A, B) Participants consuming extreme amounts of iron (≥ 140 mg/d, n = 2), thiamine (≥ 33 mg/d, n = 2), riboflavin (≥ 27 mg/d, n = 1), or vitamin C [≥ 1,000 mg/d, (A): n = 6, (B): n = 2] were excluded from the analysis of the corresponding nutrient. These extreme intakes emanated from supplements. (C, D) Black, excess is above the UL; gray, adequate is above the EAR or AI but below the UL; light gray, deficient is below the EAR or AI.RNI, recommended nutrient intakes; AI, adequate intake; EAR, estimated average requirement; UL, tolerable upper intake level.
Fig. 1.
Fig. 2.
Food and nutrient intake in pregnant women with singletons or multiples and post-delivery changes in intake in Korea: an observational study
| Variable | All women (n = 98) | Women carrying singletons (n = 75) | Women carrying multiples (n = 23) | P-value |
|---|---|---|---|---|
| Age (year) | 32.7 ± 3.9 | 32.6 ± 4.2 | 33.1 ± 3.1 | 0.576 |
| Height (cm) | 161.9 ± 6.1 | 161.1 ± 5.9 | 164.2 ± 6.4 | 0.034 |
| Pre-pregnancy weight (kg) | 58.5± 10.0 | 58.3 ± 10.4 | 58.8 ± 8.9 | 0.760 |
| Pre-pregnancy BMI (kg/m2) | 22.3 ± 3.4 | 22.4 ± 3.5 | 21.8 ± 2.9 | 0.462 |
| Weight at delivery (kg) | 70.3 ± 11.2 | 69.7 ± 11.7 | 72.1 ± 9.2 | 0.302 |
| BMI at delivery (kg/m2) | 26.8 ± 3.9 | 26.8 ± 4.1 | 26.7 ± 3.1 | 0.978 |
| Length of gestation (day) | 256.3 ± 9.2 | 258.9 ± 7.5 | 248.1 ± 9.4 | < 0.001 |
| Parity | 0.82 ± 0.90 | 0.85 ± 0.93 | 0.70 ± 0.82 | 0.792 |
| Supplement intake | 86 (88) | 66 (88) | 20 (87) | 0.894 |
| Disease | 51 (52) | 37 (49) | 14 (61) | 0.333 |
| Diabetes | 17 (17) | 13 (17) | 4 (17) | 0.995 |
| Hypertension | 11 (11) | 8 (11) | 3 (13) | 0.752 |
| Thyroid disease | 11 (11) | 7 (9) | 4 (17) | 0.284 |
| Preeclampsia | 4 (4) | 1 (1) | 3 (13) | 0.013 |
| Smoking | 0 (0) | 0 (0) | 0 (0) | - |
| Drinking | 1 (1) | 1 (1) | 0 (0) | 0.578 |
| Food group (serving/d) | All (n = 98) | Nutrient (/d) | All (n = 98) |
|---|---|---|---|
| Rice | 2.15 ± 0.88 | Energy (kcal) | 2,255.7 ± 812.8 |
| Flour | 1.03 ± 0.70 | Protein (g) | 84.7 ± 39.3 |
| Meat | 1.06 ± 0.82 | % of total kcal | 14.8 ± 2.6 |
| Fish and shellfish | 0.50 ± 0.65 | Fat (g) | 58.7 ± 29.6 |
| Eggs | 0.72 ± 0.77 | % of total kcal | 23.3 ± 6.8 |
| Beans | 0.61 ± 0.61 | SFA (g) | 18.1 ± 9.0 |
| Vegetables | 4.27 ± 2.83 | MUFA (g) | 18.3 ± 9.9 |
| Starchy vegetables | 0.40 ± 0.52 | PUFA (g) | 14.2 ± 7.3 |
| Leafy vegetables | 2.07 ± 1.47 | Omega-3 (g) | 1.7 ± 0.9 |
| Other vegetables | 1.80 ± 1.61 | Omega-6 (g) | 12.7 ± 6.6 |
| Mushrooms | 0.11 ± 0.23 | Cholesterol (mg) | 357.7 ± 224.5 |
| Seaweed | 0.28 ± 0.23 | Carbohydrate (g) | 345.9 ± 122.9 |
| Fruits | 2.49 ± 2.15 | % of total kcal | 61.6 ± 8.9 |
| Dairy products | 1.25 ± 0.95 | Fiber (mg) | 23.0 ± 11.1 |
| Nuts and seeds | 0.04 ± 0.15 | Calcium (mg) | 610.6 ± 270.5 |
| Oils and sweets | 1.23 ± 1.02 | Phosphorus (mg) | 1,235.5 ± 501.4 |
| Salty foods | 2.30 ± 1.90 | Total iron (mg) | 15.5 ± 6.6 |
| Fermented foods | 2.69 ± 1.98 | Heme (mg) | 1.4 ± 1.2 |
| Coffee | 0.29 ± 0.50 | Non-heme (mg) | 14.1 ± 5.7 |
| Alcohol | 0.00 ± 0.00 | Sodium (mg) | 3,526.1 ± 1,743.6 |
| Potassium (mg) | 3,531.9 ± 1,580.0 | ||
| Vitamin A (μg/RE) | 770.7 ± 361.0 | ||
| Retinol (μg) | 148.3 ± 75.6 | ||
| Carotene (μg) | 3,531.1 ± 1,882.2 | ||
| Thiamin (mg) | 2.2 ± 0.9 | ||
| Riboflavin (mg) | 1.8 ± 0.8 | ||
| Niacin (mg) | 16.5 ± 7.5 | ||
| Vitamin C (mg) | 196.0 ± 172.6 |
| Food group (serving/d) | Women carrying singletons (n = 75) | Women carrying multiples (n = 23) | P-value | Adjusted P |
|---|---|---|---|---|
| Rice | 2.11 ± 0.91 | 2.28 ± 0.76 | 0.400 | 0.711 |
| Flour | 1.04 ± 0.65 | 1.02 ± 0.88 | 0.456 | 0.327 |
| Meat | 1.06 ± 0.80 | 1.05 ± 0.91 | 0.920 | 0.723 |
| Fish and shellfish | 0.45 ± 0.52 | 0.67 ± 0.96 | 0.137 | 0.822 |
| Eggs | 0.75 ± 0.84 | 0.61 ± 0.53 | 0.753 | 0.389 |
| Beans | 0.61 ± 0.67 | 0.60 ± 0.40 | 0.292 | 0.600 |
| Vegetables | 4.15 ± 2.82 | 4.66 ± 2.90 | 0.346 | 0.767 |
| Starchy vegetables | 0.44 ± 0.56 | 0.29 ± 0.30 | 0.409 | 0.109 |
| Leafy vegetables | 2.01 ± 1.51 | 2.24 ± 1.36 | 0.214 | 0.551 |
| Other vegetables | 1.70 ± 1.52 | 2.13 ± 1.90 | 0.393 | 0.973 |
| Mushrooms | 0.10 ± 0.23 | 0.14 ± 0.23 | 0.083 | 0.353 |
| Seaweed | 0.26 ± 0.24 | 0.34 ± 0.22 | 0.043 | 0.220 |
| Fruits | 2.46 ± 1.91 | 2.59 ± 2.86 | 0.616 | 0.638 |
| Dairy products | 1.31 ± 1.01 | 1.08 ± 0.68 | 0.516 | 0.443 |
| Nuts and seeds | 0.05 ± 0.17 | 0.01 ± 0.03 | 0.108 | 0.156 |
| Oils and sweets | 1.25 ± 0.95 | 1.20 ± 1.26 | 0.358 | 0.429 |
| Salty foods | 2.28 ± 1.91 | 2.38 ± 1.92 | 0.647 | 0.625 |
| Fermented foods | 2.69 ± 1.99 | 2.71 ± 1.99 | 0.935 | 0.674 |
| Coffee | 0.30 ± 0.52 | 0.24 ± 0.47 | 0.500 | 0.938 |
| Alcohol | 0.00 ± 0.00 | 0.00 ± 0.00 | > 0.999 | > 0.999 |
| Nutrients (/d) | Women carrying singletons (n = 75) | Women carrying multiples (n = 23) | P-value | Adjusted P |
|---|---|---|---|---|
| Energy (kcal) | 2,265.1 ± 851.2 | 2,225.0 ± 688.9 | > 0.999 | 0.318 |
| Protein (g) | 84.6 ± 39.9 | 84.9 ± 38.1 | 0.849 | 0.431 |
| % of energy intake | 14.8 ± 2.6 | 15.0 ± 2.9 | 0.867 | 0.981 |
| Fat (g) | 59.7 ± 31.4 | 55.5 ± 22.9 | 0.791 | 0.187 |
| % of energy intake | 23.6 ± 7.2 | 22.5 ± 5.3 | 0.680 | 0.310 |
| SFA (g) | 18.5 ± 9.5 | 16.9 ± 7.3 | 0.542 | 0.101 |
| MUFA (g) | 18.7 ± 10.5 | 17.1 ± 7.8 | 0.683 | 0.171 |
| PUFA (g) | 14.4 ± 7.9 | 13.5 ± 4.9 | 0.902 | 0.386 |
| Omega-3 (g) | 1.7 ± 1.0 | 1.7 ± 0.8 | 0.702 | 0.418 |
| Omega-6 (g) | 12.9 ± 7.1 | 11.9 ± 4.4 | 0.993 | 0.332 |
| Cholesterol (mg) | 369.1 ± 238.4 | 320.7 ± 171.0 | 0.497 | 0.109 |
| Carbohydrate (g) | 345.6 ± 126.5 | 346.8 ± 113.1 | 0.967 | 0.545 |
| % of energy intake | 61.3 ± 9.2 | 62.5 ± 7.7 | 0.565 | 0.315 |
| Fiber (mg) | 23.2 ±11.9 | 22.2 ± 8.2 | 0.880 | 0.698 |
| Calcium (mg) | 626.2 ± 293.8 | 559.6 ± 169.5 | 0.599 | 0.095 |
| Phosphorus (mg) | 1,250.5 ± 529.5 | 1,186.4 ± 402.7 | 0.810 | 0.195 |
| Total iron (mg) | 15.5 ± 6.8 | 15.5 ± 5.8 | 0.788 | 0.499 |
| Heme iron (mg) | 1.4 ± 1.2 | 1.4 ± 1.3 | 0.981 | 0.470 |
| Non-heme iron (mg) | 14.1 ± 6.0 | 14.1 ± 4.8 | 0.758 | 0.531 |
| Sodium (mg) | 3,559.5 ± 1,828.0 | 3,417.0 ± 1,465.6 | 0.960 | 0.416 |
| Potassium (mg) | 3,645.1 ± 1,663.5 | 3,571.3 ± 1,437.6 | 0.977 | 0.427 |
| Vitamin A (μg/RE) | 785.3 ± 375.4 | 723.1 ± 312.1 | 0.683 | 0.135 |
| Retinol (μg) | 153.2 ± 78.0 | 132.5 ± 66.4 | 0.292 | 0.057 |
| Carotene (μg) | 3,577.9 ± 1,967.8 | 3,378.8 ± 1,601.0 | 0.993 | 0.374 |
| Thiamin (mg) | 2.2 ± 0.9 | 2.2 ± 0.8 | 0.971 | 0.375 |
| Riboflavin (mg) | 1.8 ± 0.8 | 1.7 ± 0.6 | 0.637 | 0.172 |
| Niacin (mg) | 16.6 ± 7.8 | 16.0 ± 6.7 | 0.939 | 0.295 |
| Vitamin C (mg) | 205.5 ± 181.8 | 165.1 ± 137.3 | 0.432 | 0.296 |
| Variable | All (n = 48) | Breastfeeding mothers (n = 31) | Non-breastfeeding mothers (n = 17) | P-value |
|---|---|---|---|---|
| Age (year) | 33.0 ± 3.5 | 32.5 ± 3.6 | 34.1 ± 3.2 | 0.143 |
| Height (cm) | 161.9 ± 6.3 | 161.1 ± 6.5 | 163.5 ± 5.9 | 0.219 |
| Pre-pregnancy weight (kg) | 58.7 ± 9.2 | 58.0 ± 8.6 | 60.2 ± 10.2 | 0.421 |
| Pre-pregnancy BMI (kg/m2) | 22.4 ± 3.0 | 22.3 ± 2.9 | 22.5 ± 3.4 | 0.874 |
| Weight at delivery (kg) | 71.8 ± 10.6 | 70.0 ± 9.0 | 74.9 ± 12.8 | 0.127 |
| BMI at delivery (kg/m2) | 27.3 ± 3.4 | 27.0 ± 2.9 | 28.0 ± 4.2 | 0.386 |
| Length of gestation (d) | 256.5 ± 8.8 | 255.4 ± 8.9 | 258.4 ± 8.6 | 0.206 |
| Parity | 0.79 ± 0.99 | 0.84 ± 0.97 | 0.71 ± 1.05 | 0.766 |
| Breastfeeding period (d) | 68.7 ± 74.4 | 101.4 ± 69.5 | 9.0 ± 7.8 | < 0.001 |
| Supplement | 32 (67) | 23 (74) | 9 (53) | 0.211 |
| Disease | 28 (58) | 17 (55) | 11 (65) | 0.507 |
| Diabetes | 12 (25) | 7 (23) | 5 (29) | 0.601 |
| Hypertension | 8 (17) | 4 (13) | 4 (24) | 0.345 |
| Thyroid disease | 6 (13) | 4 (13) | 2 (12) | 0.909 |
| Preeclampsia | 1 (2) | 0 (0) | 1 (6) | 0.172 |
| Smoking | 0 (0) | 0 (0) | 0 (0) | - |
| Drinking | 0 (0) | 0 (0) | 0 (0) | - |
| Food group (serving/d) | Breastfeeding mothers (n = 31) |
Non-breastfeeding mothers (n = 17) |
Difference between groups |
|||||||
|---|---|---|---|---|---|---|---|---|---|---|
| Late pregnancy | After delivery | ∆ in intakes | P |
Late pregnancy | After delivery | ∆ in intakes | P |
P |
P |
|
| Rice | 2.08 ± 0.91 | 1.99 ± 0.86 | –0.09 ± 1.37 | 0.721 | 2.12 ± 0.88 | 1.62 ± 0.75 | –0.50 ± 1.05 | 0.065 | 0.174 | 0.375 |
| Flour | 1.06 ± 0.71 | 1.13 ± 0.86 | 0.07 ± 0.88 | 0.979 | 1.05 ± 0.71 | 1.18 ± 0.71 | 0.13 ± 0.71 | 0.467 | 0.931 | 0.509 |
| Meat | 1.28 ± 0.96 | 1.14 ± 0.66 | –0.13 ± 0.98 | 0.557 | 1.06 ± 0.99 | 1.18 ± 1.08 | 0.12 ± 0.97 | 0.980 | 0.722 | 0.373 |
| Fish and shellfish | 0.55 ± 0.71 | 0.67 ± 0.87 | 0.12 ± 1.20 | 0.365 | 0.32 ± 0.28 | 0.29 ± 0.31 | –0.03 ± 0.40 | 0.787 | 0.620 | 0.940 |
| Eggs | 0.72 ± 0.79 | 0.73 ± 0.62 | 0.01 ± 0.80 | 0.127 | 0.70 ± 0.66 | 0.73 ± 0.73 | 0.04 ± 0.91 | 0.660 | 0.296 | 0.721 |
| Beans | 0.76 ± 0.82 | 0.49 ± 0.45 | –0.27 ± 0.80 | 0.167 | 0.55 ± 0.51 | 0.43 ± 0.34 | –0.12 ± 0.56 | 0.527 | 0.593 | 0.520 |
| Vegetables | 4.83 ± 3.29 | 4.17 ± 3.65 | –0.66 ± 3.99 | 0.128 | 3.86 ± 2.08 | 2.37 ± 1.42 | –1.50 ± 2.76 | 0.040 | 0.477 | 0.625 |
| Starchy vegetables | 0.45 ± 0.68 | 0.43 ± 0.41 | –0.02 ± 0.76 | 0.216 | 0.30 ± 0.33 | 0.28 ± 0.33 | –0.02 ± 0.52 | 0.881 | 0.826 | 0.824 |
| Leafy vegetables | 2.45 ± 1.61 | 1.72 ± 1.49 | –0.73 ± 1.76 | 0.013 | 1.97 ± 1.35 | 1.14 ± 0.71 | –0.83 ± 1.64 | 0.053 | 0.863 | 0.792 |
| Other vegetables | 1.93 ± 1.67 | 2.02 ± 2.40 | 0.09 ± 2.72 | 0.551 | 1.59 ± 1.43 | 0.95 ± 0.89 | –0.64 ± 1.76 | 0.133 | 0.413 | 0.546 |
| Mushrooms | 0.14 ± 0.33 | 0.17 ± 0.41 | 0.03 ± 0.50 | 0.708 | 0.09 ± 0.14 | 0.04 ± 0.08 | –0.05 ± 0.14 | 0.187 | 0.327 | 0.675 |
| Seaweed | 0.33 ± 0.30 | 0.63 ± 0.72 | 0.30 ± 0.71 | 0.067 | 0.27 ± 0.22 | 0.26 ± 0.27 | –0.004 ± 0.32 | 0.850 | 0.109 | 0.277 |
| Fruits | 2.54 ± 2.31 | 1.55 ± 1.82 | –0.99 ± 2.56 | 0.008 | 2.25 ± 1.53 | 0.86 ± 0.65 | –1.39 ± 1.83 | 0.005 | 0.485 | 0.365 |
| Dairy products | 0.59 ± 0.74 | 0.20 ± 0.22 | –0.39 ± 0.69 | 0.004 | 0.26 ± 0.34 | 0.31 ± 0.37 | 0.04 ± 0.38 | 0.654 | 0.029 | 0.014 |
| Nuts and seeds | 0.04 ± 0.16 | 0.02 ± 0.04 | –0.02 ± 0.14 | 0.426 | 0.04 ± 0.10 | 0.02 ± 0.05 | –0.02 ± 0.11 | 0.557 | > 0.999 | 0.593 |
| Oils and sweets | 1.31 ± 1.04 | 1.57 ± 1.32 | 0.26 ± 1.08 | 0.232 | 1.05 ± 0.94 | 1.89 ± 1.59 | 0.84 ± 1.17 | 0.010 | 0.090 | 0.072 |
| Salty foods | 2.49 ± 2.11 | 2.18 ± 2.16 | –0.31 ± 2.42 | 0.219 | 2.45 ± 1.91 | 1.53 ± 1.07 | –0.92 ± 2.35 | 0.128 | 0.406 | 0.424 |
| Fermented foods | 3.01 ± 2.23 | 2.27 ± 2.16 | –0.74 ± 2.40 | 0.010 | 2.64 ± 1.98 | 1.74 ± 1.11 | –0.90 ± 2.42 | 0.472 | 0.819 | 0.844 |
| Coffee | 0.22 ± 0.36 | 0.63 ± 0.94 | 0.41 ± 0.96 | 0.024 | 0.19 ± 0.31 | 1.62 ± 1.09 | 1.43 ± 1.10 | < 0.001 | 0.001 | 0.002 |
| Alcohol | 0.00 ± 0.00 | 0.16 ± 0.39 | 0.16 ± 0.39 | 0.025 | 0.00 ± 0.00 | 0.30 ± 0.51 | 0.30 ± 0.51 | 0.028 | 0.143 | 0.260 |
| Nutrients (/d) | Breastfeeding mothers (n = 31) |
Non-breastfeeding mothers (n = 17) |
Difference between groups |
|||||||
|---|---|---|---|---|---|---|---|---|---|---|
| Late pregnancy | After delivery | ∆ in intakes | P |
Late pregnancy | After delivery | ∆ in intakes | P |
P |
P |
|
| Energy (kcal) | 2,317.1 ± 865.8 | 2,177.4 ± 697.5 | –146.7 ± 937.7 | 0.448 | 2,167.7 ± 725.4 | 2,008.3 ± 924.1 | –159.4 ± 831.6 | 0.267 | 0.451 | 0.923 |
| Protein (g) | 90.8 ± 45.5 | 82.5 ± 26.2 | –8.3 ± 46.1 | 0.567 | 84.3 ± 43.8 | 76.3 ± 43.7 | –8.0 ± 38.6 | 0.179 | 0.321 | 0.954 |
| % of energy intake | 15.3 ± 2.7 | 15.4 ± 2.3 | 0.1 ± 3.2 | 0.791 | 15.2 ± 3.3 | 14.7 ± 2.2 | –0.5 ± 2.8 | 0.626 | 0.509 | 0.535 |
| Fat (g) | 65.4 ± 32.6 | 60.1 ± 26.9 | –5.3 ± 33.3 | 0.618 | 57.2 ± 31.9 | 56.1 ± 37.0 | –1.1 ± 31.6 | 0.547 | 0.746 | 0.704 |
| % of energy intake | 25.0 ± 6.0 | 24.4 ± 5.6 | –0.6 ± 7.7 | 0.662 | 23.3 ± 8.3 | 23.9 ± 5.5 | 0.5 ± 9.7 | 0.582 | 0.659 | 0.714 |
| SFA (g) | 20.1 ± 9.7 | 18.5 ± 10.0 | –1.6 ± 10.9 | 0.211 | 18.0 ± 10.3 | 17.4 ± 11.6 | –0.6 ± 9.6 | 0.521 | 0.897 | 0.739 |
| MUFA (g) | 20.6 ± 11.1 | 18.8 ± 9.1 | –1.7 ± 11.4 | 0.369 | 18.0 ± 11.0 | 18.0 ± 12.6 | 0.001 ± 10.9 | 0.705 | 0.983 | 0.669 |
| PUFA (g) | 15.8 ± 8.2 | 14.9 ± 6.9 | –0.9 ± 8.7 | 0.774 | 13.1 ± 6.0 | 12.3 ± 7.2 | –0.8 ± 5.9 | 0.305 | 0.189 | 0.948 |
| Omega-3 (g) | 1.9 ± 1.0 | 1.8 ± 0.8 | –0.1 ± 1.2 | 0.795 | 1.5 ± 0.7 | 1.3 ± 0.7 | –0.2 ± 0.6 | 0.131 | 0.244 | 0.933 |
| Omega-6 (g) | 14.1 ± 7.4 | 13.4 ± 6.1 | –0.8 ± 7.7 | 0.748 | 11.7 ± 5.5 | 11.1 ± 6.7 | –0.6 ± 5.4 | 0.305 | 0.181 | 0.915 |
| Cholesterol (mg) | 341.9 ± 124.6 | 366.5 ± 174.5 | –7.8 ± 224.6 | 0.685 | 341.2 ± 218.0 | 343.1 ± 213.9 | 1.9 ± 190.0 | 0.990 | 0.490 | 0.644 |
| Carbohydrate (g) | 341.9 ± 124.6 | 320.0 ± 107.9 | –21.9 ± 154.8 | 0.434 | 326.8 ± 100.4 | 288.7 ± 112.3 | –38.1 ± 144.7 | 0.302 | 0.746 | 0.701 |
| % of energy intake | 59.6 ± 7.9 | 58.8 ± 7.5 | –0.8 ± 10.0 | 0.705 | 61.0 ± 11.5 | 59.0 ± 7.6 | –2.0 ± 12.9 | 0.680 | 0.724 | 0.749 |
| Fiber (mg) | 24.7 ± 13.3 | 21.0 ± 9.8 | –3.7 ± 13.7 | 0.178 | 21.5 ± 7.7 | 17.8 ± 9.2 | –3.7 ± 12.0 | 0.129 | 0.518 | 0.906 |
| Calcium (mg) | 678.2 ± 325.0 | 614.0 ± 301.5 | –64.2 ± 396.7 | 0.278 | 563.3 ± 214.3 | 481.3 ± 229.4 | –82.1 ± 228.9 | 0.131 | 0.844 | 0.942 |
| Phosphorus (mg) | 1,313.0 ± 594.9 | 1,203.8 ± 398.3 | –109.3 ± 641.4 | 0.504 | 1,219.2 ± 463.8 | 1,033.6 ± 501.7 | –185.6 ± 446.3 | 0.070 | 0.281 | 0.745 |
| Total iron (mg) | 16.6 ± 8.2 | 15.0 ± 5.4 | –1.5 ± 8.4 | 0.482 | 15.1 ± 5.0 | 12.7 ± 6.2 | –2.4 ± 6.3 | 0.077 | 0.219 | 0.801 |
| Heme iron (mg) | 1.7 ± 1.6 | 1.4 ± 0.7 | –0.3 ± 1.6 | 0.731 | 1.3 ± 1.1 | 1.3 ± 1.1 | –0.03 ± 1.1 | 0.383 | 0.605 | 0.488 |
| Non-heme iron (mg) | 14.9 ± 7.1 | 13.6 ± 5.0 | –1.2 ± 7.3 | 0.498 | 13.8 ± 4.3 | 11.4 ± 5.3 | –2.3 ± 5.8 | 0.075 | 0.219 | 0.662 |
| Sodium (mg) | 3,801.3 ± 1,915.5 | 3,838.0 ± 1,476.4 | 36.6 ± 2,027.2 | 0.676 | 3,338.4 ± 1,299.4 | 3,319.9 ± 1,883.4 | –18.5 ± 1,708.4 | 0.588 | 0.219 | 0.994 |
| Potassium (mg) | 3,743.9 ± 1,876.5 | 3,256.4 ± 1,192.3 | –487.5 ± 1,879.5 | 0.234 | 3,557.5 ± 1,290.3 | 2,561.3 ± 1,231.3 | –996.2 ± 1,736.0 | 0.027 | 0.149 | 0.415 |
| Vitamin A (μg/RE) | 844.4 ± 451.7 | 699.2 ± 326.6 | –154.2 ± 437.2 | 0.080 | 757.9 ± 324.3 | 594.7 ± 343.2 | –163.2 ± 407.6 | 0.052 | 0.620 | 0.924 |
| Retinol (μg) | 155.9 ± 77.2 | 149.6 ± 91.1 | –6.3 ± 89.9 | 0.447 | 146.3 ± 84.2 | 132.2 ± 74.6 | –14.1 ± 67.2 | 0.538 | 0.590 | 0.742 |
| Carotene (μg) | 3,948.7 ± 2,371.8 | 3,064.4 ± 1,541.9 | –884.3 ± 2,198.8 | 0.036 | 3,469.4 ± 1,724.7 | 2,530.0 ± 1,539.2 | –939.4 ± 2,227.6 | 0.051 | 0.605 | 0.953 |
| Thiamin (mg) | 2.4 ± 1.1 | 2.1 ± 0.8 | –0.3 ± 1.1 | 0.130 | 2.1 ± 0.7 | 1.8 ± 1.0 | –0.3 ± 1.0 | 0.093 | 0.311 | 0.992 |
| Riboflavin (mg) | 1.9 ± 0.8 | 1.7 ± 0.7 | –0.2 ± 0.9 | 0.214 | 1.7 ± 0.7 | 1.6 ± 0.9 | –0.1 ± 0.6 | 0.225 | 0.812 | 0.995 |
| Niacin (mg) | 17.4 ± 9.5 | 15.5 ± 5.3 | –1.9 ± 9.5 | 0.479 | 16.2 ± 6.0 | 14.1 ± 8.6 | –2.1 ± 8.1 | 0.092 | 0.189 | 0.903 |
| Vitamin C (mg) | 207.1 ± 177.0 | 145.0 ± 185.0 | –62.1 ± 231.1 | 0.010 | 202.9 ± 199.8 | 98.6 ± 69.4 | –104.4 ± 229.7 | 0.020 | 0.897 | 0.265 |
Table 1. Characteristics of Korean pregnant women carrying singletons or multiples assessed at delivery
Mean ± SD or n (%). BMI, body mass index. Statistical analyses were performed with a significance level of
Table 2. Mean intakes of food groups and nutrients of Korean pregnant women carrying singletons or multiples during the third trimester of pregnancy
Mean ± SD. SFA, saturated fatty acids; MUFA, mono-unsaturated fatty acids; PUFA, poly-unsaturated fatty acids.
Table 3. Mean food group intakes during the third trimester of pregnancy in singleton- and multiple-pregnancy mothers
Mean ± SD. Student’s t-test or the Mann–Whitney U test was applied to compare food group intake between groups. General linear model was applied and adjusted for pre-pregnancy body mass index, age, and length of gestation.
Table 4. Mean nutrient intakes from foods during the third trimester of pregnancy of mothers carrying singletons or multiples
Mean ± SD. SFA, saturated fatty acids; MUFA, mono-unsaturated fatty acids; PUFA, poly-unsaturated fatty acids. Student’s t-test or the Mann–Whitney U test was applied to compare intakes. General linear model was applied and adjusted for pre-pregnancy body mass index, age, and length of gestation.
Table 5. Characteristics of participants with follow-up
Mean ± SD. BMI, body mass index. A mother was classified as breastfeeding if her breastfeeding duration was ≥ 3 weeks. Student’s t test, the Mann–Whitney U test, or the Chi-squared test were applied to compare characteristics between breastfeeding and non-breastfeeding mothers.
Table 6. Changes in food group intakes from the third trimester of pregnancy to postpartum according to breastfeeding status
Mean ± SD. The paired t-test or Wilcoxon’s signed-rank test were applied to compare intakes between the third trimester of pregnancy and after delivery. Student’s t-test or the Mann–Whitney U test was applied to compare changes in intakes between groups. General linear model was applied and adjusted for maternal age, body mass index at delivery, and number of fetuses.
Table 7. Changes in nutrient intake from food from the third trimester of pregnancy to postpartum according to breastfeeding status
Mean ± SD. SFA, saturated fatty acids; MUFA, mono-unsaturated fatty acids; PUFA, poly-unsaturated fatty acids. The paired t-test or Wilcoxon’s signed-rank test were applied to compare intakes between the third trimester of pregnancy and after delivery. Student’s t-test or the Mann–Whitney U test was applied to compare changes in intakes between groups. General linear model was applied and adjusted for maternal age, body mass index at delivery, and number of fetuses.


