
Articles
- Page Path
- HOME > Korean J Community Nutr > Volume 30(6); 2025 > Article
-
Research Article
- Nutrition Quotient and nutrient intake among older adults in a rural Korean community: a cross-sectional study
-
Ji-Sook Park1),*
 , Hyeon-Mi Bae2),*, Jung-Eun Yim1),2),†
 -
Korean Journal of Community Nutrition 2025;30(6):397-409.
DOI: https://doi.org/10.5720/kjcn.2025.00283
Published online: December 31, 2025
1)Department of Food and Nutrition, Changwon National University, Changwon, Korea
2)Interdisciplinary Program in Senior Human Ecology, Changwon National University, Changwon, Korea
- †Corresponding author: Jung-Eun Yim Department of Food and Nutrition, Changwon National University, 20 Changwondaehak-ro, Uichang-gu, Changwon 51140, Korea Tel: +82-55-213-3517 Fax: +82-55-281-7480 Email: jeyim@changwon.ac.kr
• Received: September 25, 2025 • Revised: October 28, 2025 • Accepted: November 6, 2025
© 2025 The Korean Society of Community Nutrition
This is an Open-Access article distributed under the terms of the Creative Commons Attribution Non-Commercial License (http://creativecommons.org/licenses/by-nc/4.0) which permits unrestricted non-commercial use, distribution, and reproduction in any medium, provided the original work is properly cited.
- 984 Views
- 34 Download
Abstract
-
Objectives
- Korea is experiencing rapid population aging, with older adults forming a large proportion of rural communities. Aging leads to physiological and functional declines, resulting in lower physical activity, poor diet quality, and higher risk of chronic diseases. Although the Nutrition Quotient for the Elderly (NQ-E) is a validated tool to assess dietary quality, few studies have applied it to rural populations. This study aimed to compare nutrient intake and NQ-E scores by age and sex and examine their associations with lifestyle factors.
-
Methods
- This study investigated the relationship between nutrient intake and NQ-E scores among older adults in rural Korean community, considering age, sex, and lifestyle factors. A cross-sectional study was conducted with 79 community-dwelling older adults (24 male and 55 female; mean age: 76.3 years) residing in Geochang-gun, Gyeongsangnam-do, Korea. Participants were recruited from community centers and health posts between June 2024 and December 2024. Data collection included general characteristics, 24-hour dietary recalls, and NQ-E questionnaires.
-
Results
- Female aged > 75 years had significantly lower intakes of energy, protein, fat, vitamin E, riboflavin, folate, and zinc than their male counterparts (P < 0.05). The mean NQ-E score was 55.01, which was lower than the national average reported for urban older adults (57.6). Participants with higher NQ-E grades had significantly higher intakes of dietary fiber, vitamin A, thiamine, riboflavin, niacin, potassium, and magnesium, and regular physical activity and dietary supplement use were positively associated with higher NQ-E grades (P < 0.01).
-
Conclusion
- These findings suggest that older female in rural communities are particularly vulnerable to inadequate nutrient intake and lower dietary quality, and that the NQ-E is a useful screening tool for identifying nutritional risk in this population. Community-based nutrition interventions promoting physical activity, supplement use, and dietary diversity are warranted to improve dietary quality and support healthy aging.
INTRODUCTION
METHODS
RESULTS
DISCUSSION
-
CONFLICT OF INTEREST
There are no financial or other issues that might lead to conflict of interest.
-
FUNDING
This work was supported by the National Research Foundation of Korea (NRF) grant funded by the Korea government (MSIT) (No. RS-2023-00242278).
-
DATA AVAILABILITY
Research data is available upon request to the corresponding author.
NOTES
Fig. 1.Comparison of mean percentages of dietary reference intakes for Korean (KDRI) by age and sex. *The four groups showed significant differences in the ratio of nutrient intake relative to the KDRI.
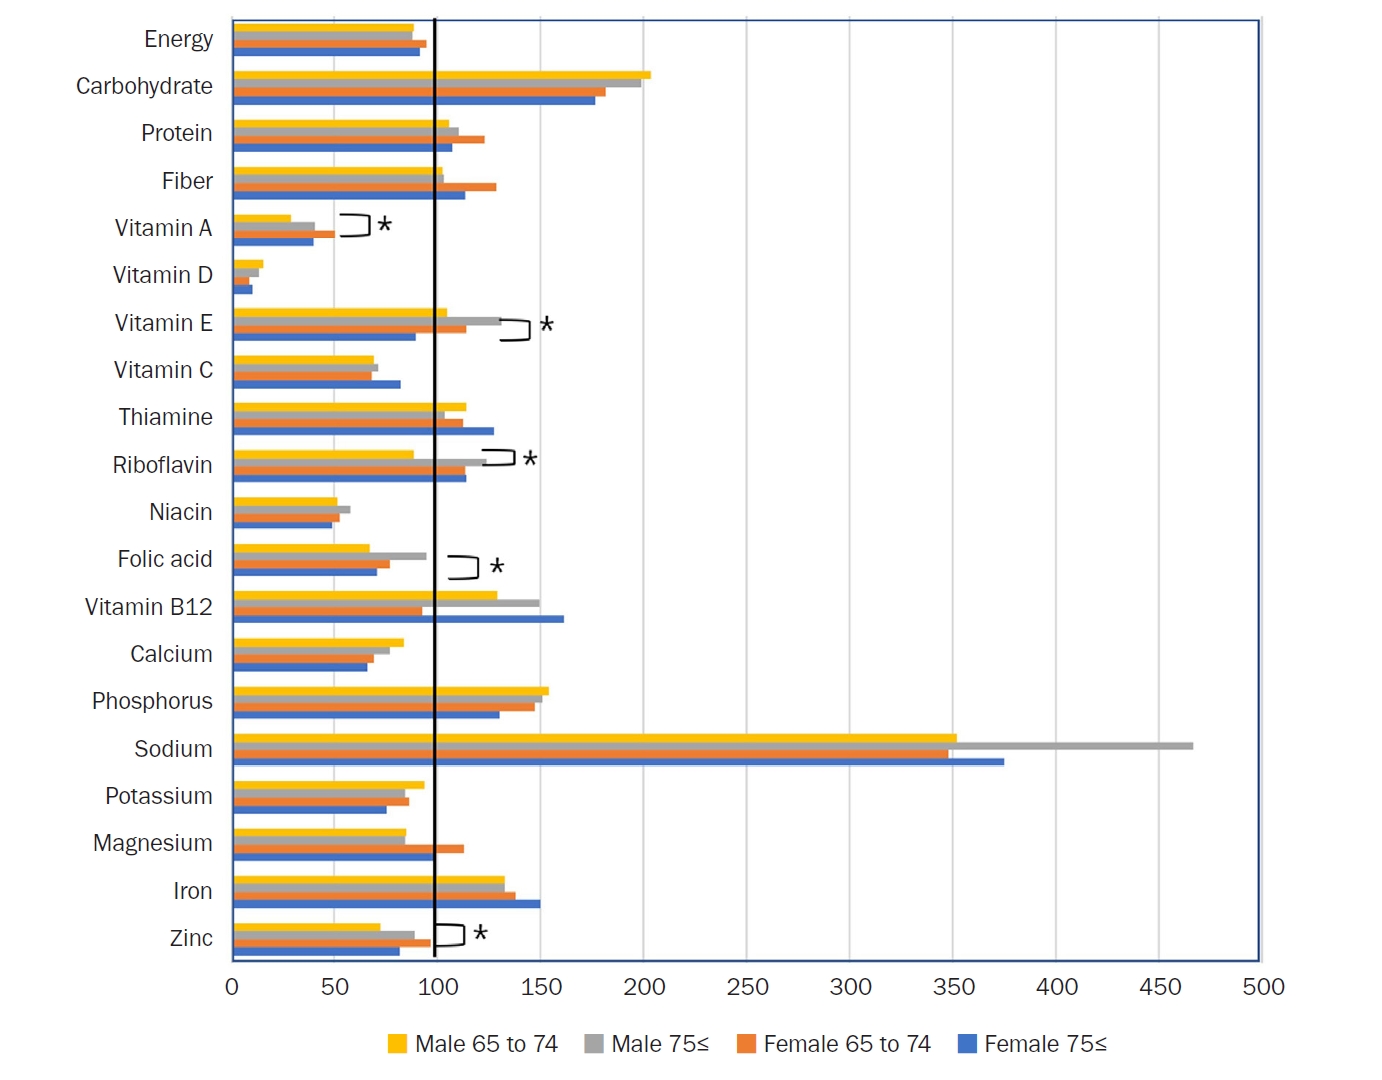
Table 1.General characteristics of participants
Table 2.Daily nutrient intake in participants by age and sex
| Variables | Total (n = 79) | Male (n = 24) | P-value1) | Female (n = 55) | P-value2) | P-value3) | P-value4) | ||
|---|---|---|---|---|---|---|---|---|---|
| Young adults (n = 13) | Older adults (n = 11) | Young adults (n = 22) | Older adults (n = 33) | ||||||
| Energy (kcal) | 1,515.63 ± 420.44 | 1,761.47 ± 475.77 | 1,667.27 ± 374.10 | 0.60 | 1,511.33 ± 448.08 | 1,371.11 ± 341.30 | 0.19 | 0.13 | 0.02 |
| Carbohydrate (g) | 241.08 ± 67.45 | 264.49 ± 95.63 | 258.34 ± 54.66 | 0.85 | 236.00 ± 70.12 | 229.50 ± 54.94 | 0.70 | 0.32 | 0.14 |
| Protein (g) | 59.01 ± 20.81 | 63.45 ± 18.86 | 65.98 ± 21.47 | 0.17 | 61.30 ± 25.4 | 53.42 ± 17.09 | 0.76 | 0.15 | 0.02 |
| Fat (g) | 59.02 ± 20.81 | 63.46 ± 18.86 | 65.99 ± 21.47 | 0.76 | 61.30 ± 25.46 | 53.43 ± 17.10 | 0.17 | 0.79 | 0.05 |
| Energy distribution | |||||||||
| % Carbohydrate | - | 60.21 ± 10.98 | 62.68 ± 7.55 | 0.53 | 63.21 ± 9.10 | 67.57 ± 7.81 | 0.06 | 0.39 | 0.08 |
| % Protein | - | 20.90 ± 6.44 | 19.85 ± 6.74 | 0.70 | 19.02 ± 6.42 | 16.05 ± 6.23 | 0.07 | 0.46 | 0.09 |
| % Fat | - | 14.62 ± 2.82 | 15.64 ± 2.60 | 0.37 | 15.97 ± 3.24 | 15.53 ± 2.85 | 0.60 | 0.22 | 0.91 |
| Fiber (g) | 24.42 ± 9.92 | 25.55 ± 12.51 | 25.73 ± 9.10 | 0.97 | 25.71 ± 10.43 | 22.69 ± 8.85 | 0.25 | 0.97 | 0.33 |
| Vitamin A (μg RAE) | 257.79 ± 158.50 | 203.51 ± 140.08 | 282.16 ± 163.85 | 0.22 | 302.30 ± 173.91 | 241.39 ± 150.32 | 0.17 | 0.09 | 0.45 |
| Vitamin D (μg) | 1.64 ± 1.89 | 2.29 ± 2.48 | 2.01 ± 1.75 | 0.76 | 1.28 ± 1.64 | 1.50 ± 1.83 | 0.65 | 0.16 | 0.42 |
| Vitamin E (mg) | 12.53 ± 6.44 | 12.56 ± 6.26 | 15.70 ± 8.22 | 0.30 | 13.66 ± 6.83 | 10.70 ± 5.19 | 0.07 | 0.64 | 0.02 |
| Vitamin C (mg) | 74.48 ± 44.89 | 68.86 ± 50.92 | 71.35 ± 36.83 | 0.89 | 68.14 ± 46.24 | 81.97 ± 44.84 | 0.27 | 0.97 | 0.48 |
| Thiamine (mg) | 1.10 ± 0.40 | 1.25 ± 0.49 | 1.14 ± 0.32 | 0.52 | 1.12 ± 0.43 | 1.02 ± 0.35 | 0.31 | 0.42 | 0.31 |
| Riboflavin (mg) | 1.25 ± 0.51 | 1.24 ± 0.44 | 1.61 ± 0.55 | 0.08 | 1.25 ± 0.45 | 1.14 ± 0.54 | 0.43 | 0.93 | 0.02 |
| Niacin (mg NE) | 6.57 ± 3.40 | 7.20 ± 4.48 | 7.50 ± 3.23 | 0.86 | 6.80 ± 3.15 | 5.86 ± 3.15 | 0.28 | 0.75 | 0.14 |
| Folic acid (μg DFE) | 300.66 ± 149.11 | 267.62 ± 120.89 | 379.12 ± 163.33 | 0.07 | 307.65 ± 186.80 | 282.85 ± 120.66 | 0.55 | 0.49 | 0.04 |
| Vitamin B12 (μg) | 3.24 ± 5.63 | 3.10 ± 2.97 | 3.59 ± 2.45 | 0.67 | 2.22 ± 1.90 | 3.87 ± 8.28 | 0.36 | 0.29 | 0.91 |
| Calcium (mg) | 545.87 ± 273.93 | 585.81 ± 335.29 | 539.79 ± 209.41 | 0.70 | 552.67 ± 224.11 | 527.63 ± 305.05 | 0.74 | 0.73 | 0.90 |
| Phosphorus (mg) | 992.06 ± 315.90 | 1,079.64 ± 340.97 | 1,055.69 ± 334.05 | 0.86 | 1,030.16 ± 322.02 | 910.95 ± 290.57 | 0.16 | 0.67 | 0.17 |
| Sodium (mg) | 4,451.17 ± 1,965.99 | 4,578.45 ± 2,038.26 | 5,135.32 ± 1,578.63 | 0.47 | 4,520.27 ± 2,620.29 | 4,126.92 ± 1,516.42 | 0.48 | 0.95 | 0.06 |
| Potassium (mg) | 2,892.98 ± 1,112.79 | 3,274.20 ± 1,353.47 | 2,941.71 ± 871.86 | 0.49 | 3,027.44 ± 1,234.83 | 2,636.92 ± 976.37 | 0.20 | 0.58 | 0.36 |
| Magnesium (mg) | 297.73 ± 144.27 | 312.98 ± 143.63 | 310.71 ± 121.58 | 0.97 | 315.88 ± 192.39 | 275.29 ± 114.85 | 0.33 | 0.96 | 0.39 |
| Iron (mg) | 11.06 ± 4.21 | 11.93 ± 5.16 | 11.92 ± 4.01 | 0.99 | 11.01 ± 4.48 | 10.47 ± 3.77 | 0.63 | 0.58 | 0.28 |
| Zinc (mg) | 6.45 ± 2.95 | 6.49 ± 2.38 | 8.00 ± 4.20 | 0.28 | 6.75 ± 2.44 | 5.71 ± 2.87 | 0.17 | 0.76 | 0.04 |
Table 3.Comparison of balance, moderation, dietary practice, and NQ-E score across age and sex groups
| Variables | Total (n = 79) | Male (n = 24) | P-value1) | Female (n = 55) | P-value2) | P-value3) | P-value4) | ||
|---|---|---|---|---|---|---|---|---|---|
| Young adults (n = 13) | Older adults (n = 11) | Young adults (n = 22) | Older adults (n = 33) | ||||||
| NQ-E score | 54.34 ± 12.98 | 54.98 ± 17.23 | 51.74 ± 12.58 | 0.61 | 58.62 ± 10.86 | 52.09 ± 12.33 | 0.05 | 0.45 | 0.93 |
| Balance | 44.50 ± 16.57 | 43.29 ± 19.63 | 42.04 ± 16.41 | 0.87 | 49.51 ± 15.83 | 42.45 ± 15.86 | 0.11 | 0.31 | 0.94 |
| Moderation | 52.62 ± 30.48 | 49.05 ± 41.15 | 49.41 ± 25.27 | 0.98 | 65.43 ± 29.57 | 46.54 ± 26.40 | 0.02 | 0.18 | 0.75 |
| Practice | 70.30 ± 12.96 | 75.07 ± 14.32 | 67.65 ± 14.15 | 0.22 | 70.99 ± 11.01 | 68.84 ± 13.28 | 0.53 | 0.35 | 0.80 |
| Grade | |||||||||
| Upper grade | 28 (35.4) | 5 (38.5) | 2 (18.2) | 0.43 | 12 (54.5) | 9 (27.3) | 0.03 | 0.10 | 0.75 |
| Moderate grade | 33 (41.8) | 4 (30.8) | 6 (54.5) | 9 (40.9) | 14 (42.4) | ||||
| Low grade | 18 (22.8) | 4 (30.8) | 3 (27.3) | 1 (4.5) | 10 (30.3) | ||||
| χ2 value | 0.14 | 1.56 | 4.42 | 0.14 | |||||
Table 4.Comparison of NQ-E scores for each item by age and sex of the participants
| Item | Variables | Male (n = 24) | P-value1) | Female (n = 55) | P-value2) | P-value3) | P-value4) | ||
|---|---|---|---|---|---|---|---|---|---|
| Young adults (n = 13) | Older adults (n = 11) | Young adults (n = 22) | Older adults (n = 33) | ||||||
| Balance (8) | Intake frequency of fruits | 30.77 ± 35.58 | 34.09 ± 23.11 | 0.79 | 59.09 ± 35.81 | 43.94 ± 32.49 | 0.11 | 0.03 | 0.28 |
| Intake frequency of milk or dairy products | 21.15 ± 30.36 | 25.00 ± 33.54 | 0.77 | 34.09 ± 30.42 | 40.15 ± 37.47 | 0.51 | 0.23 | 0.24 | |
| Intake frequency of fish or shellfish | 40.38 ± 19.20 | 45.45 ± 18.77 | 0.52 | 35.23 ± 23.98 | 37.88 ± 26.61 | 0.71 | 0.51 | 0.31 | |
| Intake frequency of eggs | 75.00 ± 32.27 | 63.64 ± 37.69 | 0.43 | 63.64 ± 32.48 | 52.27 ± 35.56 | 0.23 | 0.32 | 0.37 | |
| Intake frequency of beans or bean products | 51.92 ± 36.03 | 61.36 ± 30.34 | 0.50 | 38.64 ± 33.39 | 49.24 ± 39.27 | 0.30 | 0.28 | 0.36 | |
| Intake frequency of nuts | 23.08 ± 34.55 | 20.45 ± 26.97 | 0.84 | 34.09 ± 42.64 | 11.36 ± 25.84 | 0.03 | 0.44 | 0.32 | |
| Intake frequency of cooked rice with mixed grains | 55.77 ± 46.94 | 29.55 ± 36.77 | 0.15 | 72.73 ± 37.72 | 52.27 ± 45.66 | 0.08 | 0.25 | 0.11 | |
| Intake frequency of water | 75.00 ± 30.62 | 75.00 ± 22.36 | ≥ 0.99 | 67.05 ± 23.64 | 68.18 ± 24.43 | 0.86 | 0.39 | 0.42 | |
| Moderation (2) | Intake frequency of sweetened snacks or beverages | 46.15 ± 45.47 | 45.45 ± 29.19 | 0.96 | 64.77 ± 33.33 | 44.70 ± 29.82 | 0.02 | 0.17 | 0.94 |
| Intake frequency of greasy baked products or snacks | 71.15 ± 35.13 | 79.55 ± 21.85 | 0.50 | 70.45 ± 35.05 | 60.61 ± 32.49 | 0.29 | 0.95 | 0.08 | |
| Practice (7) | Efforts to have healthy eating habits | 63.46 ± 26.25 | 59.09 ± 30.15 | 0.71 | 72.73 ± 29.79 | 60.61 ± 22.56 | 0.09 | 0.36 | 0.86 |
| Checking of expiration date and nutrition labeling | 67.31 ± 35.92 | 65.91 ± 30.15 | 0.92 | 86.36 ± 21.45 | 66.67 ± 34.04 | 0.01 | 0.06 | 0.95 | |
| Washing hands practices before eating meals | 90.38 ± 21.74 | 86.36 ± 17.19 | 0.62 | 97.73 ± 10.66 | 91.67 ± 18.40 | 0.13 | 0.19 | 0.40 | |
| Difficulty in chewing foods | 78.85 ± 26.70 | 63.64 ± 30.34 | 0.20 | 75.00 ± 29.88 | 62.88 ± 32.55 | 0.17 | 0.70 | 0.95 | |
| Depressive condition | 76.92 ± 25.94 | 65.91 ± 28.00 | 0.33 | 62.50 ± 31.58 | 69.70 ± 30.46 | 0.40 | 0.17 | 0.72 | |
| Degree of sound sleep | 75.00 ± 27.00 | 65.91 ± 23.11 | 0.39 | 62.50 ± 32.50 | 74.24 ± 28.29 | 0.16 | 0.25 | 0.38 | |
| Level of awareness of one’s own health | 73.08 ± 16.01 | 68.18 ± 16.17 | 0.46 | 53.41 ± 19.36 | 59.85 ± 21.60 | 0.26 | 0.01 | 0.19 | |
Table 5.Daily nutrient intake based on NQ-E grade in participants
| Variables | Total (n = 79) | NQ-E grade | P-value | ||
|---|---|---|---|---|---|
| Upper (n = 28) | Moderate (n = 33) | Low (n = 18) | |||
| Energy (kcal) | 1,515.63 ± 420.44 | 1,582.06 ± 385.97 | 1,508.89 ± 399.68 | 1,424.66 ± 507.57 | 0.47 |
| Carbohydrate (g) | 241.08 ± 67.45 | 240.50 ± 60.06 | 241.53 ± 58.75 | 241.16 ± 92.98 | 0.99 |
| Protein (g) | 59.01 ± 20.81 | 65.48 ± 20.91 | 57.58 ± 20.80 | 51.15 ± 18.36 | 0.06 |
| Fat (g) | 59.02 ± 20.81 | 65.34 ± 21.28 | 57.95 ± 20.59 | 51.16 ± 18.36 | 0.07 |
| Fiber (g) | 24.42 ± 9.92 | 28.68 ± 10.00a | 22.05 ± 8.36c | 22.16 ± 10.70b | 0.02 |
| Vitamin A (μg RAE) | 257.79 ± 158.50 | 326.57 ± 152.15a | 245.99 ± 161.39b | 172.45 ± 117.04c | 0.01 |
| Vitamin D (μg) | 1.64 ± 1.89 | 1.04 ± 1.31a | 1.66 ± 1.76ab | 2.54 ± 2.52b | 0.03 |
| Vitamin E (mg) | 12.53 ± 6.44 | 14.12 ± 6.20 | 12.21 ± 6.73 | 10.63 ± 5.99 | 0.19 |
| Vitamin C (mg) | 74.48 ± 44.89 | 84.62 ± 41.12 | 68.32 ± 47.36 | 69.99 ± 45.52 | 0.33 |
| Thiamine (mg) | 1.10 ± 0.40 | 1.24 ± 0.47a | 1.08 ± 0.31b | 0.93 ± 0.34c | 0.02 |
| Riboflavin (mg) | 1.25 ± 0.51 | 1.45 ± 0.42a | 1.22 ± 0.56b | 1.01 ± 0.47c | 0.01 |
| Niacin (mg NE) | 6.57 ± 3.40 | 7.48 ± 3.35a | 6.81 ± 3.43b | 4.71 ± 2.85c | 0.02 |
| Folic acid (μg DFE) | 300.66 ± 149.11 | 350.63 ± 160.02 | 284.90 ± 135.42 | 251.82 ± 140.38 | 0.06 |
| Vitamin B12 (μg) | 3.24 ± 5.63 | 3.73 ± 8.68 | 2.67 ± 2.28 | 3.53 ± 3.88 | 0.75 |
| Calcium (mg) | 545.87 ± 273.93 | 636.46 ± 310.16 | 484.90 ± 255.08 | 516.72 ± 217.71 | 0.08 |
| Phosphorus (mg) | 992.06 ± 315.90 | 1,092.84 ± 270.65 | 962.29 ± 331.28 | 889.88 ± 324.72 | 0.08 |
| Sodium (mg) | 4,451.17 ± 1,965.99 | 4,742.14 ± 2,178.69 | 4,397.21 ± 1,847.47 | 4,097.50 ± 1,868.94 | 0.55 |
| Potassium (mg) | 2,892.98 ± 1,112.79 | 3,351.06 ± 1,219.59a | 2,662.15 ± 891.34b | 2,603.61 ± 1,134.05c | 0.02 |
| Magnesium (mg) | 297.73 ± 144.27 | 358.17 ± 177.60a | 260.58 ± 98.62c | 271.82 ± 132.99b | 0.02 |
| Iron (mg) | 11.06 ± 4.21 | 12.54 ± 4.32 | 10.42 ± 3.85 | 9.94 ± 4.25 | 0.06 |
| Zinc (mg) | 6.45 ± 2.95 | 7.22 ± 2.51 | 6.48 ± 3.37 | 5.20 ± 2.44 | 0.07 |
Mean ± SD.
NQ-E, Nutrition Quotient for the Elderly; NQ, Nutrition Quotient; μg RAE, micrograms of retinol activity equivalents; mg NE, milligrams of niacin equivalents; μg DFE, micrograms of dietary folate equivalents.
a–cDifferent superscript letters within the same row indicate significant differences among groups at P < 0.05 by the Kruskal–Wallis test with Dunn’s post-hoc test.
Table 6.Analysis of NQ-E grade distribution according to general characteristics
- 1. Shrivastava SR, Shrivastava PS, Ramasamy J. Health-care of elderly: determinants, needs and services. Int J Prev Med 2013; 4(10): 1224-1225. PubMedPMC
- 2. Ministry of Data and Statistics. 2024 Statistics on the elderly [Internet]. Statistics Korea; 2024 [cited 2025 Aug 10]. Available from: https://kostat.go.kr/board.es?mid=a10301010000&bid=10820&act=view&list_no=432917
- 3. Hong J, Yi S, Yoon T. The impact of the COVID-19 pandemic on life expectancy by the level of area deprivation in South Korea. Front Public Health 2023; 11: 1215914.ArticlePubMedPMC
- 4. Tak YJ, Lee JG, Yi YH, Kim YJ, Lee S, Cho BM, et al. Association of handgrip strength with dietary intake in the Korean population: findings based on the Seventh Korea National Health and Nutrition Examination Survey (KNHANES VII-1), 2016. Nutrients 2018; 10(9): 1180.ArticlePubMedPMC
- 5. Kim EK, Kim H, Vijayakumar A, Kwon O, Chang N. Associations between fruit and vegetable, and antioxidant nutrient intake and age-related macular degeneration by smoking status in elderly Korean men. Nutr J 2017; 16(1): 77.ArticlePubMedPMCPDF
- 6. Kim TS, Chung JW. Associations of dietary riboflavin, niacin, and retinol with age-related hearing loss: an analysis of Korean National Health and Nutrition Examination Survey data. Nutrients 2019; 11(4): 896.ArticlePubMedPMC
- 7. Bruins MJ, Van Dael P, Eggersdorfer M. The role of nutrients in reducing the risk for noncommunicable diseases during aging. Nutrients 2019; 11(1): 85.ArticlePubMedPMC
- 8. Wu J, Zhang H, Shao J, Chen D, Xue E, Huang S, et al. Healthcare for older adults with multimorbidity: a scoping review of reviews. Clin Interv Aging 2023; 18: 1723-1735. ArticlePubMedPMCLink
- 9. GBD 2017 Diet Collaborators. Health effects of dietary risks in 195 countries, 1990-2017: a systematic analysis for the Global Burden of Disease Study 2017. Lancet 2019; 393(10184): 1958-1972. PubMedPMC
- 10. Kim HR. Quality of diet and nutritional intake and mortality risk among South Korean adults based on 12-year follow-up data. Korean J Community Nutr 2016; 21(4): 354-365. ArticleLink
- 11. Kheirouri S, Alizadeh H. Dietary diversity and cognitive performance in older adults: a systematic review. BMC Neurol 2025; 25(1): 144.ArticlePubMedPMCPDF
- 12. Sustainable Development Goals. Korea SDG indicator 2.1.1 - proportion of undernourished population [Internet]. Statistics Korea; 2025 [cited 2025 Sep 01]. Available from: https://kostat-sdg-kor.github.io/sdg-indicators/2-1-1/
- 13. Bloom I, Edwards M, Jameson KA, Syddall HE, Dennison E, Gale CR, et al. Influences on diet quality in older age: the importance of social factors. Age Ageing 2017; 46(2): 277-283. ArticlePubMedPMC
- 14. Host A, McMahon AT, Walton K, Charlton K. Factors influencing food choice for independently living older people-a systematic literature review. J Nutr Gerontol Geriatr 2016; 35(2): 67-94. ArticlePubMed
- 15. Lee Y, Choi Y, Park HR, Song KH, Lee KE, Yoo CH, et al. Comparative analysis of dietary behavior and nutrient intake of elderly in urban and rural areas for development of “Village Lunch Table” program: based on 2014 Korea National Health and Nutrition Examination Survey data. J Nutr Health 2017; 50(2): 171-179. ArticleLink
- 16. Ha K, Song Y, Kim HK. Regional disparities in the associations of cardiometabolic risk factors and healthy dietary factors in Korean adults. Nutr Res Pract 2020; 14(5): 519-531. ArticlePubMedPMCLink
- 17. Son S, Lee HS. The characteristics of population distribution and change in rural areas: 1995-2020. J Korean Geogr Soc 2021; 56(6): 607-622.
- 18. Hong N, Kim KJ, Lee SJ, Kim CO, Kim HC, Rhee Y, et al. Cohort profile: Korean Urban Rural Elderly (KURE) study, a prospective cohort on ageing and health in Korea. BMJ Open 2019; 9(10): e031018. ArticlePubMedPMC
- 19. Chung MJ, Kwak TK, Kim HY, Kang MH, Lee JS, Chung HR, et al. Development of NQ-E, Nutrition Quotient for Korean elderly: item selection and validation of factor structure. J Nutr Health 2018; 51(1): 87-102. ArticleLink
- 20. Lim YS, Lee JS, Hwang JY, Kim KN, Hwang HJ, Kwon S, et al. Revision of Nutrition Quotient for Elderly in assessment of dietary quality and behavior. J Nutr Health 2022; 55(1): 155-173. ArticleLink
- 21. Park EO. A comparison of community health status by region and an investigation of related factors using community health indicators. J Korean Acad Community Health Nurs 2012; 23(1): 31-39. Article
- 22. Lee JH. The regional health inequity, and individual and neighborhood level health determinants. Health Soc Welf Rev 2016; 36(2): 345-384. Article
- 23. Kim DJ. Socioeconomic status, area deprivation and health behavior gaps. Health Welf Policy Forum 2018; 260: 30-38.
- 24. World Health Organization (WHO). WHO guidelines on physical activity and sedentary behavior. WHO; 2020.
- 25. Ahn Y, Lee Y, Park H, Song K. Gender and age group differences in nutrition intake and dietary quality of Korean adults eating alone: based on Korean National Health and Nutrition Examination Survey Data, 2013-2016. Nutr Res Pract 2021; 15(1): 66-79. ArticlePubMedLink
- 26. Yi NY, Choi JH. Evaluation of the nutrient quotient for the elderly (NQ-E) using congregate meal services according to their oral health conditions. Nutr Res Pract 2022; 16(5): 628-645. ArticlePubMedPMCLink
- 27. Gang G, Lee MJ, Choi EH, Lee HL, Lee HY, Chang HJ, et al. Evaluation on the Nutrition Quotient scores of elderly people living alone in Korea. Nutrients 2023; 15(17): 3750.ArticlePubMedPMC
- 28. Ramic E, Pranjic N, Batic-Mujanovic O, Karic E, Alibasic E, Alic A. The effect of loneliness on malnutrition in elderly population. Med Arh 2011; 65(2): 92-95. PubMed
- 29. Ahn Y, Lee Y, Park H, Song K. Gender and age group differences in nutrition intake and dietary quality of Korean adults eating alone: based on Korean National Health and Nutrition Examination Survey data, 2013-2016. Nutr Res Pract 2021; 15(1): 66-79. ArticlePubMedLink
- 30. Clegg ME, Godfrey A. The relationship between physical activity, appetite and energy intake in older adults: a systematic review. Appetite 2018; 128: 145-151. ArticlePubMed
- 31. Jang W, Kim M, Kim Y. Association between living alone with frailty among elderly Korean men. J Nutr Health 2025; 58(1): 77-86. ArticleLink
- 32. Deng C, Vicerra PMM. Household structure and dietary diversity among older adults in rural and urban China: a cross-sectional study. BMC Public Health 2024; 24(1): 3004.ArticlePubMedPMCPDF
- 33. Shim JE, Kim SJ, Kim K, Hwang JY. Spatial disparity in food environment and household economic resources related to food insecurity in rural Korean households with older adults. Nutrients 2018; 10(10): 1514.ArticlePubMedPMC
- 34. Kim H, Park SG. Effect of a single multi-vitamin and mineral supplement on nutritional intake in Korean Elderly: Korean National Health and Nutrition Examination Survey 2018-2020. Nutrients 2023; 15(7): 1561.ArticlePubMedPMC
REFERENCES
Figure & Data
REFERENCES
Citations
Citations to this article as recorded by 
 Cite
Cite- Figure
-
- We recommend
- Related articles
-
- A needs assessment for the development of a digital-based self-nutrition management education program for older adults in Korea: a cross-sectional study
- Psychosocial factors related to the stages of change in reducing sugar intake among adults in Seoul, Korea: a cross-sectional study
- A comparative study on nutritional status and diet-related subjective perceptions according to free meal service utilization among older adults living alone in Korea: a cross-sectional study
- The association between sodium index and the risk of obesity in Korean and Chinese university students: a cross-sectional study
- Associations between diet quality and regional factors in Korea vary according to individuals’ characteristics: a cross-sectional study
Nutrition Quotient and nutrient intake among older adults in a rural Korean community: a cross-sectional study

Fig. 1. Comparison of mean percentages of dietary reference intakes for Korean (KDRI) by age and sex. *The four groups showed significant differences in the ratio of nutrient intake relative to the KDRI.
Fig. 1.
Nutrition Quotient and nutrient intake among older adults in a rural Korean community: a cross-sectional study
| Variable | Value |
|---|---|
| Sex | |
| Male | 24 (30.4) |
| Female | 55 (69.6) |
| Age (year) | 76.33 ± 6.54 |
| 65–74 | 35 (44.3) |
| ≥ 75 | 44 (55.7) |
| Regular exercise | |
| Do exercise | 46 (58.2) |
| Do not exercise | 33 (41.8) |
| Smoking | |
| Yes | 8 (10.1) |
| No | 71 (89.9) |
| Married | |
| Yes | 78 (98.7) |
| No | 1 (1.3) |
| Employment | |
| Yes | 58 (73.4) |
| No | 21 (26.6) |
| Housemate | |
| With family | 49 (62.0) |
| Alone | 30 (38.0) |
| Change in body weight (3 months) | |
| Yes | 14 (17.7) |
| No | 65 (82.3) |
| Food allergy | |
| ≥ 1 | 4 (5.1) |
| 0 | 75 (94.9) |
| Supplement intake | |
| ≥ 1 | 51 (64.6) |
| 0 | 28 (35.4) |
| Medical history (multiple responses) | |
| None | 7 (8.9) |
| Cardiovascular diseases | 9 (11.4) |
| Arteriosclerosis | 1 (1.2) |
| Hypertension | 50 (63.3) |
| Dyslipidemia | 27 (34.1) |
| Diabetes mellitus | 18 (22.8) |
| Gastrointestinal diseases | 5 (6.3) |
| Respiratory diseases | 4 (5.1) |
| Variables | Total (n = 79) | Male (n = 24) | P-value |
Female (n = 55) | P-value |
P-value |
P-value |
||
|---|---|---|---|---|---|---|---|---|---|
| Young adults (n = 13) | Older adults (n = 11) | Young adults (n = 22) | Older adults (n = 33) | ||||||
| Energy (kcal) | 1,515.63 ± 420.44 | 1,761.47 ± 475.77 | 1,667.27 ± 374.10 | 0.60 | 1,511.33 ± 448.08 | 1,371.11 ± 341.30 | 0.19 | 0.13 | 0.02 |
| Carbohydrate (g) | 241.08 ± 67.45 | 264.49 ± 95.63 | 258.34 ± 54.66 | 0.85 | 236.00 ± 70.12 | 229.50 ± 54.94 | 0.70 | 0.32 | 0.14 |
| Protein (g) | 59.01 ± 20.81 | 63.45 ± 18.86 | 65.98 ± 21.47 | 0.17 | 61.30 ± 25.4 | 53.42 ± 17.09 | 0.76 | 0.15 | 0.02 |
| Fat (g) | 59.02 ± 20.81 | 63.46 ± 18.86 | 65.99 ± 21.47 | 0.76 | 61.30 ± 25.46 | 53.43 ± 17.10 | 0.17 | 0.79 | 0.05 |
| Energy distribution | |||||||||
| % Carbohydrate | - | 60.21 ± 10.98 | 62.68 ± 7.55 | 0.53 | 63.21 ± 9.10 | 67.57 ± 7.81 | 0.06 | 0.39 | 0.08 |
| % Protein | - | 20.90 ± 6.44 | 19.85 ± 6.74 | 0.70 | 19.02 ± 6.42 | 16.05 ± 6.23 | 0.07 | 0.46 | 0.09 |
| % Fat | - | 14.62 ± 2.82 | 15.64 ± 2.60 | 0.37 | 15.97 ± 3.24 | 15.53 ± 2.85 | 0.60 | 0.22 | 0.91 |
| Fiber (g) | 24.42 ± 9.92 | 25.55 ± 12.51 | 25.73 ± 9.10 | 0.97 | 25.71 ± 10.43 | 22.69 ± 8.85 | 0.25 | 0.97 | 0.33 |
| Vitamin A (μg RAE) | 257.79 ± 158.50 | 203.51 ± 140.08 | 282.16 ± 163.85 | 0.22 | 302.30 ± 173.91 | 241.39 ± 150.32 | 0.17 | 0.09 | 0.45 |
| Vitamin D (μg) | 1.64 ± 1.89 | 2.29 ± 2.48 | 2.01 ± 1.75 | 0.76 | 1.28 ± 1.64 | 1.50 ± 1.83 | 0.65 | 0.16 | 0.42 |
| Vitamin E (mg) | 12.53 ± 6.44 | 12.56 ± 6.26 | 15.70 ± 8.22 | 0.30 | 13.66 ± 6.83 | 10.70 ± 5.19 | 0.07 | 0.64 | 0.02 |
| Vitamin C (mg) | 74.48 ± 44.89 | 68.86 ± 50.92 | 71.35 ± 36.83 | 0.89 | 68.14 ± 46.24 | 81.97 ± 44.84 | 0.27 | 0.97 | 0.48 |
| Thiamine (mg) | 1.10 ± 0.40 | 1.25 ± 0.49 | 1.14 ± 0.32 | 0.52 | 1.12 ± 0.43 | 1.02 ± 0.35 | 0.31 | 0.42 | 0.31 |
| Riboflavin (mg) | 1.25 ± 0.51 | 1.24 ± 0.44 | 1.61 ± 0.55 | 0.08 | 1.25 ± 0.45 | 1.14 ± 0.54 | 0.43 | 0.93 | 0.02 |
| Niacin (mg NE) | 6.57 ± 3.40 | 7.20 ± 4.48 | 7.50 ± 3.23 | 0.86 | 6.80 ± 3.15 | 5.86 ± 3.15 | 0.28 | 0.75 | 0.14 |
| Folic acid (μg DFE) | 300.66 ± 149.11 | 267.62 ± 120.89 | 379.12 ± 163.33 | 0.07 | 307.65 ± 186.80 | 282.85 ± 120.66 | 0.55 | 0.49 | 0.04 |
| Vitamin B12 (μg) | 3.24 ± 5.63 | 3.10 ± 2.97 | 3.59 ± 2.45 | 0.67 | 2.22 ± 1.90 | 3.87 ± 8.28 | 0.36 | 0.29 | 0.91 |
| Calcium (mg) | 545.87 ± 273.93 | 585.81 ± 335.29 | 539.79 ± 209.41 | 0.70 | 552.67 ± 224.11 | 527.63 ± 305.05 | 0.74 | 0.73 | 0.90 |
| Phosphorus (mg) | 992.06 ± 315.90 | 1,079.64 ± 340.97 | 1,055.69 ± 334.05 | 0.86 | 1,030.16 ± 322.02 | 910.95 ± 290.57 | 0.16 | 0.67 | 0.17 |
| Sodium (mg) | 4,451.17 ± 1,965.99 | 4,578.45 ± 2,038.26 | 5,135.32 ± 1,578.63 | 0.47 | 4,520.27 ± 2,620.29 | 4,126.92 ± 1,516.42 | 0.48 | 0.95 | 0.06 |
| Potassium (mg) | 2,892.98 ± 1,112.79 | 3,274.20 ± 1,353.47 | 2,941.71 ± 871.86 | 0.49 | 3,027.44 ± 1,234.83 | 2,636.92 ± 976.37 | 0.20 | 0.58 | 0.36 |
| Magnesium (mg) | 297.73 ± 144.27 | 312.98 ± 143.63 | 310.71 ± 121.58 | 0.97 | 315.88 ± 192.39 | 275.29 ± 114.85 | 0.33 | 0.96 | 0.39 |
| Iron (mg) | 11.06 ± 4.21 | 11.93 ± 5.16 | 11.92 ± 4.01 | 0.99 | 11.01 ± 4.48 | 10.47 ± 3.77 | 0.63 | 0.58 | 0.28 |
| Zinc (mg) | 6.45 ± 2.95 | 6.49 ± 2.38 | 8.00 ± 4.20 | 0.28 | 6.75 ± 2.44 | 5.71 ± 2.87 | 0.17 | 0.76 | 0.04 |
| Variables | Total (n = 79) | Male (n = 24) | P-value |
Female (n = 55) | P-value |
P-value |
P-value |
||
|---|---|---|---|---|---|---|---|---|---|
| Young adults (n = 13) | Older adults (n = 11) | Young adults (n = 22) | Older adults (n = 33) | ||||||
| NQ-E score | 54.34 ± 12.98 | 54.98 ± 17.23 | 51.74 ± 12.58 | 0.61 | 58.62 ± 10.86 | 52.09 ± 12.33 | 0.05 | 0.45 | 0.93 |
| Balance | 44.50 ± 16.57 | 43.29 ± 19.63 | 42.04 ± 16.41 | 0.87 | 49.51 ± 15.83 | 42.45 ± 15.86 | 0.11 | 0.31 | 0.94 |
| Moderation | 52.62 ± 30.48 | 49.05 ± 41.15 | 49.41 ± 25.27 | 0.98 | 65.43 ± 29.57 | 46.54 ± 26.40 | 0.02 | 0.18 | 0.75 |
| Practice | 70.30 ± 12.96 | 75.07 ± 14.32 | 67.65 ± 14.15 | 0.22 | 70.99 ± 11.01 | 68.84 ± 13.28 | 0.53 | 0.35 | 0.80 |
| Grade | |||||||||
| Upper grade | 28 (35.4) | 5 (38.5) | 2 (18.2) | 0.43 | 12 (54.5) | 9 (27.3) | 0.03 | 0.10 | 0.75 |
| Moderate grade | 33 (41.8) | 4 (30.8) | 6 (54.5) | 9 (40.9) | 14 (42.4) | ||||
| Low grade | 18 (22.8) | 4 (30.8) | 3 (27.3) | 1 (4.5) | 10 (30.3) | ||||
| χ2 value | 0.14 | 1.56 | 4.42 | 0.14 | |||||
| Item | Variables | Male (n = 24) | P-value |
Female (n = 55) | P-value |
P-value |
P-value |
||
|---|---|---|---|---|---|---|---|---|---|
| Young adults (n = 13) | Older adults (n = 11) | Young adults (n = 22) | Older adults (n = 33) | ||||||
| Balance (8) | Intake frequency of fruits | 30.77 ± 35.58 | 34.09 ± 23.11 | 0.79 | 59.09 ± 35.81 | 43.94 ± 32.49 | 0.11 | 0.03 | 0.28 |
| Intake frequency of milk or dairy products | 21.15 ± 30.36 | 25.00 ± 33.54 | 0.77 | 34.09 ± 30.42 | 40.15 ± 37.47 | 0.51 | 0.23 | 0.24 | |
| Intake frequency of fish or shellfish | 40.38 ± 19.20 | 45.45 ± 18.77 | 0.52 | 35.23 ± 23.98 | 37.88 ± 26.61 | 0.71 | 0.51 | 0.31 | |
| Intake frequency of eggs | 75.00 ± 32.27 | 63.64 ± 37.69 | 0.43 | 63.64 ± 32.48 | 52.27 ± 35.56 | 0.23 | 0.32 | 0.37 | |
| Intake frequency of beans or bean products | 51.92 ± 36.03 | 61.36 ± 30.34 | 0.50 | 38.64 ± 33.39 | 49.24 ± 39.27 | 0.30 | 0.28 | 0.36 | |
| Intake frequency of nuts | 23.08 ± 34.55 | 20.45 ± 26.97 | 0.84 | 34.09 ± 42.64 | 11.36 ± 25.84 | 0.03 | 0.44 | 0.32 | |
| Intake frequency of cooked rice with mixed grains | 55.77 ± 46.94 | 29.55 ± 36.77 | 0.15 | 72.73 ± 37.72 | 52.27 ± 45.66 | 0.08 | 0.25 | 0.11 | |
| Intake frequency of water | 75.00 ± 30.62 | 75.00 ± 22.36 | ≥ 0.99 | 67.05 ± 23.64 | 68.18 ± 24.43 | 0.86 | 0.39 | 0.42 | |
| Moderation (2) | Intake frequency of sweetened snacks or beverages | 46.15 ± 45.47 | 45.45 ± 29.19 | 0.96 | 64.77 ± 33.33 | 44.70 ± 29.82 | 0.02 | 0.17 | 0.94 |
| Intake frequency of greasy baked products or snacks | 71.15 ± 35.13 | 79.55 ± 21.85 | 0.50 | 70.45 ± 35.05 | 60.61 ± 32.49 | 0.29 | 0.95 | 0.08 | |
| Practice (7) | Efforts to have healthy eating habits | 63.46 ± 26.25 | 59.09 ± 30.15 | 0.71 | 72.73 ± 29.79 | 60.61 ± 22.56 | 0.09 | 0.36 | 0.86 |
| Checking of expiration date and nutrition labeling | 67.31 ± 35.92 | 65.91 ± 30.15 | 0.92 | 86.36 ± 21.45 | 66.67 ± 34.04 | 0.01 | 0.06 | 0.95 | |
| Washing hands practices before eating meals | 90.38 ± 21.74 | 86.36 ± 17.19 | 0.62 | 97.73 ± 10.66 | 91.67 ± 18.40 | 0.13 | 0.19 | 0.40 | |
| Difficulty in chewing foods | 78.85 ± 26.70 | 63.64 ± 30.34 | 0.20 | 75.00 ± 29.88 | 62.88 ± 32.55 | 0.17 | 0.70 | 0.95 | |
| Depressive condition | 76.92 ± 25.94 | 65.91 ± 28.00 | 0.33 | 62.50 ± 31.58 | 69.70 ± 30.46 | 0.40 | 0.17 | 0.72 | |
| Degree of sound sleep | 75.00 ± 27.00 | 65.91 ± 23.11 | 0.39 | 62.50 ± 32.50 | 74.24 ± 28.29 | 0.16 | 0.25 | 0.38 | |
| Level of awareness of one’s own health | 73.08 ± 16.01 | 68.18 ± 16.17 | 0.46 | 53.41 ± 19.36 | 59.85 ± 21.60 | 0.26 | 0.01 | 0.19 | |
| Variables | Total (n = 79) | NQ-E grade | P-value | ||
|---|---|---|---|---|---|
| Upper (n = 28) | Moderate (n = 33) | Low (n = 18) | |||
| Energy (kcal) | 1,515.63 ± 420.44 | 1,582.06 ± 385.97 | 1,508.89 ± 399.68 | 1,424.66 ± 507.57 | 0.47 |
| Carbohydrate (g) | 241.08 ± 67.45 | 240.50 ± 60.06 | 241.53 ± 58.75 | 241.16 ± 92.98 | 0.99 |
| Protein (g) | 59.01 ± 20.81 | 65.48 ± 20.91 | 57.58 ± 20.80 | 51.15 ± 18.36 | 0.06 |
| Fat (g) | 59.02 ± 20.81 | 65.34 ± 21.28 | 57.95 ± 20.59 | 51.16 ± 18.36 | 0.07 |
| Fiber (g) | 24.42 ± 9.92 | 28.68 ± 10.00 |
22.05 ± 8.36 |
22.16 ± 10.70 |
0.02 |
| Vitamin A (μg RAE) | 257.79 ± 158.50 | 326.57 ± 152.15 |
245.99 ± 161.39 |
172.45 ± 117.04 |
0.01 |
| Vitamin D (μg) | 1.64 ± 1.89 | 1.04 ± 1.31 |
1.66 ± 1.76 |
2.54 ± 2.52 |
0.03 |
| Vitamin E (mg) | 12.53 ± 6.44 | 14.12 ± 6.20 | 12.21 ± 6.73 | 10.63 ± 5.99 | 0.19 |
| Vitamin C (mg) | 74.48 ± 44.89 | 84.62 ± 41.12 | 68.32 ± 47.36 | 69.99 ± 45.52 | 0.33 |
| Thiamine (mg) | 1.10 ± 0.40 | 1.24 ± 0.47 |
1.08 ± 0.31 |
0.93 ± 0.34 |
0.02 |
| Riboflavin (mg) | 1.25 ± 0.51 | 1.45 ± 0.42 |
1.22 ± 0.56 |
1.01 ± 0.47 |
0.01 |
| Niacin (mg NE) | 6.57 ± 3.40 | 7.48 ± 3.35 |
6.81 ± 3.43 |
4.71 ± 2.85 |
0.02 |
| Folic acid (μg DFE) | 300.66 ± 149.11 | 350.63 ± 160.02 | 284.90 ± 135.42 | 251.82 ± 140.38 | 0.06 |
| Vitamin B12 (μg) | 3.24 ± 5.63 | 3.73 ± 8.68 | 2.67 ± 2.28 | 3.53 ± 3.88 | 0.75 |
| Calcium (mg) | 545.87 ± 273.93 | 636.46 ± 310.16 | 484.90 ± 255.08 | 516.72 ± 217.71 | 0.08 |
| Phosphorus (mg) | 992.06 ± 315.90 | 1,092.84 ± 270.65 | 962.29 ± 331.28 | 889.88 ± 324.72 | 0.08 |
| Sodium (mg) | 4,451.17 ± 1,965.99 | 4,742.14 ± 2,178.69 | 4,397.21 ± 1,847.47 | 4,097.50 ± 1,868.94 | 0.55 |
| Potassium (mg) | 2,892.98 ± 1,112.79 | 3,351.06 ± 1,219.59 |
2,662.15 ± 891.34 |
2,603.61 ± 1,134.05 |
0.02 |
| Magnesium (mg) | 297.73 ± 144.27 | 358.17 ± 177.60 |
260.58 ± 98.62 |
271.82 ± 132.99 |
0.02 |
| Iron (mg) | 11.06 ± 4.21 | 12.54 ± 4.32 | 10.42 ± 3.85 | 9.94 ± 4.25 | 0.06 |
| Zinc (mg) | 6.45 ± 2.95 | 7.22 ± 2.51 | 6.48 ± 3.37 | 5.20 ± 2.44 | 0.07 |
| Item | Variables | Total (n = 79) | NQ-E grade | P-value | ||
|---|---|---|---|---|---|---|
| Upper (n = 28) | Moderate (n = 33) | Low (n = 18) | ||||
| Exercise | Do exercise | 46 (58.2) | 26 (92.9) | 17 (51.5) | 3 (16.7) | < 0.01 |
| Do not exercise | 33 (41.8) | 2 (7.1) | 16 (48.5) | 15 (83.3) | ||
| Smoking | Yes | 8 (10.1) | 1 (3.6) | 4 (12.1) | 3 (16.7) | 0.31 |
| No | 71 (89.9) | 27 (96.4) | 29 (87.9) | 15 (83.3) | ||
| Employment | Yes | 58 (73.4) | 20 (71.4) | 26 (78.8) | 12 (66.7) | 0.62 |
| No | 21 (26.6) | 8 (28.6) | 7 (21.2) | 6 (33.3) | ||
| Housemate | With family | 49 (62.0) | 21 (75.0) | 19 (57.6) | 9 (50.0) | 0.18 |
| Alone | 30 (38.0) | 7 (25.0) | 14 (42.4) | 9 (50.0) | ||
| Change in body weight | Yes | 14 (17.7) | 3 (10.7) | 7 (21.2) | 4 (22.2) | 0.48 |
| No | 65 (82.3) | 25 (89.3) | 26 (78.8) | 14 (77.8) | ||
| Medical history | ≥ 1 | 72 (91.1) | 23 (82.1) | 31 (93.9) | 18 (100) | 0.09 |
| 0 | 7 (8.9) | 5 (17.9) | 2 (6.1) | - | ||
| Drug | ≥ 1 | 71 (89.9) | 25 (89.3) | 28 (84.8) | 18 (100) | 0.25 |
| 0 | 8 (10.1) | 3 (10.7) | 5 (15.2) | - | ||
| Allergy | ≥ 1 | 4 (5.1) | 2 (7.1) | 1 (3.0) | 1 (5.6) | 0.76 |
| 0 | 75 (94.9) | 26 (92.9) | 32 (97.0) | 17 (94.4) | ||
| Supplement intake | ≥ 1 | 51 (64.6) | 22 (78.6) | 23 (69.7) | 6 (33.3) | 0.01 |
| 0 | 28 (35.4) | 6 (21.4) | 10 (30.3) | 12 (66.7) | ||
Table 1. General characteristics of participants
n (%) or Mean ± SD.
Table 2. Daily nutrient intake in participants by age and sex
Mean ± SD. μg RAE, micrograms of retinol activity equivalents; mg NE, milligrams of niacin equivalents; μg DFE, micrograms of dietary folate equivalents. Male group. Female group. Young adult male and female groups. Older adult male and female groups.
Table 3. Comparison of balance, moderation, dietary practice, and NQ-E score across age and sex groups
Mean ± SD. NQ-E, Nutrition Quotient for the Elderly. Male group. Female group. Young adult male and female groups. Older adult male and female groups.
Table 4. Comparison of NQ-E scores for each item by age and sex of the participants
Mean ± SD. NQ-E, Nutrition Quotient for the Elderly. Male group. Female group. Young adult male and female groups. Older adult male and female groups.
Table 5. Daily nutrient intake based on NQ-E grade in participants
Mean ± SD. NQ-E, Nutrition Quotient for the Elderly; NQ, Nutrition Quotient; μg RAE, micrograms of retinol activity equivalents; mg NE, milligrams of niacin equivalents; μg DFE, micrograms of dietary folate equivalents. Different superscript letters within the same row indicate significant differences among groups at
Table 6. Analysis of NQ-E grade distribution according to general characteristics
n (%). NQ-E, Nutrition Quotient for the Elderly.


