
Articles
- Page Path
- HOME > Korean J Community Nutr > Volume 30(4); 2025 > Article
-
Research Article
- Associations between diet quality and regional factors in Korea vary according to individuals’ characteristics: a cross-sectional study
-
Hyunmi Han1)
 , Clara Yongjoo Park2),†, Jeonghwa Lee3)
 -
Korean Journal of Community Nutrition 2025;30(4):274-285.
DOI: https://doi.org/10.5720/kjcn.2025.00157
Published online: August 29, 2025
1)Student, Department of Food and Nutrition, Chonnam National University, Gwangju, Korea
2)Professor, Department of Food and Nutrition, Chonnam National University, Gwangju, Korea
3)Professor, Department of Family Environment & Welfare, Chonnam National University, Gwangju, Korea
- †Corresponding author: Clara Yongjoo Park Department of Food and Nutrition, Chonnam National University, 77 Yongbong-ro, Buk-gu, Gwangju 61186, Korea Tel: +82-62-530-1354 Fax: +82-62-530-1339 Email: parkcy@jnu.ac.kr
• Received: July 2, 2025 • Revised: July 30, 2025 • Accepted: August 5, 2025
© 2025 The Korean Society of Community Nutrition
This is an Open-Access article distributed under the terms of the Creative Commons Attribution Non-Commercial License (http://creativecommons.org/licenses/by-nc/3.0) which permits unrestricted non-commercial use, distribution, and reproduction in any medium, provided the original work is properly cited.
- 2,577 Views
- 41 Download
- 1 Crossref
Abstract
-
Objectives
- Although diet quality is known to be associated with environment and individuals’ characteristics, these have not been studied together. We determined the association of diet quality with regional factors stratified by individuals’ sociodemographic characteristics.
-
Methods
- This study used nationally representative survey data on regional factors (2010–2020) and the Korea National Health and Nutrition Examination Survey data on individuals’ sociodemographic characteristics (2013–2018). Community-dwelling Koreans aged ≥ 20 were included (n = 26,853). Regions were categorized into metropolitan cities or provinces and subsequently according to regional factors (level of educational attainment, income per capita, food security status, physical activity facilities, time to the nearest large retailer, and internet use of the region). Individuals’ sociodemographic characteristics included age, education status, income, and number of household members. Diet quality was assessed using the Korean Healthy Eating Index (KHEI).
-
Results
- In the entire population, education status of metropolitan cities was positively associated with the KHEI. Shorter time to retailers and higher internet use were positively associated with the KHEI in metropolitan residents with higher income levels but negatively associated with the KHEI in those with lower income status. Among provincial residents with a low education status or income, regional physical activity facilities were positively associated with the KHEI.
-
Conclusion
- The association between diet quality and regional factors varied depending on the resident’s sociodemographic characteristics. Both regional and individual sociodemographic factors must be considered to address gaps in nutritional equity.
INTRODUCTION
METHODS
RESULTS
1) Regional education status
2) Regional income and regional food security
3) Physical activity facilities
4) Access to retailers and information
DISCUSSION
-
CONFLICT OF INTEREST
There are no financial or other issues that might lead to conflict of interest.
-
FUNDING
This study was supported by the Korean Society of Community Nutrition funded by a grant from the Korea Disease Control and Prevention Agency (No. ISSN 2733-5488).
-
DATA AVAILABILITY
The data used is publicly available at the Statistics Korea and the Community Health Survey and the Korean National Health and Nutrition Examination Survey (https://kosis.kr/index/index.do, https://knhanes.kdca.go.kr/knhanes/main.do).
NOTES
SUPPLEMENTARY MATERIALS
Supplementary Table 1.
Supplementary Table 2.
Supplementary Table 3.
Supplementary Table 4.
Supplementary Table 5.
Supplementary Table 6.
Supplementary Table 7.
Supplementary Table 8.
Supplementary Figure 1.
Fig. 1.
Weighted adjusted means of the KHEI according to regional physical activity facilities (urban park area [metropolitan cities] or number of sports facilities [provinces]) and individuals’ education (A, B) or income status (C, D) of adult participants of the KNHANES.
KNHANES, Korea National Health and Nutrition Examination Survey; KHEI, Korean Healthy Eating Index.
Weights were applied to account for the complex survey design. General linear models were conducted to compare mean KHEI scores. Means were adjusted for participant age, sex, disease, physical activity, body mass index, and education/income. Error bars indicate standard error. Metropolitan cities were classified as low (Daegu, Busan, and Gwangju), middle (Seoul and Gyeonggi-do), and high (Incheon, Daejeon, and Ulsan). Provinces were categorized into low (Gyeongsangnam-do and Chungcheongnam-do), middle (Chungcheongbuk-do, Jeollabuk-do, and Gyeongsangbuk-do), and high (Jeollanam-do, Gangwon-do, and Jeju-do). Education status was categorized differently according to age due to the socioeconomic changes during the past decades in Korea. For adults < 60 years of age education status was categorized as high (≥ college graduate), middle (high school graduate), and low (< high school graduate), while for adults ≥ 60 years of age, education status was categorized as high (≥ high school graduate), middle (middle school graduate), and low (< middle school graduate).

Fig. 2.
Weighted adjusted means of the KHEI according to mean time to the nearest large retailer of the region in metropolitan cities and provinces and individuals’ education (A, B) or income status (C, D) of adult participants of the KNHANES.
KNHANES, Korea National Health and Nutrition Examination Survey; KHEI, Korean Healthy Eating Index.
Weights were applied to account for the complex survey design. General linear models were conducted to compare mean KHEI scores. Means were adjusted for participant age, sex, disease, physical activity, body mass index, and education/income. Error bars indicate standard error. Metropolitan cities were classified as long (Gyeonggi-do and Ulsan), intermediate (Incheon, Gwangju, and Daejeon), and short (Daegu, Seoul, and Busan). Provinces were categorized into long (Jeollanam-do, Gangwon-do, and Gyeongsangbuk-do), intermediate (Chungcheongnam-do, Chungcheongbuk-do, and Jeollabuk-do), and short (Jeju-do and Gyeongsangnam-do). Education status was categorized differently according to age due to the socioeconomic changes during the past decades in Korea. For adults < 60 years of age education status was categorized as high (≥ college graduate), middle (high school graduate), and low (< high school graduate), while for adults ≥ 60 years of age, education status was categorized as high (≥ high school graduate), middle (middle school graduate), and low (< middle school graduate).

Table 1.Comparison of regional factors between metropolitan cities and provinces in Korea
Mean ± SD.
KRW, South Korean won; N/A, not applicable.
Education level was categorized into high: ≥ college, middle: high school, and low: < high school for adults < 60 years of age and high: ≥ high school, middle: middle school, and low: < middle school for adults ≥ 60 years of age. Physical activity facilities were defined as urban park area per 1,000 population (1,000 m2) for metropolitan cities and number of sports facilities per 100,000 population for provinces. Metropolitan cities include Seoul, Busan, Daegu, Daejeon, Gwangju, Ulsan, Incheon, and Gyeonggi-do. Provinces include Gangwon-do, Chungcheongbuk-do, Chungcheongnam-do, Gyeongsangbuk-do, Gyeongsangnam-do, Jeollabuk-do, Jeollanam-do, and Jeju-do. Comparisons between metropolitan cities and provinces were performed using the t-test or chi-square test. Income per capita and time to the nearest large retailer were compared using the Wilcoxon rank sum test. Regional factors used statistical data from Statistics Korea on education level (2015, 2020), income level (2013–2018), facilities for physical activity (2013–2018), and market (2017–2018) accessibility and internet use (2013–2018). The Community Health Survey was used to determine regional food security (2013–2018).
Table 2.Participant characteristics according to residential area from KNHANES 2013–2018
n (weighted %), weighted % (SE), or mean ± SE.
KNHANES, Korea National Health and Nutrition Examination Survey; BMI, body mass index; KHEI, Korean Healthy Eating Index; SE, standard error.
Education level was categorized into high: ≥ college, middle: high school, and low: < high school for adults < 60 years of age and high: ≥ high school, middle: middle school, and low: < middle school for adults ≥ 60 years of age. Metropolitan cities include Seoul, Busan, Daegu, Daejeon, Gwangju, Ulsan, Incheon, and Gyeonggi-do. Provinces include Gangwon-do, Chungcheongbuk-do, Chungcheongnam-do, Gyeongsangbuk-do, Gyeongsangnam-do, Jeollabuk-do, Jeollanam-do, and Jeju-do. Disease includes dyslipidemia, myocardial infarction, angina renal disease, hypertension, and diabetes. Comparisons between metropolitan cities and provinces were performed using the t-test or chi-square test.
Table 3.Mean KHEI according to regional internet use (% of population) and participant characteristics
Weighted mean ± SE.
KHEI, Korean Healthy Eating Index.
Weights were applied to account for the complex survey design. ANOVA was conducted to compare mean KHEI scores. Adjusted P-values were adjusted for participant age, sex, disease, physical activity, body mass index, education, and income. Age was not adjusted for in analyses by age group. Metropolitan cities were classified as low (Gyeonggi-do), middle (Seoul, Incheon, and Busan), and high (Daejeon, Gwangju, Daegu, and Ulsan). Provinces were categorized into low (Gangwon-do and Jeollanam-do), middle (Jeollabuk-do, Chungcheongnam-do, and Chungcheongbuk-do), and high (Jeju-do, Gyeongsangbuk-do, and Gyeongsangnam-do).
- 1. Morze J, Danielewicz A, Hoffmann G, Schwingshackl L. Diet quality as assessed by the healthy eating index, alternate healthy eating index, dietary approaches to stop hypertension score, and health outcomes: a second update of a systematic review and meta-analysis of cohort studies. J Acad Nutr Diet 2020; 120(12): 1998-2031.e15. ArticlePubMed
- 2. Hu EA, Steffen LM, Coresh J, Appel LJ, Rebholz CM. Adherence to the healthy eating index-2015 and other dietary patterns may reduce risk of cardiovascular disease, cardiovascular mortality, and all-cause mortality. J Nutr 2020; 150(2): 312-321. ArticlePubMedPMCPDF
- 3. Ding CY, Park PS, Park MY. The relationship between the Korean adults diet evaluated using dietary quality indices and metabolic risk factors: based on the 2016~2019 Korea National Health and Nutrition Examination Survey. Korean J Community Nutr 2022; 27(3): 223-244. ArticleLink
- 4. Mozaffarian D. Dietary and policy priorities for cardiovascular disease, diabetes, and obesity: a comprehensive review. Circulation 2016; 133(2): 187-225. ArticlePubMedPMC
- 5. McCullough ML, Chantaprasopsuk S, Islami F, Rees-Punia E, Um CY, Wang Y, et al. Association of socioeconomic and geographic factors with diet quality in US adults. JAMA Netw Open 2022; 5(6): e2216406. ArticlePubMedPMC
- 6. Beydoun MA, Wang Y. Do nutrition knowledge and beliefs modify the association of socio-economic factors and diet quality among US adults? Prev Med 2008; 46(2): 145-153. ArticlePubMed
- 7. Lee H, Park S. Regional differences in the associations of diet quality, obesity, and possible sarcopenia using the seventh Korea National Health and Nutrition Examination Survey (2016-2018). Epidemiol Health 2023; 45: e2023059. ArticlePubMedPMCPDF
- 8. Caspi CE, Sorensen G, Subramanian SV, Kawachi I. The local food environment and diet: a systematic review. Health Place 2012; 18(5): 1172-1187. ArticlePubMedPMC
- 9. Yuen JWM, Chang KKP, Wong FKY, Wong FY, Siu JYM, Ho HC, et al. Influence of urban green space and facility accessibility on exercise and healthy diet in Hong Kong. Int J Environ Res Public Health 2019; 16(9): 1514.ArticlePubMedPMC
- 10. Yang M, Zhang Z, Wang Z. Does Internet use connect smallholder farmers to a healthy diet? Evidence from rural China. Front Nutr 2023; 10: 1122677.ArticlePubMedPMC
- 11. Heo JH, Cho YT, Kwon SM. The effects of socioeconomic deprivations on health. Korean J Sociol 2010; 44(2): 93-120.
- 12. Ham H, Ko H, Kim S, Jang Y, Byun JS, Jekal Y, et al. Nutrition and food intake status among adults in Jeju according to sociodemographic characteristics and obesity. J Nutr Health 2024; 57(6): 667-684. ArticleLink
- 13. Jeong YH, Kim HY, Lee HY. Trends in dietary behavior changes by region using 2008~2019 Community Health Survey data. Korean J Community Nutr 2022; 27(2): 132-145. ArticleLink
- 14. Korea Disease Control and Prevention Agency (KDCA). Korea National Health & Nutrition Examination Survey [Internet]. KDCA; n.d. [cited 2025 July 22]. Available from: https://knhanes.kdca.go.kr/knhanes/eng/main.do
- 15. Yun S, Park S, Yook SM, Kim K, Shim JE, Hwang JY, et al. Development of the Korean Healthy Eating Index for adults, based on the Korea National Health and Nutrition Examination Survey. Nutr Res Pract 2022; 16(2): 233-247. ArticlePubMedLink
- 16. Lee JH. The regional health inequity, and individual and neighborhood level health determinants. Health Soc Welf Rev 2016; 36(2): 345-384. Article
- 17. Park S, Kim HJ, Kim K. Do where the elderly live matter? Factors associated with diet quality among Korean elderly population living in urban versus rural areas. Nutrients 2020; 12(5): 1314.ArticlePubMedPMC
- 18. Lee J, Sa J. Regional disparities in healthy eating and nutritional status in South Korea: Korea National Health and Nutrition Examination Survey 2017. Nutr Res Pract 2020; 14(6): 679-690. ArticlePubMedPMCLink
- 19. Gordon AR, Briefel RR, Collins AM, Rowe GM, Klerman JA. Delivering summer electronic benefit transfers for children through the supplemental nutrition assistance program or the special supplemental nutrition program for women, infants, and children: benefit use and impacts on food security and foods consumed. J Acad Nutr Diet 2017; 117(3): 367-375.e2. ArticlePubMed
- 20. Collins AM, Klerman JA. Improving nutrition by increasing supplemental nutrition assistance program benefits. Am J Prev Med 2017; 52(2S2): S179-S185. ArticlePubMed
- 21. Jaller M, Pahwa A. Evaluating the environmental impacts of online shopping: a behavioral and transportation approach. Transp Res Part D: Transp Environ 2020; 80: 102223.Article
- 22. Martinez O, Tagliaferro B, Rodriguez N, Athens J, Abrams C, Elbel B. EBT payment for online grocery orders: a mixed-methods study to understand its uptake among SNAP recipients and the barriers to and motivators for its use. J Nutr Educ Behav 2018; 50(4): 396-402.e1. ArticlePubMed
- 23. Hiza HA, Casavale KO, Guenther PM, Davis CA. Diet quality of Americans differs by age, sex, race/ethnicity, income, and education level. J Acad Nutr Diet 2013; 113(2): 297-306. ArticlePubMed
- 24. Fassier P, Chhim AS, Andreeva VA, Hercberg S, Latino-Martel P, Pouchieu C, et al. Seeking health- and nutrition-related information on the Internet in a large population of French adults: results of the NutriNet-Santé study. Br J Nutr 2016; 115(11): 2039-2046. ArticlePubMed
- 25. Huberty J, Dinkel D, Beets MW, Coleman J. Describing the use of the internet for health, physical activity, and nutrition information in pregnant women. Matern Child Health J 2013; 17(8): 1363-1372. ArticlePubMedPDF
- 26. Cho KW. An investigation of internet usage and health information aquisition by internet of domestic adults. Proc Korea Contents Assoc Conf 2006; 4(2): 721-724.
- 27. Wolfson JA, Leung CW. Food insecurity and COVID-19: disparities in early effects for US adults. Nutrients 2020; 12(6): 1648.ArticlePubMedPMC
- 28. Seligman HK, Laraia BA, Kushel MB. Food insecurity is associated with chronic disease among low-income NHANES participants. J Nutr 2010; 140(2): 304-310. ArticlePubMedPMC
- 29. Organisation for Economic Co-operation and Development (OECD). Poverty rate [Internet]. OECD; 2021 [cited 2025 June 27]. Available from: https://www.oecd.org/en/data/indicators/poverty-rate.html
- 30. Lee K. Household marginal food security is associated with poorer self-rated health in Korean adults. Nutr Res 2022; 100: 33-41. ArticlePubMed
- 31. Jo G, Park D, Lee J, Kim R, Subramanian SV, Oh H, et al. Trends in diet quality and cardiometabolic risk factors among Korean adults, 2007-2018. JAMA Netw Open 2022; 5(6): e2218297. ArticlePubMedPMC
- 32. Chen PJ, Antonelli M. Conceptual models of food choice: influential factors related to foods, individual differences, and society. Foods 2020; 9(12): 1898.ArticlePubMedPMC
REFERENCES
Figure & Data
REFERENCES
Citations
Citations to this article as recorded by 
- Determinants of Metabolic Syndrome Among Rural Older Adults: A Cross-Sectional Analysis of the 2023 Korea National Health and Nutrition Examination Survey
Changhee Lee, Kyeongmin Jang
Journal of Ageing and Longevity.2026; 6(1): 22. CrossRef
 Cite
Cite- Figure
-
- We recommend
- Related articles
-
- Association between number of teeth and oxidative balance score in Korean adults: a population-based study
- The association between sodium index and the risk of obesity in Korean and Chinese university students: a cross-sectional study
- Nutrition Quotient and nutrient intake among older adults in a rural Korean community: a cross-sectional study
- Analysis of the relationship between foodservice staffing and foodservice quality in elderly care facilities in Korea: a cross-sectional study
- Adult consumers’ perception of plant-based meat substitutes and related factors in Korea: a cross-sectional study
Associations between diet quality and regional factors in Korea vary according to individuals’ characteristics: a cross-sectional study
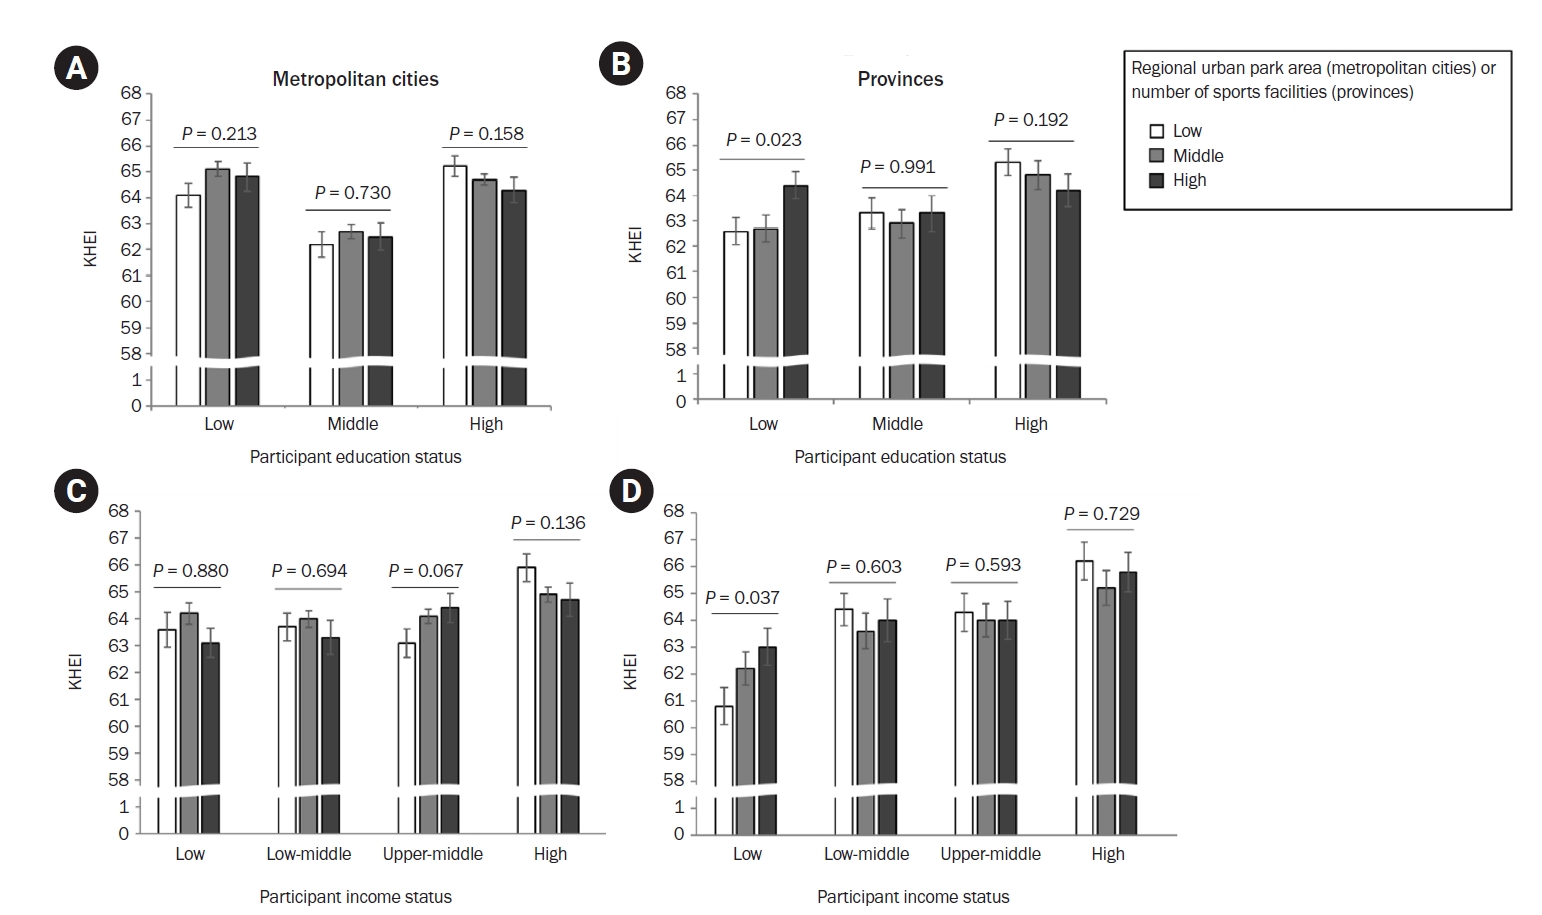

Fig. 1. Weighted adjusted means of the KHEI according to regional physical activity facilities (urban park area [metropolitan cities] or number of sports facilities [provinces]) and individuals’ education (A, B) or income status (C, D) of adult participants of the KNHANES.
KNHANES, Korea National Health and Nutrition Examination Survey; KHEI, Korean Healthy Eating Index.
Weights were applied to account for the complex survey design. General linear models were conducted to compare mean KHEI scores. Means were adjusted for participant age, sex, disease, physical activity, body mass index, and education/income. Error bars indicate standard error. Metropolitan cities were classified as low (Daegu, Busan, and Gwangju), middle (Seoul and Gyeonggi-do), and high (Incheon, Daejeon, and Ulsan). Provinces were categorized into low (Gyeongsangnam-do and Chungcheongnam-do), middle (Chungcheongbuk-do, Jeollabuk-do, and Gyeongsangbuk-do), and high (Jeollanam-do, Gangwon-do, and Jeju-do). Education status was categorized differently according to age due to the socioeconomic changes during the past decades in Korea. For adults < 60 years of age education status was categorized as high (≥ college graduate), middle (high school graduate), and low (< high school graduate), while for adults ≥ 60 years of age, education status was categorized as high (≥ high school graduate), middle (middle school graduate), and low (< middle school graduate).
Fig. 2. Weighted adjusted means of the KHEI according to mean time to the nearest large retailer of the region in metropolitan cities and provinces and individuals’ education (A, B) or income status (C, D) of adult participants of the KNHANES.
KNHANES, Korea National Health and Nutrition Examination Survey; KHEI, Korean Healthy Eating Index.
Weights were applied to account for the complex survey design. General linear models were conducted to compare mean KHEI scores. Means were adjusted for participant age, sex, disease, physical activity, body mass index, and education/income. Error bars indicate standard error. Metropolitan cities were classified as long (Gyeonggi-do and Ulsan), intermediate (Incheon, Gwangju, and Daejeon), and short (Daegu, Seoul, and Busan). Provinces were categorized into long (Jeollanam-do, Gangwon-do, and Gyeongsangbuk-do), intermediate (Chungcheongnam-do, Chungcheongbuk-do, and Jeollabuk-do), and short (Jeju-do and Gyeongsangnam-do). Education status was categorized differently according to age due to the socioeconomic changes during the past decades in Korea. For adults < 60 years of age education status was categorized as high (≥ college graduate), middle (high school graduate), and low (< high school graduate), while for adults ≥ 60 years of age, education status was categorized as high (≥ high school graduate), middle (middle school graduate), and low (< middle school graduate).
Fig. 1.
Fig. 2.
Associations between diet quality and regional factors in Korea vary according to individuals’ characteristics: a cross-sectional study
| Regional factors | Overall | Metropolitan cities | Provinces | P-value |
|---|---|---|---|---|
| Higher education (%) | 54.08 ± 6.60 | 58.90 ± 4.64 | 49.26 ± 4.35 | 0.001 |
| Income per capita (1,000 KRW) | 17,535 ± 1,519 | 18,447 ± 1,717 | 16,624 ± 312 | 0.009 |
| Population food secure (%) | 56.34 ± 4.32 | 57.03 ± 4.40 | 55.65 ± 4.41 | 0.539 |
| Facilities for physical activity | N/A | 7.93 ± 2.07 | 115.97 ± 11.36 | N/A |
| Time to nearest large retailer (min) | 29.71 ± 16.85 | 14.95 ± 2.49 | 44.48 ± 10.17 | 0.005 |
| Internet use (%) | 87.75 ± 6.01 | 92.76 ± 2.51 | 82.75 ± 3.72 | < 0.001 |
| Participant characteristics | Overall | Metropolitan cities | Provinces | P-value |
|---|---|---|---|---|
| Total | 26,853 (100) | 18,779 (74.11) | 8,074 (25.89) | |
| Age (year) | 46.48 ± 0.17 | 45.57 ± 0.19 | 49.09 ± 0.41 | < 0.001 |
| Sex, male | 49.79 (0.31) | 49.67 (0.37) | 50.14 (0.56) | 0.484 |
| BMI (kg/m2) | 23.88 ± 0.03 | 23.79 ± 0.03 | 24.13 ± 0.05 | < 0.001 |
| One-person household, Yes | 9.08 (0.32) | 8.36 (0.37) | 11.17 (0.65) | < 0.001 |
| Income | < 0.001 | |||
| Low | 14.75 (0.39) | 12.93 (0.44) | 19.96 (0.92) | |
| Lower middle | 23.94 (0.47) | 22.99 (0.55) | 26.67 (0.89) | |
| Upper middle | 29.42 (0.48) | 29.95 (0.55) | 27.88 (1.01) | |
| High | 31.87 (0.64) | 34.10 (0.76) | 25.47 (1.22) | |
| Education | < 0.001 | |||
| Low | 20.07 (0.41) | 17.27 (0.43) | 28.07 (1.07) | |
| Middle | 34.89 (0.45) | 34.73 (0.54) | 35.37 (0.85) | |
| High | 45.02 (0.56) | 47.99 (0.69) | 36.54 (0.99) | |
| Disease, Yes | 61.82 (0.42) | 60.56 (0.49) | 65.40 (0.85) | < 0.001 |
| Physical activity (min) | < 0.001 | |||
| < 150 | 35.88 (0.40) | 33.48 (0.46) | 42.77 (0.81) | |
| ≥ 150 | 64.03 (0.40) | 66.44 (0.46) | 57.13 (0.81) | |
| Missing | 0.07 (0.02) | 0.07 (0.02) | 0.08 (0.03) | |
| Mean KHEI | ||||
| Overall | 62.81 ± 0.12 | 62.85 ± 0.14 | 62.72 ± 0.25 | 0.652 |
| 20–39 | 58.23 ± 0.20 | 58.14 ± 0.22 | 58.57 ± 0.47 | 0.411 |
| 40–59 | 64.70 ± 0.16 | 64.83 ± 0.18 | 64.34 ± 0.31 | 0.177 |
| ≥ 60 | 67.11 ± 0.19 | 68.07 ± 0.23 | 65.00 ± 0.32 | < 0.001 |
| Metropolitan cities |
Provinces |
|||||||||
|---|---|---|---|---|---|---|---|---|---|---|
| Low (87.68%) | Middle (91.40%–92.80%) | High (94.10%–95.20%) | P-value | Adjusted P | Low (77.13%–77.80%) | Middle (82.08%–83.32%) | High (85.40%–87.22%) | P-value | Adjusted P | |
| Age (year) | ||||||||||
| 20–39 | 57.98 ± 0.34 | 58.20 ± 0.33 | 58.27 ± 0.56 | 0.620 | 0.918 | 58.41 ± 1.01 | 59.02 ± 0.72 | 58.23 ± 0.80 | 0.784 | 0.728 |
| 40–59 | 64.27 ± 0.30 | 65.15 ± 0.27 | 65.12 ± 0.43 | 0.055 | 0.041 | 64.29 ± 0.52 | 64.21 ± 0.56 | 64.47 ± 0.48 | 0.750 | 0.412 |
| ≥ 60 | 68.47 ± 0.41 | 68.28 ± 0.32 | 66.93 ± 0.53 | 0.032 | 0.069 | 64.88 ± 0.63 | 65.12 ± 0.50 | 64.96 ± 0.54 | 0.976 | 0.370 |
| Individuals’ education status | ||||||||||
| Low | 64.16 ± 0.43 | 64.43 ± 0.35 | 63.67 ± 0.57 | 0.589 | 0.516 | 63.59 ± 0.60 | 62.90 ± 0.50 | 61.95 ± 0.56 | 0.045 | 0.009 |
| Middle | 61.46 ± 0.38 | 60.95 ± 0.34 | 61.94 ± 0.57 | 0.706 | 0.857 | 61.54 ± 0.88 | 61.96 ± 0.58 | 62.11 ± 0.66 | 0.622 | 0.365 |
| High | 62.65 ± 0.31 | 64.00 ± 0.27 | 63.49 ± 0.51 | 0.040 | 0.128 | 62.77 ± 0.83 | 63.37 ± 0.62 | 63.98 ± 0.56 | 0.213 | 0.230 |
| Individuals’ income | ||||||||||
| Low | 63.17 ± 0.59 | 62.02 ± 0.47 | 61.15 ± 0.70 | 0.025 | 0.041 | 61.32 ± 0.74 | 61.04 ± 0.64 | 60.32 ± 0.70 | 0.306 | 0.064 |
| Lower middle | 62.06 ± 0.42 | 62.03 ± 0.39 | 62.25 ± 0.53 | 0.817 | 0.420 | 61.88 ± 0.99 | 62.90 ± 0.68 | 62.09 ± 0.65 | 0.998 | 0.973 |
| Upper middle | 61.98 ± 0.39 | 63.07 ± 0.37 | 62.78 ± 0.59 | 0.118 | 0.991 | 62.48 ± 0.75 | 62.79 ± 0.64 | 63.26 ± 0.62 | 0.408 | 0.848 |
| High | 63.97 ± 0.41 | 64.17 ± 0.35 | 64.64 ± 0.61 | 0.011 | 0.017 | 64.69 ± 0.92 | 63.90 ± 0.77 | 64.50 ± 0.64 | 0.991 | 0.460 |
| Household type | ||||||||||
| One-person household | 59.70 ± 0.66 | 59.24 ± 0.61 | 60.46 ± 0.92 | 0.645 | 0.839 | 59.01 ± 1.16 | 61.77 ± 0.85 | 58.89 ± 0.87 | 0.693 | 0.049 |
| Multi-person household | 62.67 ± 0.24 | 63.48 ± 0.21 | 63.18 ± 0.38 | 0.114 | 0.701 | 63.12 ± 0.45 | 62.86 ± 0.46 | 63.22 ± 0.41 | 0.768 | 0.572 |
Table 1. Comparison of regional factors between metropolitan cities and provinces in Korea
Mean ± SD. KRW, South Korean won; N/A, not applicable. Education level was categorized into high: ≥ college, middle: high school, and low: < high school for adults < 60 years of age and high: ≥ high school, middle: middle school, and low: < middle school for adults ≥ 60 years of age. Physical activity facilities were defined as urban park area per 1,000 population (1,000 m2) for metropolitan cities and number of sports facilities per 100,000 population for provinces. Metropolitan cities include Seoul, Busan, Daegu, Daejeon, Gwangju, Ulsan, Incheon, and Gyeonggi-do. Provinces include Gangwon-do, Chungcheongbuk-do, Chungcheongnam-do, Gyeongsangbuk-do, Gyeongsangnam-do, Jeollabuk-do, Jeollanam-do, and Jeju-do. Comparisons between metropolitan cities and provinces were performed using the t-test or chi-square test. Income per capita and time to the nearest large retailer were compared using the Wilcoxon rank sum test. Regional factors used statistical data from Statistics Korea on education level (2015, 2020), income level (2013–2018), facilities for physical activity (2013–2018), and market (2017–2018) accessibility and internet use (2013–2018). The Community Health Survey was used to determine regional food security (2013–2018).
Table 2. Participant characteristics according to residential area from KNHANES 2013–2018
n (weighted %), weighted % (SE), or mean ± SE. KNHANES, Korea National Health and Nutrition Examination Survey; BMI, body mass index; KHEI, Korean Healthy Eating Index; SE, standard error. Education level was categorized into high: ≥ college, middle: high school, and low: < high school for adults < 60 years of age and high: ≥ high school, middle: middle school, and low: < middle school for adults ≥ 60 years of age. Metropolitan cities include Seoul, Busan, Daegu, Daejeon, Gwangju, Ulsan, Incheon, and Gyeonggi-do. Provinces include Gangwon-do, Chungcheongbuk-do, Chungcheongnam-do, Gyeongsangbuk-do, Gyeongsangnam-do, Jeollabuk-do, Jeollanam-do, and Jeju-do. Disease includes dyslipidemia, myocardial infarction, angina renal disease, hypertension, and diabetes. Comparisons between metropolitan cities and provinces were performed using the t-test or chi-square test.
Table 3. Mean KHEI according to regional internet use (% of population) and participant characteristics
Weighted mean ± SE. KHEI, Korean Healthy Eating Index. Weights were applied to account for the complex survey design. ANOVA was conducted to compare mean KHEI scores. Adjusted


