
Articles
- Page Path
- HOME > Korean J Community Nutr > Volume 16(1); 2011 > Article
-
Original Article
- Needs Assessment for Web-based Self-management Program by the Nutrition Knowledge Levels of Diabetic Patients
- Yun Ahn, Jeahurn Bae, Jung Eun Youn, Hee-Seon Kim
-
Korean Journal of Community Nutrition 2011;16(1):155-168.
DOI: https://doi.org/10.5720/kjcn.2011.16.1.155
Published online: February 28, 2011
1Department of Food and Nutrition, Seoul Women's University, Seoul, Korea.
2Nutrition Team, Soonchunhyang University Hospital, Bucheon, Korea.
3Department of Food Science and Nutrition, Soonchunhyang University, Asan, Korea.
- Corresponding author: Hee-Seon Kim, Department of Food Science and Nutrition, Soonchunhyang University, 646 Eupnae-ri, Shinchang-myun, Asan-si, Choongnam 336-745, Republic of Korea. Tel: (041) 530-1263, Fax: (041) 530-1264, hskim1@sch.ac.kr
• Received: December 26, 2010 • Revised: February 15, 2011 • Accepted: February 19, 2011
Copyright © 2011 The Korean Society of Community Nutrition
- 1,555 Views
- 2 Download
- 5 Crossref
Abstract
- This study was conducted to assess needs of self-management nutrition program for diabetic patients. The survey was conducted among 100 diabetic patients, and the mean age of the subjects was 54.2 years old. Thirty three percent of the subjects were diagnosed diabetes less than 2 years ago. The average nutrition knowledge score about diabetes was 10.2 point, and percentages of correct answers were very high in 'foods rich in fiber' (97.0%), 'relevance of exercise and insulin' (97.0%), 'quantity of insulin injection' (91.0%), and 'diabetes menu' (91.0%). The sources of nutrition information were hospitals/healthcare centers (56.1%), TV/radio (19.2%), and internet (13.1%). Sixty nine percent of the subjects have experienced nutrition education on subjects as 'menu planning skills' (22.4%), 'selecting foods' (22.4%), 'relevance of blood glucose and eating foods' (21.5%) by personal counseling (54.4%). The total score of eating behavior was higher after diagnosed diabetes (35.3) than before (30.0) (p < 0.001). The preferred topics in developing diabetes nutrition information websites were 'diabetes mellitus', 'relevance of blood glucose and foods', and 'selecting foods for diabetes'. The subjects wanted the websites developed by 'using mainly illustrations, pictures, tables' (22.8%) and 'using simple design' (19.6%). The preferred contents in developing diabetes self-management nutrition program were 'dietary life diagnosis', 'chronic disease risk diagnosis', 'calorie control by selecting foods and cooking skills', and 'dietary assessment'. In designing the program, the subjects' most wanted designs were 'be handy and simple in using' (29.3%), 'using simple design' (17.9%), and 'using mainly illustrations, pictures, tables' (15.7%).
-
This work was supported by Basic Science Research Program through the National Research Foundation of Korea(NRF) funded by the Ministry of Education, Science and Technology (MEST) (2010-0017210).
NOTES
- 1. Ahn Y, Kim HM, Seo JS, Yoon EY, Bae HJ, Kim KW. Needs assessment for developing a nutrition information site for elementary school children among elementary school dietitians. Korean J Community Nutr. 2007; 12(4): 405-416.
- 2. Ahn Y, Kim JH, Youn JE, Kim HS. Needs assessment for development of u-Health self-nutrition management program for diabetic patients -by using focus group interview-. Proceedings of the KSCN Conference (Oct). 2009; 196.
- 3. Chang JH. A study on the situation and demand with nutrition service in health promotion center. Korean J Nutr. 2007; 40(5): 475-482.
- 4. Chang NS, Kim SH, Kim YL. Physical and dietary characteristics in women with gestational diabetes mellitus. Korean J Nutr. 2001; 34(2): 158-164.
- 5. Choe SJ, Park HR, Park DY, Ahn HS. A study on the sociopsychological factors influencing the dietary compliance of diabetics by using focus group interview. Korean J Community Nutr. 2000; 5(1): 23-35.
- 6. Han JS, Jeong JH. A web-based internet program for nutritional counseling and diet management of patient with diabetes mellitus. J Korean Soc Food Sci Nutr. 2004; 33(1): 114-122.Article
- 7. Han JS, Lee SM, Chung HK, Ahn HS, Lee SM. Development and evaluation of a nutritional risk screening tool (NRST) for hospitalized patients. Korean J Nutr. 2009; 42(2): 119-127.Article
- 8. Hong SM, Hwang HJ, Choi SH, Jeong EM. A study in dietary habits of diabetes patients commuting to a Ulsan health center. J Human Ecol, University of Ulsan. 2000; 2(1): 1-12.
- 9. Jun JE, Lee YM, Oh YJ. A factor analysis study on blood glucose control in diabetics mellitus patients(1) -focus on blood glucose control and lifestyle factors-. Korean J Community Nutr. 2009; 14(2): 236-244.
- 10. Kang HJ, Shin EM, Kim KW. Evaluation of nutrition education for diabetes mellitus management of older adults. Korean J Community Nutr. 2009; 14(6): 734-745.
- 11. Kim MH, Moon HK. The nutritional status of a diabetes mellitus risk group and a control group in Kangbukgu. Korean J Community Nutr. 2002; 7(2): 219-231.
- 12. Kwon SY, Kwon MJ, Park KS, Cha EJ, Chun MG. Development of personal hypertension management system using PDA. J Intell Inf Syst. 2007; 17(5): 718-723.Article
- 13. Lee HS, Kim YH, Cho GC, Chough BK. Software system development for supporting nutritional management. Korean J Nutr. 1989; 22(4): 290-299.
- 14. Lee KH, Her ES. A Study on the Development of a Computer-Assisted Program for Elementary School Foodservice(2) -Based on Nutrition Management. Korean J Community Nutr. 2000; 5(2): 217-224.
- 15. Lim HS, Chyun JH, Kim YS, Nam MS. Effect of nutrition education on diabetic management in diabetic patients. Korean J Nutr. 2001; 34(1): 69-78.
- 16. Moon MY, Kim MA. Factors related to self management in middle aged and elderly with diabetes mellitus. J Korean Acad Public Health Nurs. 2005; 19(2): 261-273.
- 17. Park DY, Choe SJ, Park HR, Ahn HS. A study on the sociopsychological factors influencing the dietary compliance of diabetics using questionnaire. Korean J Community Nutr. 2000; 5(1): 36-49.
- 18. Park GS, Ly SY. Compliance and need assessment for diet therapy among diabetics and their caregivers. Korean J Community Nutr. 2003; 8(1): 91-101.
- 19. Park JC, Hwang DG, Park KS, Kim KA, Cha EJ, Jun BM. Design and Implementation of diabetes management system based on PDA in the wireless internet environment. J Korea Academia-Industrial Cooperation Soc. 2007; 8(6): 1513-1518.
- 20. Sohn CM, Yeom HS. Effects of nutrition service improvement activities for educing plate waste of the diabetic mellitus diet in a general hospital. Korean J Community Nutr. 2008; 13(5): 674-681.
- 21. Woo YJ, Lee HS, Kim WY. Individual diabetes nutrition education can help management for type diabetes. Korean J Nutr. 2006; 39(7): 641-648.
- 22. Yu CH. A study on the fat and fatty acid intake of collegewomen evaluated through internet nutritional assessment system. Korean J Nutr. 2007; 40(1): 78-88.
REFERENCES

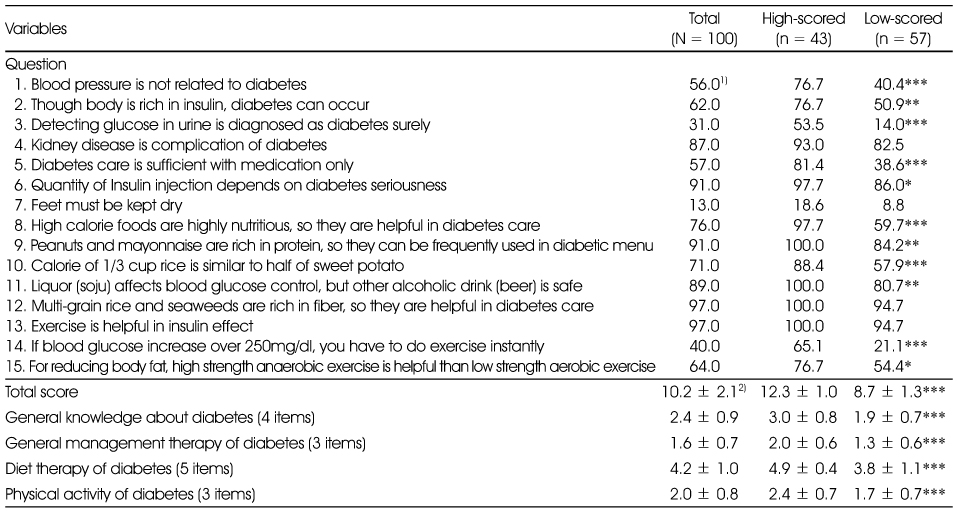

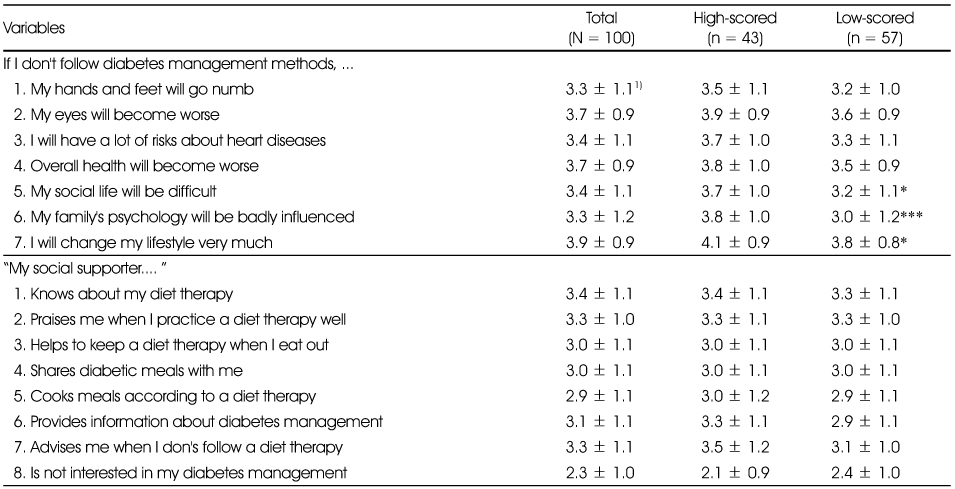
Table 5Comparison of eating behaviors before and after diagnosed diabetes (%)

**: p < 0.01, ***: p < 0.001 by χ2-test or t-test
1) Missing number: 2
2) Mean ± SD, The sum of eating behavior scores. To calculate the total score, each item was measured from 1 (0 - 2 days/week) to 3 (6 - 7 days/week) and the items of 2, 10 - 14 were scored reversely. The higher score means the better eating behaviors. The possible total score: 15 - 45
3) †††: p < 0.001 by paired t-test (before and after diagnosis)


Figure & Data
REFERENCES
Citations
Citations to this article as recorded by 
- Needs for Development of IT-based Nutritional Management Program for Women with Gestational Diabetes Mellitus
Chan-Jung Han, Sun-Young Lim, Eunsuk Oh, Yoon-Hee Choi, Kun-Ho Yoon, Jin-Hee Lee
Korean Journal of Community Nutrition.2017; 22(3): 207. CrossRef - The development of a mobile u-Health program and evaluation for self-diet management for diabetic patients
Yun Ahn, Jeahurn Bae, Hee-Seon Kim
Nutrition Research and Practice.2016; 10(3): 342. CrossRef - Dietary Life related to Sodium of Participants in Hypertension and Diabetes Preventive Education at the Public Health Center
Hee-Ok Pak, Chun-Young Sohn, Jung-Hwa Park
The Korean Journal of Food And Nutrition.2015; 28(2): 219. CrossRef - Development of Web-based u-Health Self-nutrition Management Program for Diabetic Patients
Yun Ahn, Jeahurn Bae, Hee-Seon Kim
Korean Journal of Community Nutrition.2014; 19(4): 372. CrossRef - A Study on Classification of Obesity for Koreans based on the Articles in the Korean Journal of Community Nutrition - Articles Enlisted from 1996 to 2011 -
Youngnam Kim
Korean Journal of Community Nutrition.2013; 18(5): 525. CrossRef
 Cite
CiteNeeds Assessment for Web-based Self-management Program by the Nutrition Knowledge Levels of Diabetic Patients
Needs Assessment for Web-based Self-management Program by the Nutrition Knowledge Levels of Diabetic Patients
General characteristics of the subjects
1) FBG: fasting blood glucose, n = 70, 2) n = 89
3) Mean ± SD, 4) N (%)
*: p < 0.05, **: p < 0.01, ***: p < 0.001 by t-test or χ2-test
Comparison of nutrition knowledge about diabetes mellitus
1) %, Percentages of correct answers
2) Mean ± SD, Correct answer was given 1 point. The possible total score: 0 - 15
*: p < 0.05, **: p < 0.01, ***: p < 0.001 by χ2-test or t-test
Status of self-management and nutrition education of the subjects
1) Subjects were asked to choose multiple responses
2) Asked only to those who were experienced nutrition education
3) Number of data
4) N (%)
*: p < 0.05, **: p < 0.01 by χ2-test
Attitudes about diabetes mellitus of the subjects
1) Mean ± SD, Subjects were asked to respond in 5-point scales ranging from 1 (very disagree) - 5 (very agree)
*: p < 0.05, ***: p < 0.001 by t-test
Comparison of eating behaviors before and after diagnosed diabetes (%)
**: p < 0.01, ***: p < 0.001 by χ2-test or t-test
1) Missing number: 2
2) Mean ± SD, The sum of eating behavior scores. To calculate the total score, each item was measured from 1 (0 - 2 days/week) to 3 (6 - 7 days/week) and the items of 2, 10 - 14 were scored reversely. The higher score means the better eating behaviors. The possible total score: 15 - 45
3) †††: p < 0.001 by paired t-test (before and after diagnosis)
Preferred topics and needs for design in nutrition information contents (websites)
1) Mean ± SD, Subjects were asked to respond in 3-point scales ranging from 1 (not interested) - 3 (interested)
2) Number of data. Subjects were asked to choose three responses, 3) N (%)
*: p < 0.05, **: p < 0.01, ***: p < 0.001 by t-test
Preferred substances and needs for design in nutrition management program
1) Mean ± SD, Subjects were asked to respond in 3-point scales ranging from 1 (not interested) - 3 (interested)
2) number of data. Subjects were asked to choose three responses, 3) N (%)
**: p < 0.01, ***: p < 0.001 by t-test
Table 1
General characteristics of the subjects
1) FBG: fasting blood glucose, n = 70, 2) n = 89 3) Mean ± SD, 4) N (%) *: p < 0.05, **: p < 0.01, ***: p < 0.001 by t-test or χ2-test
Table 2
Comparison of nutrition knowledge about diabetes mellitus
1) %, Percentages of correct answers 2) Mean ± SD, Correct answer was given 1 point. The possible total score: 0 - 15 *: p < 0.05, **: p < 0.01, ***: p < 0.001 by χ2-test or t-test
Table 3
Status of self-management and nutrition education of the subjects
1) Subjects were asked to choose multiple responses 2) Asked only to those who were experienced nutrition education 3) Number of data 4) N (%) *: p < 0.05, **: p < 0.01 by χ2-test
Table 4
Attitudes about diabetes mellitus of the subjects
1) Mean ± SD, Subjects were asked to respond in 5-point scales ranging from 1 (very disagree) - 5 (very agree) *: p < 0.05, ***: p < 0.001 by t-test
Table 5
Comparison of eating behaviors before and after diagnosed diabetes (%)
**: p < 0.01, ***: p < 0.001 by χ2-test or t-test 1) Missing number: 2 2) Mean ± SD, The sum of eating behavior scores. To calculate the total score, each item was measured from 1 (0 - 2 days/week) to 3 (6 - 7 days/week) and the items of 2, 10 - 14 were scored reversely. The higher score means the better eating behaviors. The possible total score: 15 - 45 3) †††: p < 0.001 by paired t-test (before and after diagnosis)
Table 6
Preferred topics and needs for design in nutrition information contents (websites)
1) Mean ± SD, Subjects were asked to respond in 3-point scales ranging from 1 (not interested) - 3 (interested) 2) Number of data. Subjects were asked to choose three responses, 3) N (%) *: p < 0.05, **: p < 0.01, ***: p < 0.001 by t-test
Table 7
Preferred substances and needs for design in nutrition management program
1) Mean ± SD, Subjects were asked to respond in 3-point scales ranging from 1 (not interested) - 3 (interested) 2) number of data. Subjects were asked to choose three responses, 3) N (%) **: p < 0.01, ***: p < 0.001 by t-test


