
Articles
- Page Path
- HOME > Korean J Community Nutr > Volume 17(6); 2012 > Article
-
Original Article
- The Effect of Sodium Reduction Education Program of a Public Health Center on the Blood Pressure, Blood Biochemical Profile and Sodium Intake of Hypertensive Adults
- Eun Jin Jung, Sook Mee Son, Jong-Sook Kwon
-
Korean Journal of Community Nutrition 2012;17(6):752-771.
DOI: https://doi.org/10.5720/kjcn.2012.17.6.752
Published online: December 31, 2012
Department of Food Science & Nutrition, The Catholic University of Korea, Bucheon, Korea.
1Department of Food & Nutrition, Shingu College, Seongnam, Korea.
- Corresponding author: Jong-Sook Kwon, Department of Food & Nutrition, Shingu College, 377 Gwangmyeong-ro, Seongnam, Gyeonggi-do 462-743, Korea. Tel: (031) 740-1642, Fax: (031) 740-1590, jskwon@shingu.ac.kr
• Received: November 6, 2012 • Revised: December 4, 2012 • Accepted: December 4, 2012
Copyright © 2012 The Korean Society of Community Nutrition
- 2,218 Views
- 17 Download
- 20 Crossref
Abstract
- This study was conducted to investigate the effect of sodium reduction education program of a public health center on the blood pressure, blood biochemical profile and sodium intake of hypertensive adults. The program continued for 16 weeks with an 8-week nutrition education and an 8-week follow-up to forty two subjects, 6 males and 36 females aged 46 to 80 years. Subjects received nutrition education including lectures, activities, cooking classes and nutrition counseling. Physical fitness, management of stress, and nutrition counseling were provided during the follow-up. The program was evaluated three times, before and after the nutrition education, and after the follow-up. Systolic blood pressure (p < 0.0001) and diastolic blood pressure (p < 0.001) were decreased after completion of the program. Body weight (p < 0.005), percent body fat (p < 0.005) and body mass index (p < 0.001) were decreased, too. There were no significant differences in blood glucose, HDL-cholesterol and triglycerides, while elevated levels of total cholesterol (p < 0.001) and LDL-cholesterol (p < 0.001) appeared after the program completion. Decreased intakes of vitamin A (p < 0.05), β-carotene (p < 0.001) and sodium (p < 0.001) were observed. Consumption frequency of noodles, soups, stews, kimchi, fishes/shellfish, seasoned vegetables, and salted seafoods/pickles (p < 0.05~p < 0.001) were decreased, while that of all food groups were not changed during the follow-up. Total score of nutrition knowledge related to sodium intake and hypertension (p < 0.001), and that of dietary behavior associated with high sodium intakes were changed positively (p < 0.001) only during the nutrition education. This sodium reduction education program, including the follow-up study showed positive effects on the blood pressure, sodium intake, nutrition knowledge and dietary behavior of hypertensive adults.
- 1. Appel LH, Moore TJ, Obarzanek E, Vollmer WM, Svetkey LP, Sacks FM, Bray GA, Vogt TM, Cutler JA, Windhauser MM, Lin PH, Karanja N. A clinical trial of the effects of dietary patterns on blood pressure. DASH collaborative research group. N Engl J Med. 1997; 336(16): 1117-1124.ArticlePubMed
- 2. Blaustein MP, Hamlyn JM. Pathogenesis of essential hypertension : A link between dietary salt and high blood pressure. Hypertension. 1991; 18: 5 Suppl. III184-III195.ArticlePubMed
- 3. Choi MK, Lee WY, Park JD. Relation among mineral (Ca, P, Fe, Na, K, Zn) intakes, blood pressure, and blood lipids in Korean adults. Korean J Nutr. 2005; 38(10): 827-835.
- 4. Choi Y, Kim C, Park YS. The effect of nutrition education program in physical health, nutritional status and health-related quality of life of the elderly in Seoul. Korean J Nutr. 2007; 40(3): 270-280.
- 5. Ju K, So H. Effects of the nutrition education program on self-efficacy, diet behavior pattern and cardiovascular risk factors for the patients with cardiovascular disease. J Korean Acad Nurs. 2008; 38(1): 64-73.Article
- 6. Elliott P, Stamler J, Nichols R, Dyer AR, Stamler R, Kesteloot H, Marmot M. Intersalt revisited : Further analyses of 24 hour sodium excretion and blood pressure within and across populations. Intersalt cooperative research group. BMJ. 1996; 312(7041): 1249-1253.ArticlePubMedPMC
- 7. Eum SO, Kim SD, Lee JS. Effects of hypertension education programs on knowledge, attitude and practice in hypertension patients. Korean Public Health Res. 2007; 33(2): 162-174.
- 8. Glanz K, Lewis FM, Romer BK. In: Glanz K, Lewis FM, Romer BK, editors. The scope of health education. Health behavior and health education. Theory, research, and practice. 1997; 2nd ed. San Francisco: Jossey-Bass Pub; 3-18.
- 9. Hagberg JM, Montain SJ, Martin WH, Ehsani AA. Effects of exercise training in 60- to 69-year-old persons with essential hypertension. Am J Cardiol. 1989; 64(5): 348-353.PubMed
- 10. He FJ, MacGreger GA. A comprehensive review on salt and health and current experience of worldwide salt reduction programmes. J Hum Hypertens. 2009; 23(6): 363-384.ArticlePubMedPDF
- 11. Jeon SM. A study of nutrition counseling effect in hypertension patients. 2005; Keimyung University; 27-59 MS thesis.
- 12. Kim MY, Han SY, Jeong JH, Kim SH, Lee JK, Park ES, Zhang XH, Seo JS. Effectiveness of nutrition-exercise education program on weight control of adult women. Korean J Community Nutr. 2009; 14(2): 168-174.
- 13. Kolasa KM. Summary of the JNC 7 guidelines for the prevention and treatment of high blood pressure. J Nutr Educ Behav. 2003; 35(5): 226-227.ArticlePubMed
- 14. Korean Nutrition Society. Dietary reference intake for Koreans. 2010; Seoul: Korean Nutrition Society.
- 15. Krauss RM, Eckel RH, Howard B, Appel LJ, Daniels SR, Deckelbaum RJ, Erdman JW, Etherton PK, Goldberg IJ, Kotchen TA, Lichtenstein AH, Mitch WE, Mullis R, Robinson K, Wylie-Rosett J, St. Jeor S, Suttie J, Tribble DL, Bazzarre TL. AHA dietary guidelines : revision 2000: A statement for healthcare professionals from the nutrition committee of the American Heart Association. Circulation. 2000; 102: 2284-2299.ArticlePubMed
- 16. Krishna GG, Miller E, Kapoor S. Increased blood pressure during potassium depletion in normotensive men. N Engl J Med. 1989; 320: 1177-1182.ArticlePubMed
- 17. Lee JW, Lee EY, Lee BK. Effect of calcium supplementation on blood pressure response to dietary sodium level in normotensive young Korean women with family history of hypertension. Korean J Nutr. 1999; 32(6): 661-670.
- 18. Lee JY, Kim CB. Direction of community health promotion in Korea. Korean J Health Educ Promot. 2000; 2(1): 3-12.
- 19. Lee YK, Sung CJ, Choi MK, Lee YS. Short term effects of sodium intakes on serum lipids and glucose in adult women. J Korean Soc Food Sci Nutr. 2002; 31(6): 1035-1042.Article
- 20. Marmot MG, Kogevinas M, Elston MA. Socioeconomic status and disease. WHO Reg Publ Eur Ser. 1991; 37: 113-146.PubMed
- 21. Meloche J. Cooking with class: participation soars with hands-on learning and take-aways. J Nutr Educ Behav. 2003; 35(2): 107.ArticlePubMed
- 22. Ministry of Health and Welfare/Korea Centers for Disease Control & Prevention. Korea Health Statistics 2010: Korea National Health and Nutrition Examination Survey(KNHANES V-1) 2010. 2011.
- 23. Ministry of Health and Welfare/Korea Health Industry Develpment Institute. National Food & Nutrition Statistics: based on 2009 Korea National Health and Nutrition Examination Survey. 2011.
- 24. Moon EH. Implementation and evaluation of nutrition education program for hypertensive patients among adults aged 50 and over. 2005; Seoul Women's University; 18-53 MS thesis.
- 25. Moon EH, Kim KW. Evaluation of nutrition education program for hypertension patients aged 50 and over. Korean J Community Nutr. 2011; 16(1): 62-74.Article
- 26. Moon HK, Lee HJ, Park Y. Comparison of health status and dietary habits by percent body fat (PBT) change for adult women in the weight control program by the community health center. Korean J Community Nutr. 2007; 12(4): 477-488.
- 27. Park EY, Park YJ, Kim KW. A study of sodium consumption and related psychosocial factors among hypertensive and normal adults. Korean J Nutr. 2000; 33(8): 833-839.
- 28. Rhee MY, Yang SJ, Oh SW, Park Y, Kim CI, Park HK, Park SW, Park CY. Novel genetic variations associated with salt sensitivity in the Korean population. Hypertens Res. 2011; 34(5): 606-611.ArticlePubMedPDF
- 29. Rhie SK, Park YJ. A study on nutrition education for rural elderly of Kyungki province in Korea. Korean J Community Living Sci. 1997; 8(1): 25-33.
- 30. Ruppert M, Diehl J, Kolloch R, Overlack A, Kraft K, Göbel B, Hitte N, Stumpe KO. Short-term dietary sodium restriction increases serum lipids and insulin in salt-sensitive and salt-resistant normotensive adults. Klin Wonchenschr. 1991; 69: Suppl 25. 51-57.
- 31. Sacks FM, Obarzanek E, Windhauser MM, Svetkey LP, Vollmer WM, McCollough M, Karanja N, Lin PH, Steele P, Proschan MA. Rationale and design of the dietary approaches to stop hypertension trial. A multicenter controlled-feeding study of dietary patterns to lower blood pressure. Ann Epidemiol. 1995; 5(2): 108-118.PubMed
- 32. Sacks FM, Svetkey LP, Vollmer WM, Appel LJ, Bray GA, Harspha D, Obarzanek E, Conlin PR, Miller ER, Simons-Morton DG, Karanja N, Lin P-W, Alckin M, Most-windhaucer MM, Moore TJ, Proschan MA, Cutler JA. for the DASH-sodium collaborative research group. Effects on blood pressure of reduced dietary sodium and the Dietary Approaches to Stop Hypertension (DASH) diet : DASH-sodium collaborative research group. N Engl J Med. 2001; 344: 3-10.PubMed
- 33. Sheahan SL, Fields B. Sodium dietary restriction, knowledge, beliefs, and decision-making behavior of older females. J Am Acad Nurse Pract. 2008; 20(4): 217-224.ArticlePubMed
- 34. Son SM, Kim MJ. The effect of nutrition education program for various chronic disease in elderly visiting public health center. Korean J Community Nutr. 2001; 6(4): 668-677.
- 35. Son SM, Huh GY, Lee HS. Development and evaluation of validity of dish frequency questionnaire (DFQ) and short DFQ using Na index for estimation of habitual sodium Intakes. Korean J Community Nutr. 2005; 10(5): 677-692.
- 36. Son SM, Huh GY. : Dietary risk factors associated with hypertension in patients. Korean J Community Nutr. 2006; 11(5): 661-672.
- 37. Son SM, Park YS, Lim HJ, Kim SB, Jeong YS. Sodium intakes of Korean adults with 24-hour urine analysis and dish frequency questionnaire and comparison of sodium intakes according to the regional area and dish group. Korean J Community Nutr. 2007; 12(5): 545-558.
- 38. Statistics Korea. Annual report on the cause of death statistics(2010). 2011; cited 2011 September 8. Available from http://kostat.go.kr.
- 39. Suter PM, Sierro C, Vetter W. Nutritional factors in control of blood pressure and hypertension. Nutr Clin Care. 2002; 5(1): 9-19.PubMed
- 40. Svetkey LP, Harsha DW, Vollmer WM, Stevens VJ, Obarzanek E, Elmer PJ. PREMIER: A clinical trial of comprehensive lifestyle modification for blood pressure control: Rationale, design and baseline characteristics. Ann Epidemiol. 2003; 13: 462-471.ArticlePubMed
- 41. Weder AB, Egan BM. Potential deleterious impact of dietary salt restriction on cardiovascular risk factors. Klin Wochenschr. 1991; 69: suppl 25. 45-50.ArticlePDF
- 42. Yim KS. Evaluation of the effectiveness of a nutrition education program for hypertensive patients at the community level. Korean J Community Nutr. 2000; 5(4): 654-661.
- 43. Yim KS. The effects of a nutrition education program for hypertensive female elderly at the public health center. Korean J Community Nutr. 2008; 13(5): 640-652.
- 44. Yoon JS, Jeong YH, Park JA, Oh HM. The effect of individualized nutritional education on adults having two or more symptoms of chronic degenerative disease. Korean J Community Nutr. 2002; 7(6): 794-802.
REFERENCES

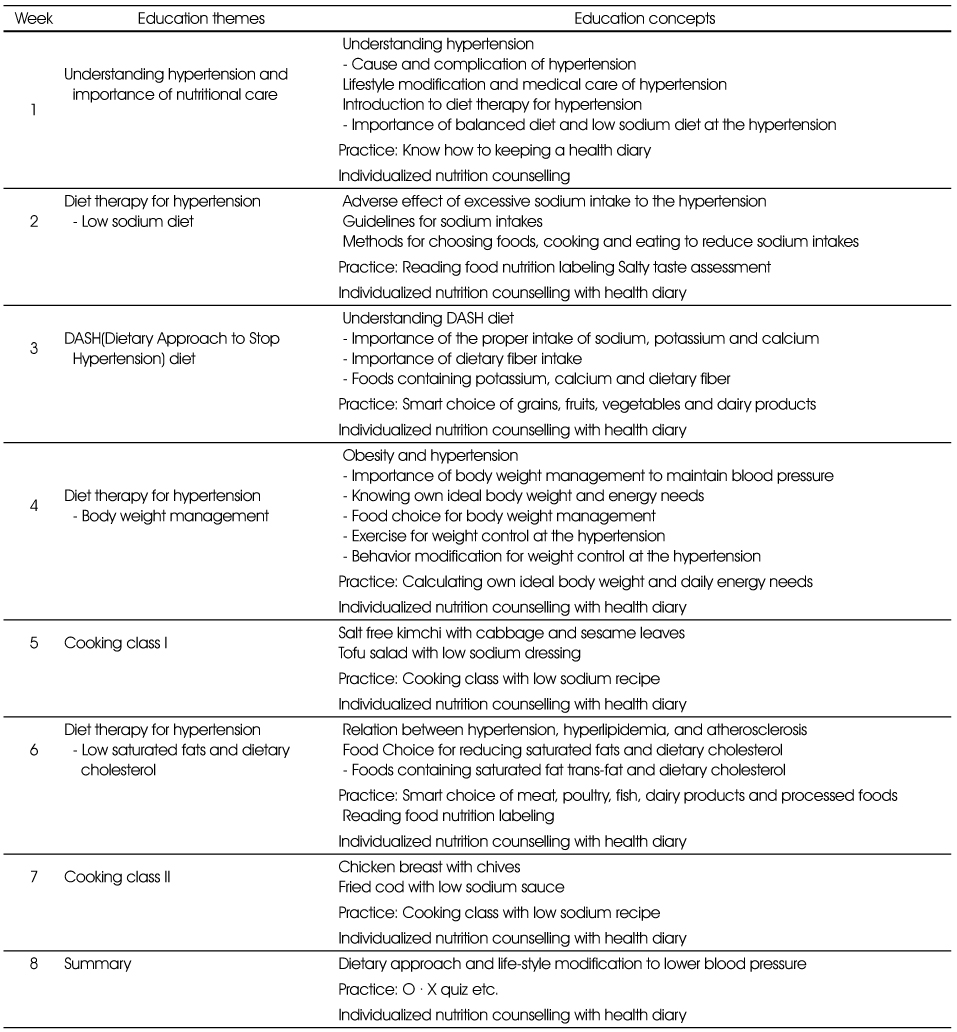
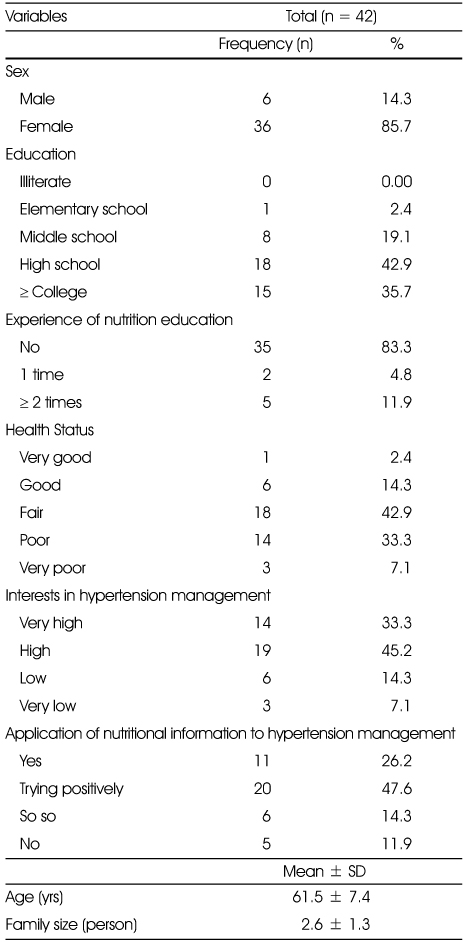
Table 3Changes of anthropometric characteristics and blood pressure during the education program
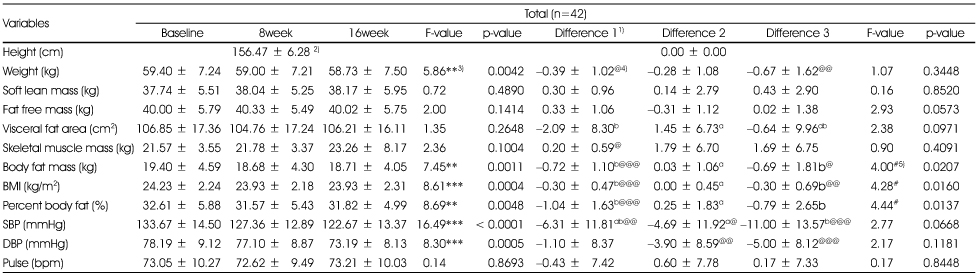
1) Difference 1= difference (8weeks-baseline), Difference 2=difference (16weeks-8week), Difference 3=difference (16weeks-baseline)
2) Mean ± SD
3) *: Means significantly different among 3 times at p < 0.05, **: p < 0.01, ***: p < 0.001 by repeated GLM
4) @: Means significantly different between baseline and 8weeks or 8weeks and 16weeks or baseline and 16weeks within group at p < 0.05, @@: p < 0.01, @@@: p < 0.001 by paired t-test
5) #: Means significantly different among 3 differences at p < 0.05, ##: p < 0.01, ###: p < 0.001 by one-way GLM
Table 4Changes of biochemical characteristics during the education program
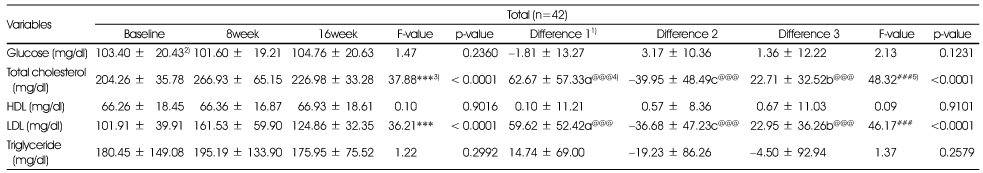
1) Difference 1 = difference (8 weeks-baseline), Difference 2 = difference (16 weeks-8 week), Difference 3 = difference (16 weeks-baseline)
2) Mean ± SD
3) *: Means significantly different among 3 times at p < 0.05, **: p < 0.01, ***: p < 0.001 by repeated GLM
4) @: Means significantly different between baseline and 8weeks or 8weeks and 16weeks or baseline and 16weeks within group at p < 0.05, @@: p < 0.01, @@@: p < 0.001 by paired t-test
5) #: Means significantly different among 3 differences at p < 0.05, ##: p < 0.01, ###: p < 0.001 by one-way GLM
Table 5Changes of nutrient intakes during the education program
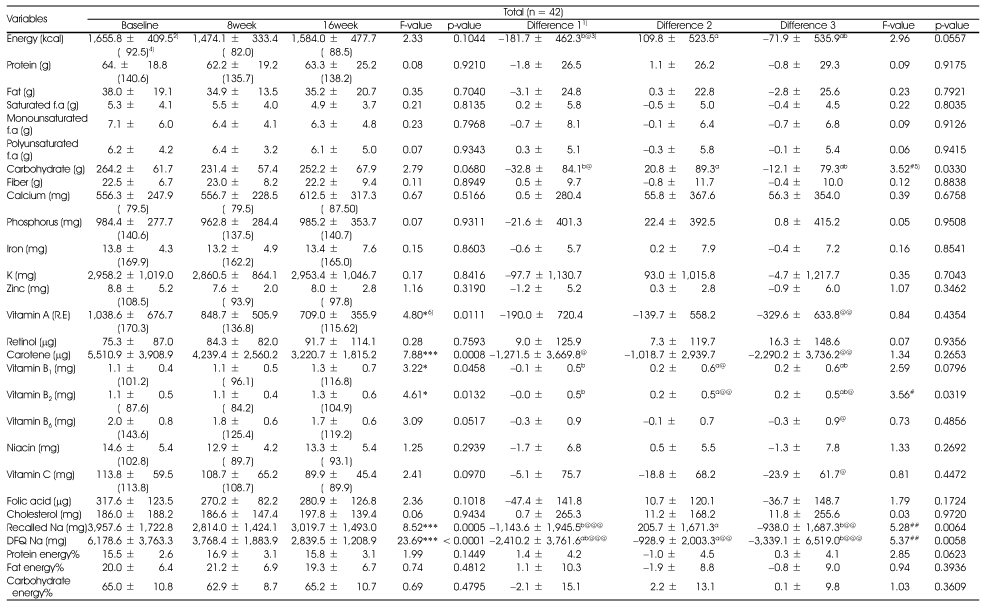
1) Difference 1 = difference (8 weeks-baseline), Difference 2 = difference (16 weeks-8week), Difference 3 = difference (16 weeks-baseline)
2) Mean ± SD
3) @: Means significantly different between baseline and 8weeks or 8weeks and 16weeks or baseline and 16weeks within group at p < 0.05, @@: p < 0.01, @@@: p < 0.001 by paired t-test
4) mean % of RNI (Recommended Nutrient Intake of Dietary reference intakes for Koreans)
5) #: Means significantly different among 3 differences at p < 0.05, ##: p < 0.01, ###: p < 0.001 by one-way GLM
6) *: Means significantly different among 3 times at p < 0.05, **: p < 0.01, ***: p < 0.001 by repeated GLM
Table 6Changes of food intakes frequency during the education program
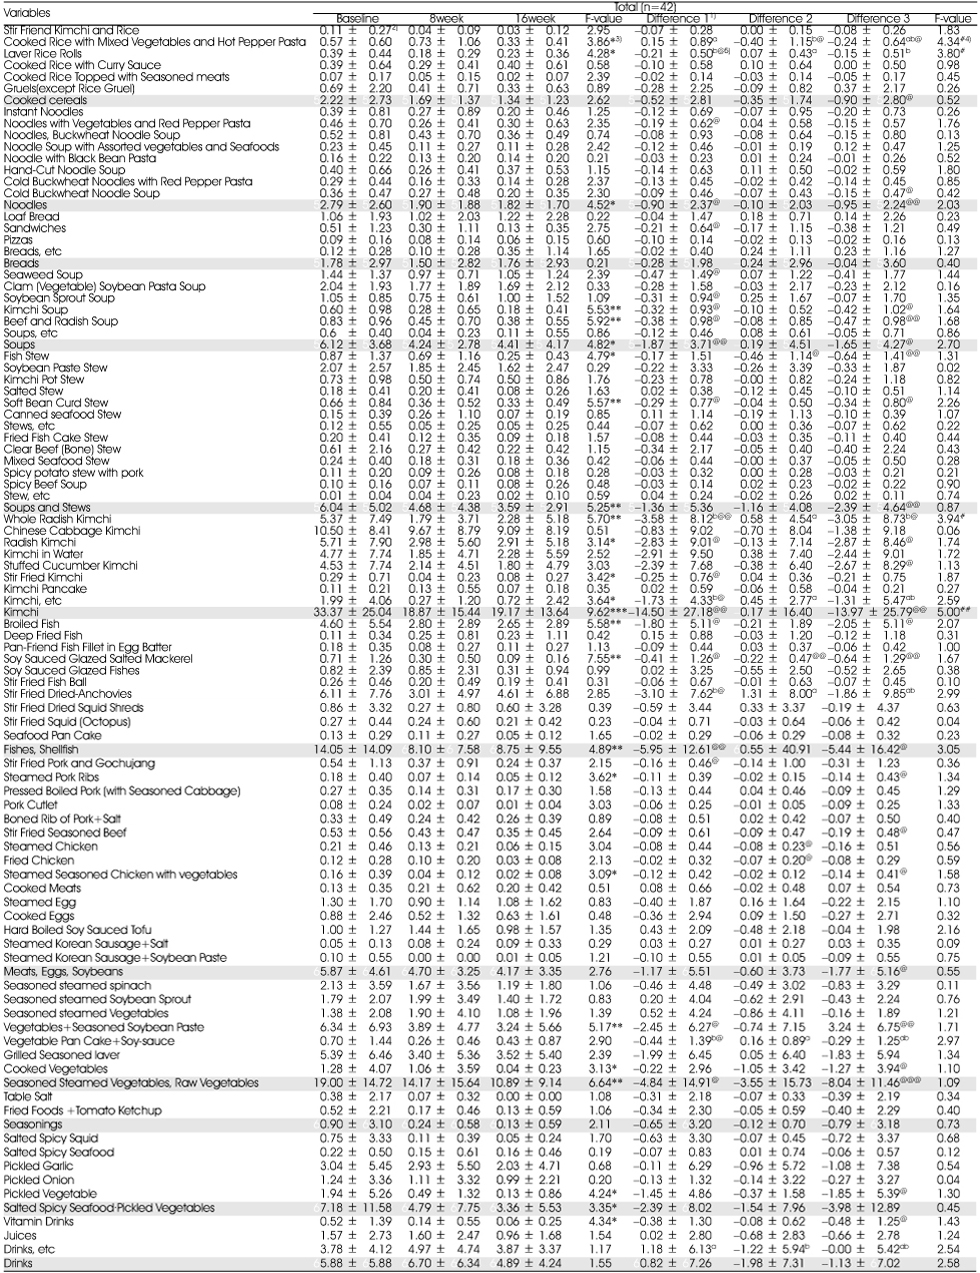
1) Difference 1 = difference (8 weeks-baseline), Difference 2 = difference (16 weeks-8week), Difference 3 = difference (16 weeks-baseline)
2) Mean ± SD
3) *: Means significantly different among 3 times at p < 0.05, **: p < 0.01, ***: p < 0.001 by repeated GLM
4) #: Means significantly different among 3 differences at p < 0.05, ##: p < 0.01, ###: p < 0.001 by one-way GLM
5) @: Means significantly different between baseline and 8weeks or 8weeks and 16weeks or baseline and 16weeks within group at p < 0.05, @@: p < 0.01, @@@: p < 0.001 by paired t-test
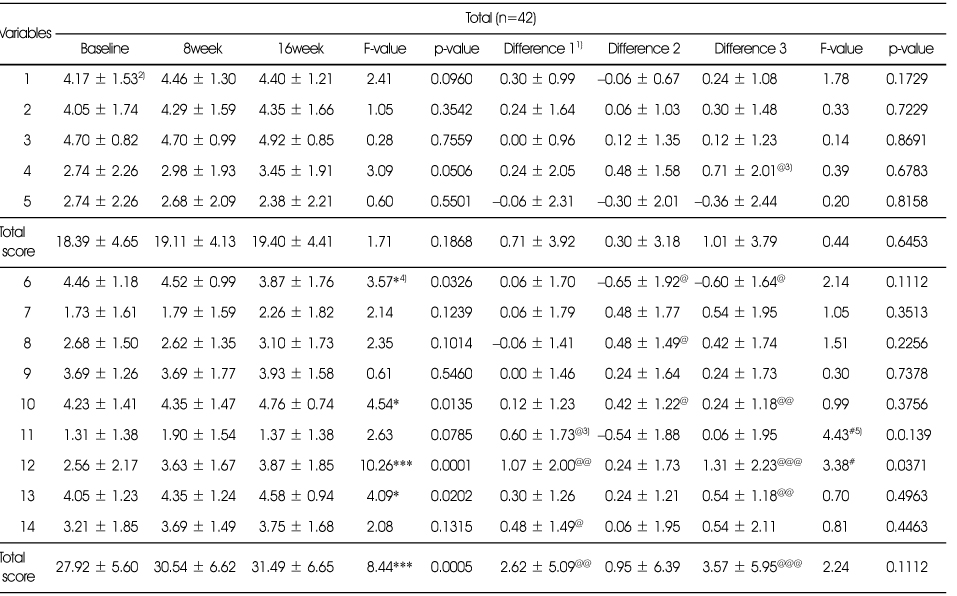
Table 7Changes of nutrition knowledge related to sodium and hypertension during the education program
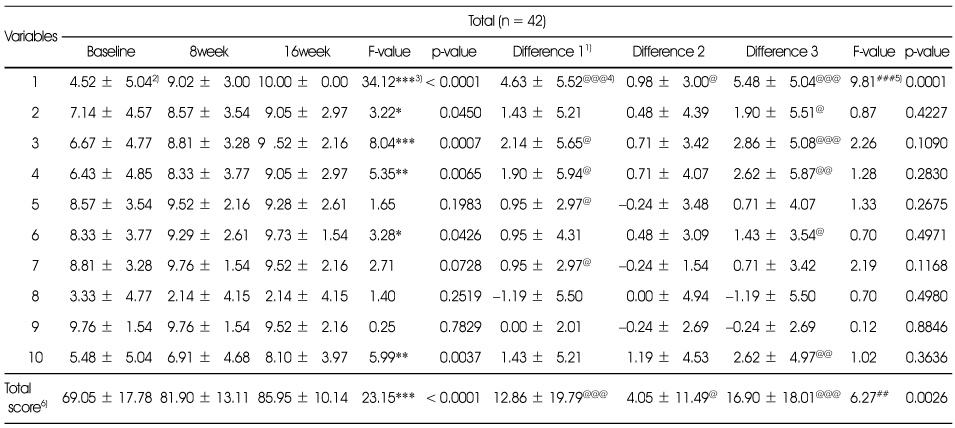
1) Difference 1 = difference (8weeks-baseline), Difference 2 = difference (16 weeks-8 week), Difference 3 = difference (16weeks-baseline)
2) Mean ± SD
3) *: Means significantly different among 3 times at p < 0.05, **: p < 0.01, ***: p < 0.001 by repeated GLM
4) @: Means significantly different between baseline and 8weeks or 8weeks and 16weeks or baseline and 16weeks within group at p < 0.05, @@: p < 0.01, @@@: p < 0.001 by paired t-test
5) #: Means significantly different among 3 differences at p < 0.05, ##: p < 0.01, ###: p < 0.001 by one-way GLM
6) Total score = 100
Nutrition labeling shows sodium contents of processed food
Canned foods and instant foods contain lots of sodium
Using spices such as vinegar, mustard or soybean sauce instead of salt can reduce sodium intake
Salt substitute is a good way to reduce sodium intake
Increased risk of hypertension is associated with high level of serum triglycerides
Having family history of hypertension can elevate incidence of hypertension to descendent
Lowering body weight can reduce blood pressure
All the elderly has high blood pressure
Stress can lead to elevate blood pressure
Pregnancy can lead to elevate blood pressure in female
Table 8Changes of dietary behavior related to sodium intakes during the education program
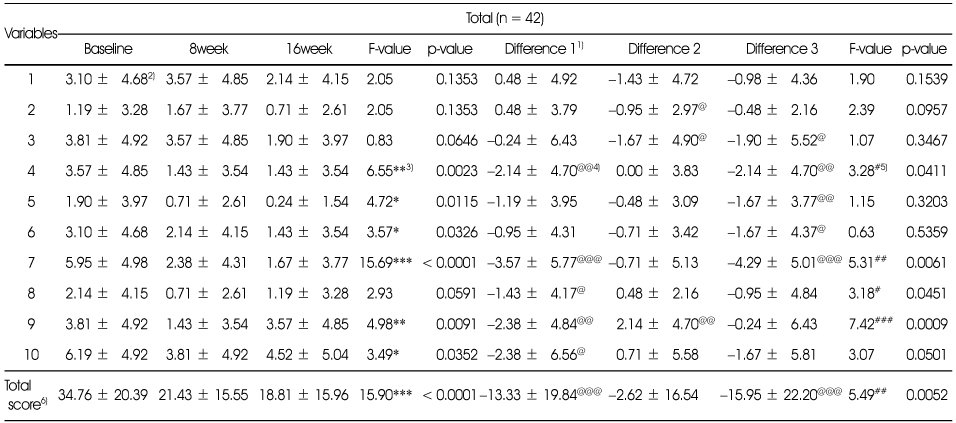
1) Difference 1 = difference (8 weeks-baseline), Difference 2 = difference (16 weeks-8 week), Difference 3 = difference (16 weeks-baseline)
2) Mean ± SD
3) *: Means significantly different among 3 times at p < 0.05, **: p < 0.01, ***: p < 0.001 by repeated GLM
4) @: Means significantly different between baseline and 8weeks or 8weeks and 16weeks or baseline and 16weeks within group at p < 0.05, @@: p < 0.01, @@@: p < 0.001 by paired t-test
5) #: Means significantly different among 3 differences at p < 0.05, ##: p < 0.01, ###: p < 0.001 by one-way GLM
6) Total score = 100
Enjoying dried seafoods or seasoned fish
Enjoying salted fish such as salted spicy pollack roe
Enjoying cooked rice topped with seasoned meats/seafoods or one-dish meal
Usually drinking all soup or stew
Enjoying instant foods such as ramyon, canned food, ham.
Eating-out or taking delivery dishes more than twice a week
Enjoying Kimchi and pickled vegetables
Adding lots of soy-sauce or vinegar-hot pepper paste to fried foods, pan-fried foods or sashimi
Enjoying salty taste and thinking that salty taste is important one
Usually using soy-sauce than vinegar when cooking vegetables
Table 9Changes of general dietary habits during the education program
1) Difference 1 = difference (8 weeks-baseline), Difference 2 = difference (16 weeks-8 week), Difference 3 = difference (16 weeks-baseline)
2) Mean ± SD
3) @: Means significantly different between baseline and 8weeks or 8weeks and 16weeks or baseline and 16weeks within group at p < 0.05, @@: p < 0.01, @@@: p < 0.001 by paired t-test
4) *: Means significantly different among 3 times at p < 0.05, **: p < 0.01, ***: p < 0.001 by repeated GLM
5) #: Means significantly different among 3 differences at p < 0.05, ##: p < 0.01, ###: p < 0.001 by one-way GLM
Having 3 meals a day without missing any meal
Having breakfast everyday
Having enough time when eating
Having meals often after 10 PM.
Eating until feeing full.
Having cereals such as rice, breads, noodles, potatoes every meal.
Having meats or eggs more than once a day
Having fishes more than once a day
Having soybean products such as tofu or soymilk everyday
Having vegetable dishes (except kimchi) everyday
Having dishes cooking with oils every meal
Having milk or dairy products everyday
Having fruits everyday
Trying to have various foods in a day
Table 10Changes of self efficacy scores during the education program
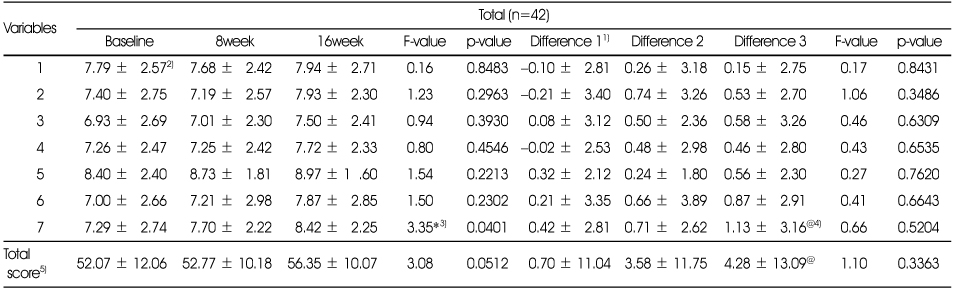
1) Difference 1 = difference (8 weeks-baseline), Difference 2 = difference (16 weeks-8 week), Difference 3 = difference(16 weeks-baseline)
2) Mean ± SD
3) *: Means significantly different among 3 times at p < 0.05, **: p < 0.01, ***: p < 0.001 by repeated GLM
4) @: Means significantly different between baseline and 8weeks or 8weeks and 16weeks or baseline and 16weeks within group at p < 0.05, @@: p < 0.01, @@@: p < 0.001 by paired t-test
5) Total score = 70
Having three meals a day regularly
Always having appropriate amount of fruits, vegetables and cereals
Concerning about lowering salty foods
Concerning about lowering consumption of foods with lots of sugar
Concerning about lowering consumption of processed foods and instant foods
Doing exercise more than three times a week regularly
Concerning about health and reading the information about health management
Figure & Data
REFERENCES
Citations
Citations to this article as recorded by 
- Changes in the importance and performance of low-sodium management among childcare center cooks in Yongin, South Korea, after salinometer support programs: a descriptive study
Jiwoo Min, Youngmi Lee, Yunhee Chang, Yujin Lee
Korean Journal of Community Nutrition.2024; 29(4): 304. CrossRef - Effects of nutrition education on cardio-metabolic outcomes: A randomised clinical trial
Hildemar Dos Santos, W Lawrence Beeson, Gina Segovia-Siapco, Brenda Koranda, Tony Jehi
Health Education Journal.2020; 79(4): 458. CrossRef - Effects of a Self-Care Reinforcement Program for Socially Vulnerable Elderly Women with Metabolic Syndrome in Korea
Mikyung Park, Kiwol Sung
Journal of Korean Academy of Community Health Nursing.2019; 30(3): 271. CrossRef - Current status, perception and practicability of restaurant staffs related to reducing sodium use in Seongnam, Korea
So-Hyun Ahn, Jong Sook Kwon, Kyungmin Kim, Yoonna Lee, Hye-Kyeong Kim
Journal of Nutrition and Health.2019; 52(5): 475. CrossRef - Effect of a public health center-based nutrition education program for hypertension in women older than 50 years of age
Seoyun Park, Jong-Sook Kwon, Hye-Kyeong Kim
Journal of Nutrition and Health.2018; 51(3): 228. CrossRef - Effects of Korean diet control nutrition education on cardiovascular disease risk factors in patients who underwent cardiovascular disease surgery
Su-Jin Jung, Soo-Wan Chae
Journal of Nutrition and Health.2018; 51(3): 215. CrossRef - Stages of Behavioral Change for Reducing Sodium Intake in Korean Consumers: Comparison of Characteristics Based on Social Cognitive Theory
So-hyun Ahn, Jong Kwon, Kyungmin Kim, Hye-Kyeong Kim
Nutrients.2017; 9(8): 808. CrossRef - Study of the characteristics of dietary behavior and the effects of nutrition education for sodium reduction according to the stages of behavioral change in sodium reduction of male adult subjects in Gwangju·Jeonnam regions
Young Ran Heo, Hyun Young Oh, Hee Kyong Ro
Journal of Nutrition and Health.2017; 50(5): 472. CrossRef - Nutrition knowledge, eating attitudes, nutrition behavior, self-efficacy of childcare center foodservice employees by stages of behavioral change in reducing sodium intake
Yun Ahn, Kyung Won Kim, Kyungmin Kim, Jinwon Pyun, Ikhyun Yeo, Kisun Nam
Journal of Nutrition and Health.2015; 48(5): 429. CrossRef - Dietary Life related to Sodium of Participants in Hypertension and Diabetes Preventive Education at the Public Health Center
Hee-Ok Pak, Chun-Young Sohn, Jung-Hwa Park
The Korean Journal of Food And Nutrition.2015; 28(2): 219. CrossRef - Evaluation of Consumer Nutrition Education Program to Reduce Sodium Intake Based on Social Cognitive Theory
So-Hyun Ahn, Jong Sook Kwon, Kyung Min Kim, Jin-Sook Yoon, Hye-Kyeong Kim
Korean Journal of Community Nutrition.2015; 20(6): 433. CrossRef - Effects of Dietary Education on Low-sodium Diet Adaptation
Hae Young Kim, Juhyeon Kim
Journal of the Korean Society of Food Culture.2014; 29(2): 212. CrossRef - Implementation and Evaluation of Nutrition Capacity Training Program for Dietitians and Related Professionals Working at Customized Home Visiting Health Services
Sook Bae Kim, Jin Sook Yoon, Kyung Won Kim
Korean Journal of Community Nutrition.2014; 19(1): 71. CrossRef - The Study on Dietary Behavior and Health Related Behaviors of Self Perceived Sodium Intake Groups
Juhyeon Kim, Hei-Ryeo Yoon, Nam-E Kang
Journal of The Korean Society of Food Culture.2014; 29(6): 511. CrossRef - Sodium Related Recognition, Dietary Attitude and Education Needs of Dietitians Working at Customized Home Visiting Health Service
Yun-Jeong Mo, Sook-Bae Kim
Korean Journal of Community Nutrition.2014; 19(6): 558. CrossRef - Development of Nutrition Education Program for Consumers to Reduce Sodium Intake Applying the Social Cognitive Theory: Based on Focus Group Interviews
So-Hyun Ahn, Hye-Kyeong Kim, Kyung Min Kim, Jin-sook Yoon, Jong Sook Kwon
Korean Journal of Community Nutrition.2014; 19(4): 342. CrossRef - The Effectiveness of Na Reduction Program for Cook in Child-care Center: Focus on Self-reevaluation and Strengthen Consciousness
Hyewon Shin, Youngmee Lee
Korean Journal of Community Nutrition.2014; 19(5): 425. CrossRef - The Effects of Low-sodium Diet Education Program on Dietary Habits, Diet Quality and Obesity Index in Overweight and Obese Middle-aged Women
Soo Bin Jeong, Seoyun Park, Sohyun Ahn, Jin Nam Kim, Hye-Kyeong Kim
Korean Journal of Community Nutrition.2014; 19(6): 513. CrossRef - Blood Pressure, Sodium Intake and Dietary Behavior Changes by Session Attendance on Salt Reduction Education Program for Pre-hypertensive Adults in a Public Health Center
Eun-Jin Jung, Jong-Sook Kwon, So-Hyun Ahn, Sook Mee Son
Korean Journal of Community Nutrition.2013; 18(6): 626. CrossRef - A Survey on the Salt Content of Kindergarten Lunch Meals and Meal Providers' Dietary Attitude to Sodium Intake in Gyeonggi-do Area
Jin Nam Kim, Seoyun Park, Sohyun Ahn, Hye-Kyeong Kim
Korean Journal of Community Nutrition.2013; 18(5): 478. CrossRef
 Cite
CiteThe Effect of Sodium Reduction Education Program of a Public Health Center on the Blood Pressure, Blood Biochemical Profile and Sodium Intake of Hypertensive Adults
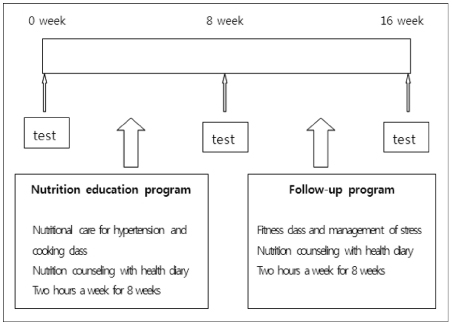
Fig. 1
Process of the program.
Fig. 1
The Effect of Sodium Reduction Education Program of a Public Health Center on the Blood Pressure, Blood Biochemical Profile and Sodium Intake of Hypertensive Adults
Nutrition education program for the hypertension
General characteristics of subjects
Changes of anthropometric characteristics and blood pressure during the education program
1) Difference 1= difference (8weeks-baseline), Difference 2=difference (16weeks-8week), Difference 3=difference (16weeks-baseline)
2) Mean ± SD
3) *: Means significantly different among 3 times at p < 0.05, **: p < 0.01, ***: p < 0.001 by repeated GLM
4) @: Means significantly different between baseline and 8weeks or 8weeks and 16weeks or baseline and 16weeks within group at p < 0.05, @@: p < 0.01, @@@: p < 0.001 by paired t-test
5) #: Means significantly different among 3 differences at p < 0.05, ##: p < 0.01, ###: p < 0.001 by one-way GLM
Changes of biochemical characteristics during the education program
1) Difference 1 = difference (8 weeks-baseline), Difference 2 = difference (16 weeks-8 week), Difference 3 = difference (16 weeks-baseline)
2) Mean ± SD
3) *: Means significantly different among 3 times at p < 0.05, **: p < 0.01, ***: p < 0.001 by repeated GLM
4) @: Means significantly different between baseline and 8weeks or 8weeks and 16weeks or baseline and 16weeks within group at p < 0.05, @@: p < 0.01, @@@: p < 0.001 by paired t-test
5) #: Means significantly different among 3 differences at p < 0.05, ##: p < 0.01, ###: p < 0.001 by one-way GLM
Changes of nutrient intakes during the education program
1) Difference 1 = difference (8 weeks-baseline), Difference 2 = difference (16 weeks-8week), Difference 3 = difference (16 weeks-baseline)
2) Mean ± SD
3) @: Means significantly different between baseline and 8weeks or 8weeks and 16weeks or baseline and 16weeks within group at p < 0.05, @@: p < 0.01, @@@: p < 0.001 by paired t-test
4) mean % of RNI (Recommended Nutrient Intake of Dietary reference intakes for Koreans)
5) #: Means significantly different among 3 differences at p < 0.05, ##: p < 0.01, ###: p < 0.001 by one-way GLM
6) *: Means significantly different among 3 times at p < 0.05, **: p < 0.01, ***: p < 0.001 by repeated GLM
Changes of food intakes frequency during the education program
1) Difference 1 = difference (8 weeks-baseline), Difference 2 = difference (16 weeks-8week), Difference 3 = difference (16 weeks-baseline)
2) Mean ± SD
3) *: Means significantly different among 3 times at p < 0.05, **: p < 0.01, ***: p < 0.001 by repeated GLM
4) #: Means significantly different among 3 differences at p < 0.05, ##: p < 0.01, ###: p < 0.001 by one-way GLM
5) @: Means significantly different between baseline and 8weeks or 8weeks and 16weeks or baseline and 16weeks within group at p < 0.05, @@: p < 0.01, @@@: p < 0.001 by paired t-test
Changes of nutrition knowledge related to sodium and hypertension during the education program
1) Difference 1 = difference (8weeks-baseline), Difference 2 = difference (16 weeks-8 week), Difference 3 = difference (16weeks-baseline)
2) Mean ± SD
3) *: Means significantly different among 3 times at p < 0.05, **: p < 0.01, ***: p < 0.001 by repeated GLM
4) @: Means significantly different between baseline and 8weeks or 8weeks and 16weeks or baseline and 16weeks within group at p < 0.05, @@: p < 0.01, @@@: p < 0.001 by paired t-test
5) #: Means significantly different among 3 differences at p < 0.05, ##: p < 0.01, ###: p < 0.001 by one-way GLM
6) Total score = 100
Nutrition labeling shows sodium contents of processed food Canned foods and instant foods contain lots of sodium Using spices such as vinegar, mustard or soybean sauce instead of salt can reduce sodium intake Salt substitute is a good way to reduce sodium intake Increased risk of hypertension is associated with high level of serum triglycerides Having family history of hypertension can elevate incidence of hypertension to descendent Lowering body weight can reduce blood pressure All the elderly has high blood pressure Stress can lead to elevate blood pressure Pregnancy can lead to elevate blood pressure in female
Changes of dietary behavior related to sodium intakes during the education program
1) Difference 1 = difference (8 weeks-baseline), Difference 2 = difference (16 weeks-8 week), Difference 3 = difference (16 weeks-baseline)
2) Mean ± SD
3) *: Means significantly different among 3 times at p < 0.05, **: p < 0.01, ***: p < 0.001 by repeated GLM
4) @: Means significantly different between baseline and 8weeks or 8weeks and 16weeks or baseline and 16weeks within group at p < 0.05, @@: p < 0.01, @@@: p < 0.001 by paired t-test
5) #: Means significantly different among 3 differences at p < 0.05, ##: p < 0.01, ###: p < 0.001 by one-way GLM
6) Total score = 100
Enjoying dried seafoods or seasoned fish Enjoying salted fish such as salted spicy pollack roe Enjoying cooked rice topped with seasoned meats/seafoods or one-dish meal Usually drinking all soup or stew Enjoying instant foods such as ramyon, canned food, ham. Eating-out or taking delivery dishes more than twice a week Enjoying Kimchi and pickled vegetables Adding lots of soy-sauce or vinegar-hot pepper paste to fried foods, pan-fried foods or sashimi Enjoying salty taste and thinking that salty taste is important one Usually using soy-sauce than vinegar when cooking vegetables
Changes of general dietary habits during the education program
1) Difference 1 = difference (8 weeks-baseline), Difference 2 = difference (16 weeks-8 week), Difference 3 = difference (16 weeks-baseline)
2) Mean ± SD
3) @: Means significantly different between baseline and 8weeks or 8weeks and 16weeks or baseline and 16weeks within group at p < 0.05, @@: p < 0.01, @@@: p < 0.001 by paired t-test
4) *: Means significantly different among 3 times at p < 0.05, **: p < 0.01, ***: p < 0.001 by repeated GLM
5) #: Means significantly different among 3 differences at p < 0.05, ##: p < 0.01, ###: p < 0.001 by one-way GLM
Having 3 meals a day without missing any meal Having breakfast everyday Having enough time when eating Having meals often after 10 PM. Eating until feeing full. Having cereals such as rice, breads, noodles, potatoes every meal. Having meats or eggs more than once a day Having fishes more than once a day Having soybean products such as tofu or soymilk everyday Having vegetable dishes (except kimchi) everyday Having dishes cooking with oils every meal Having milk or dairy products everyday Having fruits everyday Trying to have various foods in a day
Changes of self efficacy scores during the education program
1) Difference 1 = difference (8 weeks-baseline), Difference 2 = difference (16 weeks-8 week), Difference 3 = difference(16 weeks-baseline)
2) Mean ± SD
3) *: Means significantly different among 3 times at p < 0.05, **: p < 0.01, ***: p < 0.001 by repeated GLM
4) @: Means significantly different between baseline and 8weeks or 8weeks and 16weeks or baseline and 16weeks within group at p < 0.05, @@: p < 0.01, @@@: p < 0.001 by paired t-test
5) Total score = 70
Having three meals a day regularly Always having appropriate amount of fruits, vegetables and cereals Concerning about lowering salty foods Concerning about lowering consumption of foods with lots of sugar Concerning about lowering consumption of processed foods and instant foods Doing exercise more than three times a week regularly Concerning about health and reading the information about health management
Table 1
Nutrition education program for the hypertension
Table 2
General characteristics of subjects
Table 3
Changes of anthropometric characteristics and blood pressure during the education program
1) Difference 1= difference (8weeks-baseline), Difference 2=difference (16weeks-8week), Difference 3=difference (16weeks-baseline) 2) Mean ± SD 3) *: Means significantly different among 3 times at p < 0.05, **: p < 0.01, ***: p < 0.001 by repeated GLM 4) @: Means significantly different between baseline and 8weeks or 8weeks and 16weeks or baseline and 16weeks within group at p < 0.05, @@: p < 0.01, @@@: p < 0.001 by paired t-test 5) #: Means significantly different among 3 differences at p < 0.05, ##: p < 0.01, ###: p < 0.001 by one-way GLM
Table 4
Changes of biochemical characteristics during the education program
1) Difference 1 = difference (8 weeks-baseline), Difference 2 = difference (16 weeks-8 week), Difference 3 = difference (16 weeks-baseline) 2) Mean ± SD 3) *: Means significantly different among 3 times at p < 0.05, **: p < 0.01, ***: p < 0.001 by repeated GLM 4) @: Means significantly different between baseline and 8weeks or 8weeks and 16weeks or baseline and 16weeks within group at p < 0.05, @@: p < 0.01, @@@: p < 0.001 by paired t-test 5) #: Means significantly different among 3 differences at p < 0.05, ##: p < 0.01, ###: p < 0.001 by one-way GLM
Table 5
Changes of nutrient intakes during the education program
1) Difference 1 = difference (8 weeks-baseline), Difference 2 = difference (16 weeks-8week), Difference 3 = difference (16 weeks-baseline) 2) Mean ± SD 3) @: Means significantly different between baseline and 8weeks or 8weeks and 16weeks or baseline and 16weeks within group at p < 0.05, @@: p < 0.01, @@@: p < 0.001 by paired t-test 4) mean % of RNI (Recommended Nutrient Intake of Dietary reference intakes for Koreans) 5) #: Means significantly different among 3 differences at p < 0.05, ##: p < 0.01, ###: p < 0.001 by one-way GLM 6) *: Means significantly different among 3 times at p < 0.05, **: p < 0.01, ***: p < 0.001 by repeated GLM
Table 6
Changes of food intakes frequency during the education program
1) Difference 1 = difference (8 weeks-baseline), Difference 2 = difference (16 weeks-8week), Difference 3 = difference (16 weeks-baseline) 2) Mean ± SD 3) *: Means significantly different among 3 times at p < 0.05, **: p < 0.01, ***: p < 0.001 by repeated GLM 4) #: Means significantly different among 3 differences at p < 0.05, ##: p < 0.01, ###: p < 0.001 by one-way GLM 5) @: Means significantly different between baseline and 8weeks or 8weeks and 16weeks or baseline and 16weeks within group at p < 0.05, @@: p < 0.01, @@@: p < 0.001 by paired t-test
Table 7
Changes of nutrition knowledge related to sodium and hypertension during the education program
1) Difference 1 = difference (8weeks-baseline), Difference 2 = difference (16 weeks-8 week), Difference 3 = difference (16weeks-baseline) 2) Mean ± SD 3) *: Means significantly different among 3 times at p < 0.05, **: p < 0.01, ***: p < 0.001 by repeated GLM 4) @: Means significantly different between baseline and 8weeks or 8weeks and 16weeks or baseline and 16weeks within group at p < 0.05, @@: p < 0.01, @@@: p < 0.001 by paired t-test 5) #: Means significantly different among 3 differences at p < 0.05, ##: p < 0.01, ###: p < 0.001 by one-way GLM 6) Total score = 100
Nutrition labeling shows sodium contents of processed food Canned foods and instant foods contain lots of sodium Using spices such as vinegar, mustard or soybean sauce instead of salt can reduce sodium intake Salt substitute is a good way to reduce sodium intake Increased risk of hypertension is associated with high level of serum triglycerides Having family history of hypertension can elevate incidence of hypertension to descendent Lowering body weight can reduce blood pressure All the elderly has high blood pressure Stress can lead to elevate blood pressure Pregnancy can lead to elevate blood pressure in female
Table 8
Changes of dietary behavior related to sodium intakes during the education program
1) Difference 1 = difference (8 weeks-baseline), Difference 2 = difference (16 weeks-8 week), Difference 3 = difference (16 weeks-baseline) 2) Mean ± SD 3) *: Means significantly different among 3 times at p < 0.05, **: p < 0.01, ***: p < 0.001 by repeated GLM 4) @: Means significantly different between baseline and 8weeks or 8weeks and 16weeks or baseline and 16weeks within group at p < 0.05, @@: p < 0.01, @@@: p < 0.001 by paired t-test 5) #: Means significantly different among 3 differences at p < 0.05, ##: p < 0.01, ###: p < 0.001 by one-way GLM 6) Total score = 100
Enjoying dried seafoods or seasoned fish Enjoying salted fish such as salted spicy pollack roe Enjoying cooked rice topped with seasoned meats/seafoods or one-dish meal Usually drinking all soup or stew Enjoying instant foods such as ramyon, canned food, ham. Eating-out or taking delivery dishes more than twice a week Enjoying Kimchi and pickled vegetables Adding lots of soy-sauce or vinegar-hot pepper paste to fried foods, pan-fried foods or sashimi Enjoying salty taste and thinking that salty taste is important one Usually using soy-sauce than vinegar when cooking vegetables
Table 9
Changes of general dietary habits during the education program
1) Difference 1 = difference (8 weeks-baseline), Difference 2 = difference (16 weeks-8 week), Difference 3 = difference (16 weeks-baseline) 2) Mean ± SD 3) @: Means significantly different between baseline and 8weeks or 8weeks and 16weeks or baseline and 16weeks within group at p < 0.05, @@: p < 0.01, @@@: p < 0.001 by paired t-test 4) *: Means significantly different among 3 times at p < 0.05, **: p < 0.01, ***: p < 0.001 by repeated GLM 5) #: Means significantly different among 3 differences at p < 0.05, ##: p < 0.01, ###: p < 0.001 by one-way GLM
Having 3 meals a day without missing any meal Having breakfast everyday Having enough time when eating Having meals often after 10 PM. Eating until feeing full. Having cereals such as rice, breads, noodles, potatoes every meal. Having meats or eggs more than once a day Having fishes more than once a day Having soybean products such as tofu or soymilk everyday Having vegetable dishes (except kimchi) everyday Having dishes cooking with oils every meal Having milk or dairy products everyday Having fruits everyday Trying to have various foods in a day
Table 10
Changes of self efficacy scores during the education program
1) Difference 1 = difference (8 weeks-baseline), Difference 2 = difference (16 weeks-8 week), Difference 3 = difference(16 weeks-baseline) 2) Mean ± SD 3) *: Means significantly different among 3 times at p < 0.05, **: p < 0.01, ***: p < 0.001 by repeated GLM 4) @: Means significantly different between baseline and 8weeks or 8weeks and 16weeks or baseline and 16weeks within group at p < 0.05, @@: p < 0.01, @@@: p < 0.001 by paired t-test 5) Total score = 70
Having three meals a day regularly Always having appropriate amount of fruits, vegetables and cereals Concerning about lowering salty foods Concerning about lowering consumption of foods with lots of sugar Concerning about lowering consumption of processed foods and instant foods Doing exercise more than three times a week regularly Concerning about health and reading the information about health management


