Articles
- Page Path
- HOME > Korean J Community Nutr > Volume 17(6); 2012 > Article
-
Original Article
- Development and Effects' Analysis of Nutrition Education Pamphlet for the Higherr Grades Elementary Students: Focused on Individual Daily Needed Food Exchange Units
- Eun-Su Lim, Young-Sook Cho, Se-Na Kim, Sook-Bae Kim
-
Korean Journal of Community Nutrition 2012;17(6):689-706.
DOI: https://doi.org/10.5720/kjcn.2012.17.6.689
Published online: December 31, 2012
Graduate School of Education, Chonbuk National University, Jeonju, Korea.
1Department of Agrofood Resources, NAAS, RDA, Suwon, Korea.
2Department of Food Science & Human Nutrition, Research Institute of Human Ecology, Chonbuk National University, Jeonju, Korea.
- Corresponding author: Sook-Bae Kim, Chonbuk National University, 664-14, Duk-Jin Dong 1-Ga, Duk-Jin Gu, Jeonju 561-756, Korea. Tel: (063) 270-3823, Fax: (063) 270-3854, sbkim@jbnu.ac.kr
Copyright © 2012 The Korean Society of Community Nutrition
- 1,202 Views
- 0 Download
- 5 Crossref
Abstract
- The purpose of this study was to evaluate effects of a nutrition education focused on Food Exchange System for the higher grades elementary children. Nutrition education lessons (40 min/lesson, 4 times), '5 major nutrients and functions', '6 food groups', 'daily needed energy and food exchange units', 'good choice of snacks and balanced exercise' were provided to elementary students (5th grade students). This research was based on the data from two groups of elementary school children in the 'education' group (n = 31) and 'non-education' group (n = 31). We assessed the changes in dietary attitude, food habit and nutrition knowledge using questionnaire and nutrient intake using 24hr recall method by nutrition education using the developed pamphlet. After education, there was a significant difference in the dietary attitude score only in attitude of 'balanced meal' (p < 0.001) in the education group compared to the non-education group. In food habit, there were significant positive changes in the type of breakfast and in the priority of choosing snack in the educated group. In nutrition knowledge, there were significant increases in scores of 'function of carbohydrate' (p < 0.05), 'function of fat' (p < 0.01), 'function of vitamin' (p < 0.01), 'foods of carbohydrate' (p < 0.01), and 'foods of vitamin' (p < 0.01) in the educated group. After education,carbohydrate: protein: fat (CPF) ratio was significantly different between the two groups (education group, 59 : 16 : 26 vs. non-education group, 63 : 15 : 23). In evaluation of nutrient intake by Dietary Reference Intakes for Koreans (KDRIs), there were significant positive effects in energy (p < 0.05), thiamin (p < 0.05), riboflavin (p < 0.05), vitamin C (p < 0.05), phosphorus (p < 0.01), Fe (p < 0.01) and zinc (p < 0.01) in the education group compared to the non-education group. In conclusion, the developed 4 times' nutritional education pamphlet focused on individual daily energy requirements and food exchange units using food exchange system for higher grades' elementary student may positively change nutrition knowledge and dietary intakes.
-
*This study was carried out with the support of "Cooperative Research Program for Agricultural Science & Technology Development (PJ006488)", Rural Development Administration, Republic of Korea.
NOTES
- 1. Ahn Y, Ko SY, Kim KW. Evaluation of a nutrition education program for elementary school children. Korean J Community Nutr. 2009; 14(3): 266-276.
- 2. Busan National University of Education, Department of Practical Arts Education. Playing food tower with Toto. 2010; cited 2010 July 15. Available from http://www.foodtower.net/.
- 3. Changwon National University, Department of Food and Nutrition. Jjang & food friend. 2010; cited 2010 July 15. Available from http://www.food79.net/.
- 4. Cho YO, Kim BY. Evaluation of vitamin B6 status and RDA in young Koreans. Ann Nutr Metab. 2004; 48: 235-240.ArticlePubMedPDF
- 5. Cho Y, Kim Y. Dietary intake and major dietary sources of vitamin B-6 in Korean young women. Nutr Sci. 2001; 4: 20-25.
- 6. Choi SJ, Sohn HS, Cha YS, Kim SB. A study on middle school students' recognition of food and nutrition part in home economics. Korean J Community Nutr. 2004; 9(1): 12-18.
- 7. Choi MK, Lee YS, Lee YS, Bae YJ, Kim MH, Lee YS, Kim AJ, Sung CJ. Evaluation of nutritional health camp in obese elementary students. Korean J Food Nutr. 2007; 20: 79-87.
- 8. Chungbuk National University, Applied Nutrition Laboratory. I food. 2010; cited 2010 July 15. Available from http://ifood.or.kr/.
- 9. Cohen HW, Hailpern SM, Fang J, Alderman MH. Sodium intake and mortality in the NHANES follow-up study. Am J Med. 2006; 119: 275.e7-275.e14.PubMed
- 10. Cole K, Waldrop J, D'Auria J, Gamer H. An integrative research review: effective school-based childhood overweight interventions. J Spec Pediatr Nurs. 2006; 11(3): 166-177.ArticlePubMed
- 11. Eom HS, Jeong MJ, Kim SB. A study on nutrition knowledge, dietary attitude, food habit of middle school students in Chonbuk area. Korean J Community Nutr. 2005; 10(5): 574-581.
- 12. Han HM, Lee SS. A nutrition education program development and the application for the elementary students - Focused on sugar intake education -. J Korean Pract Arts Educ. 2008; 21(2): 111-131.
- 13. Hong SY. Basic statistics. 2004; Seoul: Hakjisa.
- 14. Hyon SM, Kim JW. Improvement of dietary attitudes of elementary students by nutrition labeling education. Korean J Community Nutr. 2007; 12(2): 168-177.
- 15. Kang SA, Lee JW, Kim KE, Koo JO, Park DY. A study of the frequency of food purchase for snacking and its related ecological factors on elementary school children. Korean J Community Nutr. 2004; 9(4): 453-463.
- 16. Kim GM, Lee SY. The study on nutritional knowledge and eating behavior of elementary school senior students in Incheon area. J Korean Diet Assoc. 2000; 6(2): 97-107.
- 17. Kim JY, Han YS, Bae HY, Ahn HS. Dietary intakes and serum lipid and iron indices in obese children. Korean J Community Nutr. 2006; 11(5): 575-586.
- 18. Kim KA, Lee YK. The effect of nutrition education using animations on the nutrition knowledge, eating habits and food preferences of elementary school students. Korean J Community Nutr. 2010; 15(1): 50-60.
- 19. Kim OH, Park HA, Cho YG, Kim KW, Hur YI, Song JH, Kang JH. Health status and nutrient intakes of 5th grade elementary students in Seoul and Gyeonggi province. Korean J Community Nutr. 2010; 15(6): 717-726.
- 20. Kim SB, Choi HJ. Effects of nutrition education using food exchange system: changes in elementary students' nutrition knowledge, dietary attitude and nutrients intake. Korean J Community Nutr. 2008; 13(6): 922-933.
- 21. Kim SH, Hyun TS. Evaluation of a nutrition education website for children. Korean J Community Nutr. 2006; 11(2): 218-228.
- 22. Koo JO, Lee JW, Choi YS, Kim JH, Lee JH. Nutrition throughout the life cycle. 2006; Seoul: Hyo-Il Publishing Co..
- 23. Korea Center for Disease Control and Prevention. Korean children and adolescent national growth chart. 2007; cited 2010 August 1. Available from http://www.cdc.go.kr/.
- 24. Korea Health Industry Development Institute. Korea National Health and Nutrition Examination Survey (KNHANES -3). 2009.
- 25. Ku PJ, Lee KA. A survey on dietary habit and nutritional knowledge for elementary school children's nutritional education. Korean J Diet Cult. 2000; 15(3): 201-213.
- 26. Kyeon YK, Jang YA, Kim JW. Application of a practical nutrition education program, KHIDI KIDS, for the improvement of dietary attitudes and habits of elementary students. Korean J Nutr. 2006; 39(8): 808-816.
- 27. Lee JY, Lee SY. A comparative study on nutrition knowledge, eating behavior and nutrient intake for students at elementary schools with and without nutrition education program. J East Asian Soc Diet Life. 2004; 14(6): 561-570.
- 28. Lee KA. Activity-based nutrition education for elementary school students. Korean J Food Nutr. 2003; 36(4): 405-417.
- 29. Lee YJ, Kim GM, Chang KJ. The analysis of effect on nutrition education of elementary school children, Inchon. J Korean Diet Assoc. 2000; 6(2): 86-96.
- 30. Lee YM, Lee MJ, Kim SY. Effects of nutrition education through discretional activities in elementary school -Focused on improving nutrition knowledge and dietary habits in 4th-, 5th- and 6th- grade students-. J Korean Diet Assoc. 2005; 11(3): 331-340.
- 31. Ministry for Health, Welfare and Family Affairs, Korea Centers for Disease Control and Prevention. Korea National Health and Nutrition Examination Survey (KNHANES-3). 2009.
- 32. Moon HK, Park Y, Park JH. Evaluation of a nutrition education program for 5th grade students provided by community health centers in the Seoul metropolitan area. J Korean Diet Assoc. 2008; 14(3): 259-275.
- 33. Park YS, Lee JW, Seo JS, Lee BK, Lee HS. Nutrition education and counseling. 2007; Seoul: Kyo-moon Publishing Co..
- 34. Rural Development Administration & The Korean Community Nutrition Society. Children's nutrition guide. 2009; Paju: Kyomunsa.
- 35. Shim JE, Paik HY, Moon HK. Breakfast consumption pattern, diet quality and health outcomes in adults from 2001 National Health and Nutrition Survey. Korean J Nutr. 2007; 40(5): 451-462.
- 36. Son MJ, Cho YS, Kim SN, Seo HJ, Kim SB. Development of effects' analysis of nutrition education pamphlet for the lower grades elementary students-Focused on individual daily needed food exchange units-. Korean J Community Nutr. 2011; 16(6): 647-660.Article
- 37. Son SM, Lee KH, Kim KY, Lee YK. Practices in nutrition education and counseling. 2009; Seoul: Life Science Publishing Co..
- 38. The Korean Dietetic Association. Dietitian(teacher)'s Guide. 2007.
- 39. The Korean Nutrition Society. Dietary reference intakes for Korean. 2010; Seoul: Han-Arum Publishing Co..
- 40. Trumbo P, Schlicker S, Yates AA, Poos M. Dietary reference intakes for energy, carbohydrate, fiber, fat, fatty acids, cholesterol, protein and amino acids. J Am Diet Assoc. 2002; 102(11): 1621-1630.ArticlePubMed
- 41. Wardlaw GM, Hampel JS, Dislivestro RA. Perspectives in nutrition. 2004; 6th ed. New York: McGraw Hill.
- 42. Whiting SJ, Vatanparast H, Baxter Jones A, Faulkner RA, Mirwald R, Bailey DA. Factors that affect bone mineral accrual in the adolescent growth spurt. J Nutr. 2004; 134: 696S-700S.ArticlePubMed
- 43. Yi MJ. Effects of nutrition education on dietary change of middle school girls in Jeonju -with educated group and non-educated group as the center-. 2007; Chonbuk National University; 3-12 MS thesis.
REFERENCES
Figure & Data
REFERENCES
Citations

- Effects of Nutrition Education Using Dietary Guidebook in Higher Grade Elementary Students of Jeonbuk Area
Mi-Ran Park, Sook-Bae Kim
Korean Journal of Community Nutrition.2018; 23(1): 13. CrossRef - Effects of Nutrition Education Providing School Lunch by Personalized Daily Needed Food Exchange Units for Adolescent Athletes in Jeonbuk Province
Kang-Mo Ko, Sook-Bae Kim
Korean Journal of Community Nutrition.2016; 21(1): 25. CrossRef - The Development of a Nutrition Education Program for Low-income Family Children by applying the Social Cognitive Theory and Health Belief Model
Saes-byoul Lee, Yu-Ri Jeong, Hyo-Jin Ahn, Min-Ji Ahn, Su-A Ryu, Nam-E Kang, Se-Young Oh
Korean Journal of Community Nutrition.2015; 20(3): 165. CrossRef - Analysis of Media Use in the Nutrition Education on Knowledge, Attitude and Practice of the Breakfast Habits on Elementary School Students
Nurlaely Fitriana, Siti Madanijah, Ikeu Ekayanti
Pakistan Journal of Nutrition.2015; 14(6): 335. CrossRef - Effects of Nutrition Education for Chinese College Students in Korea - Focused on Personalized Daily Energy Requirement and Food Exchange Units -
Jia-Li Guo, Soon-Kyung Kim, Jeong-Weon Kim, Mi-Hyun Kim, Se-Na Kim, Sook-Bae Kim
Korean Journal of Community Nutrition.2013; 18(6): 565. CrossRef
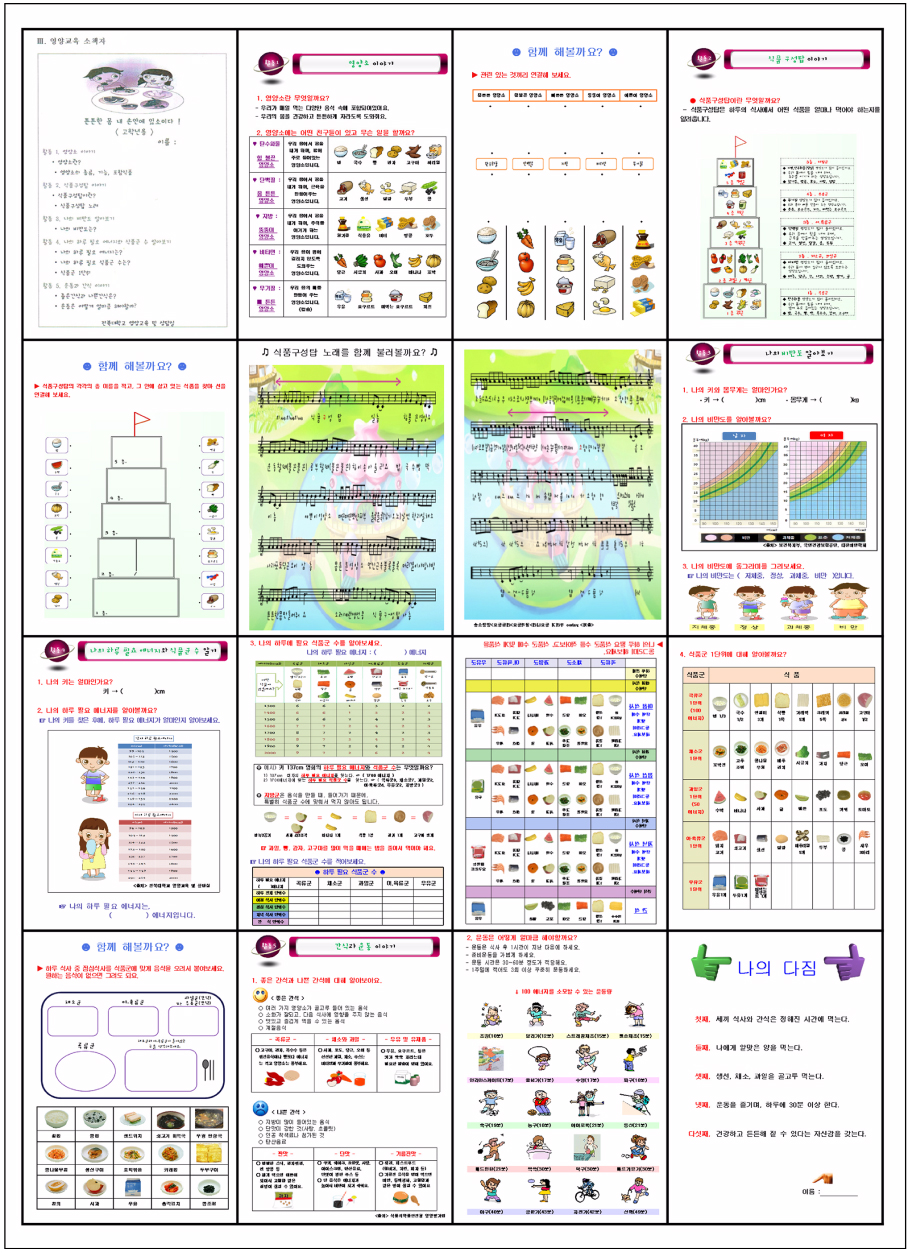
Fig. 1
The contents and tools of nutrition education
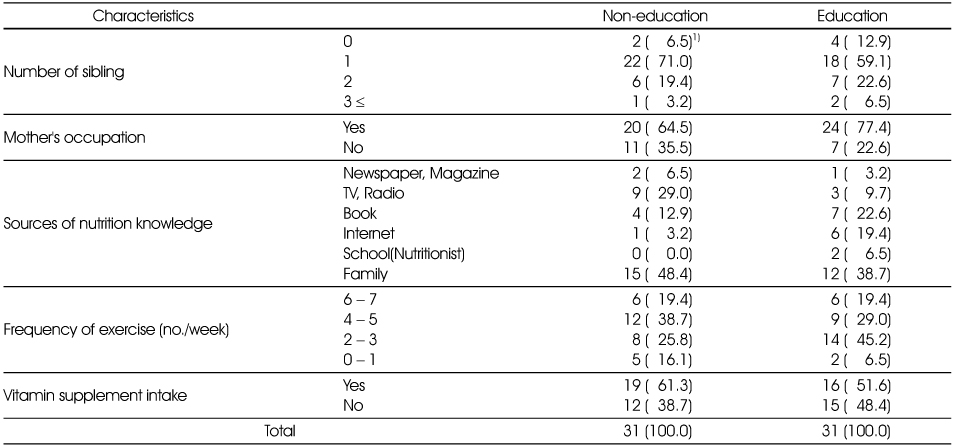
General characteristics of the subjects
1) N (%)
Height, weight, obesity index of subjects
1) Values are Mean ± SD
2) By ANCOVA test
Obesity index (%) =
< -10: underweight, -10 ≤ < 10: normal, 10 ≤ < 20: overweight, 20 ≤ obese
N (%)
*: p < 0.05 by t-test
NS: Not Significant
Dietary attitudes of the subjects
1) Values are Mean ± SD
2) By ANCOVA test
3) Denotes a negatively phrased and reversely scored item
**: p < 0.01, ***: p < 0.001 by t-test
NS: Not Significant
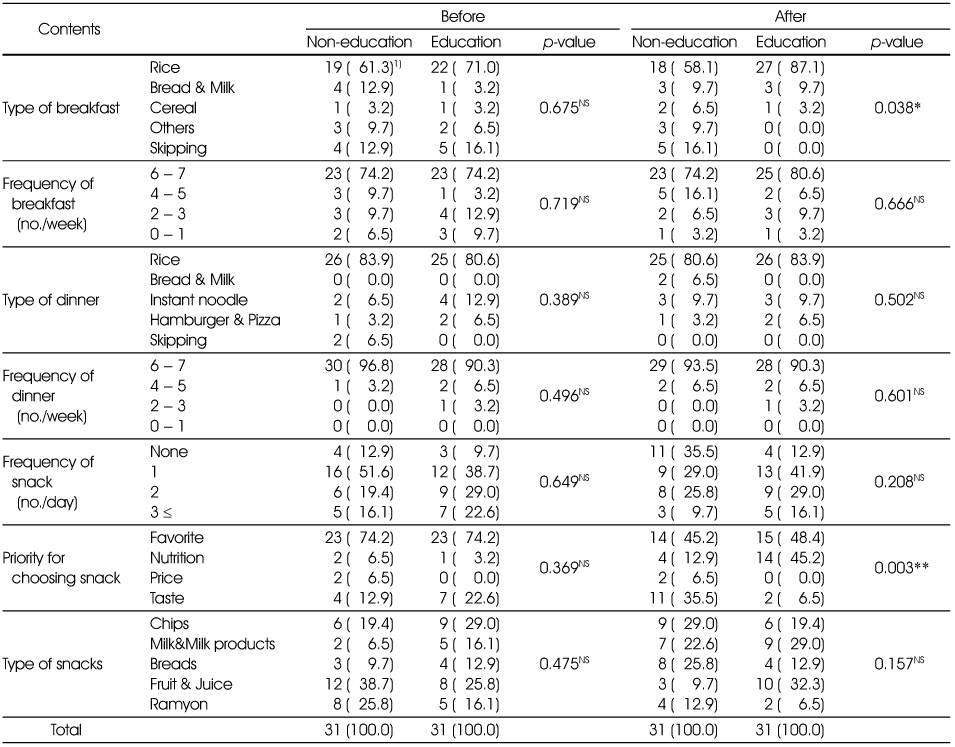
Food attitudes of the subjects
1) N (%)
*: p < 0.05, **: p < 0.01 by chi-square test
NS: Not Significant
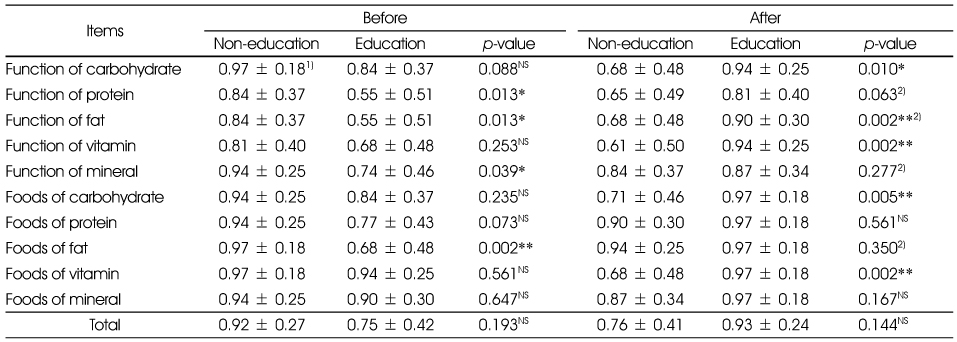
Nutrition knowledge of the subjects
1) Values are Mean ± SD
2) By ANCOVA test
*: p < 0.05, **: p < 0.01 by t-test
NS: Not Significant
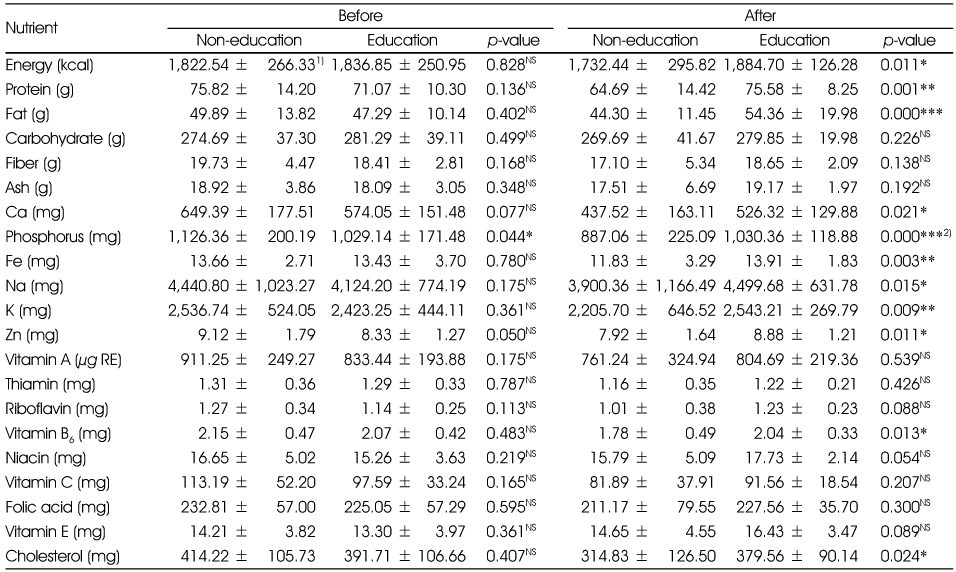
Nutrient intakes of subjects
1) Values are Mean ± SD
2) by ANCOVA test
*: p < 0.05, **: p < 0.01, ***: p < 0.001 by t-test
NS: Not Significant
Carbohydrate : Protein : Fat(CPF) ratio of subjects
1) Values are Mean ± SD
2) ***: p < 0.001 by ANCOVA test
**: p < 0.01, ***: p < 0.001 by t-test
CPF: Carbohydrate, Protein, Fat
NS: Not Significant
Macronutrient intakes of subjects
1) N (%)
2) EER: Estimated Energy Requirement
3) EAR: Estimated Average Requirement
4) RNI: Recommended Nutrient Intake
5) AI: Adequate Intake
*: p < 0.05 by Mann-Whitney U Test
NS: Not Significant
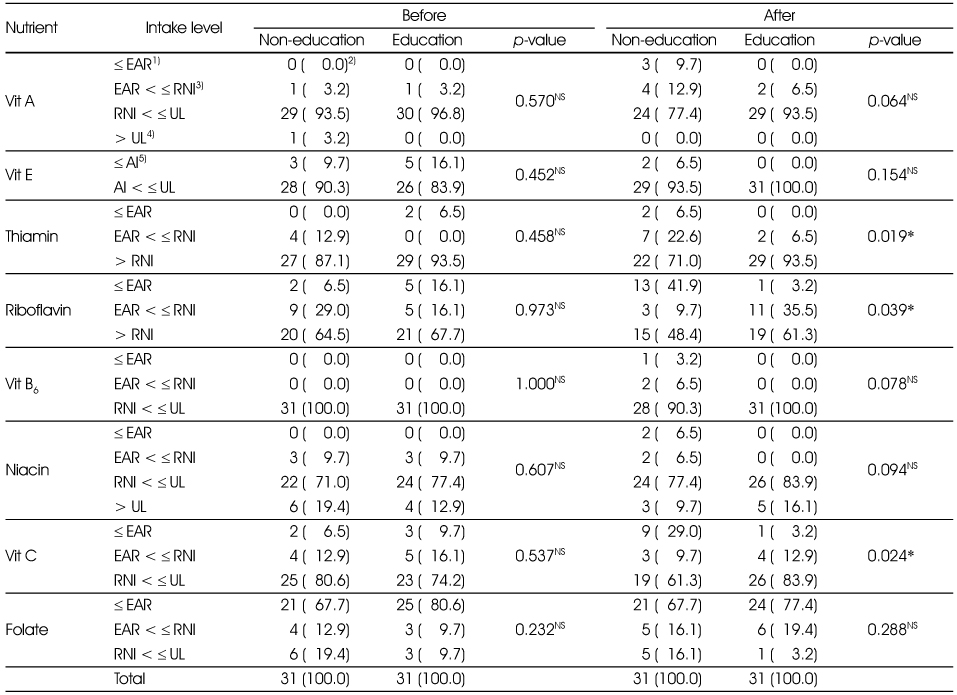
Vitamin intakes of subjects
1) EAR: Estimated Average Requirement
2) N (%)
3) RNI: Recommended Nutrient Intake
4) UL: Tolerable Upper Intake Level
5) AI: Adequate Intake
*: p < 0.05 by Mann-Whitney U Test
NS: Not Significant
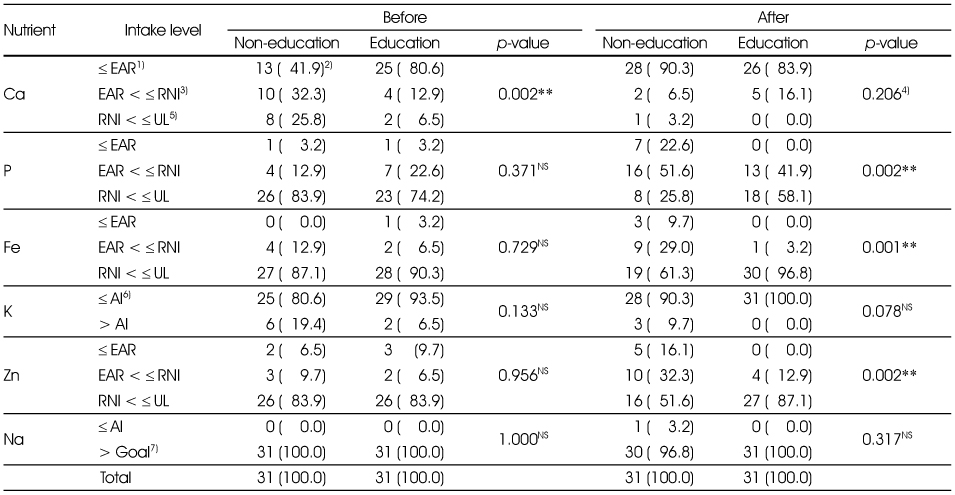
Mineral intakes of subjects
1) EAR: Estimated Average Requirement
2) N (%)
3) RNI: Recommended Nutrient Intake
4) By ANCOVA test
5) UL: Tolerable Upper Intake Level
6) AI: Adequate Intake
7) Goal: Population nutrient intake goal
**: p < 0.01 by Mann-Whitney U Test
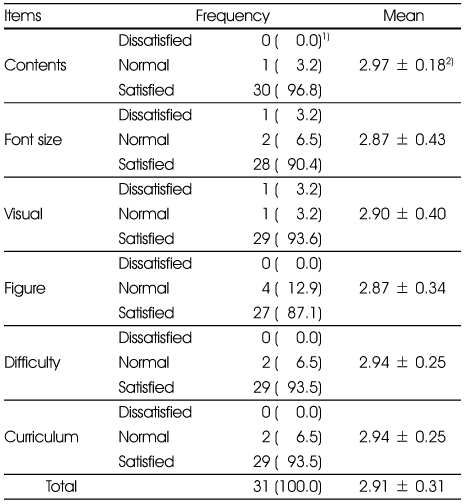
Satisfaction with nutrition education pamphlet of subjects
1) N (%)
2) Values are Mean ± SD
Score) Dissatisfied: 1, Normal: 2, Satisfied: 3
1) N (%)
1) Values are Mean ± SD 2) By ANCOVA test Obesity index (%) = < -10: underweight, -10 ≤ < 10: normal, 10 ≤ < 20: overweight, 20 ≤ obese N (%) *: NS: Not Significant
1) Values are Mean ± SD 2) By ANCOVA test 3) Denotes a negatively phrased and reversely scored item **: NS: Not Significant
1) N (%) *: NS: Not Significant
1) Values are Mean ± SD 2) By ANCOVA test *: NS: Not Significant
1) Values are Mean ± SD 2) by ANCOVA test *: NS: Not Significant
1) Values are Mean ± SD 2) ***: **: CPF: Carbohydrate, Protein, Fat NS: Not Significant
1) N (%) 2) EER: Estimated Energy Requirement 3) EAR: Estimated Average Requirement 4) RNI: Recommended Nutrient Intake 5) AI: Adequate Intake *: NS: Not Significant
1) EAR: Estimated Average Requirement 2) N (%) 3) RNI: Recommended Nutrient Intake 4) UL: Tolerable Upper Intake Level 5) AI: Adequate Intake *: NS: Not Significant
1) EAR: Estimated Average Requirement 2) N (%) 3) RNI: Recommended Nutrient Intake 4) By ANCOVA test 5) UL: Tolerable Upper Intake Level 6) AI: Adequate Intake 7) Goal: Population nutrient intake goal **:
1) N (%) 2) Values are Mean ± SD Score) Dissatisfied: 1, Normal: 2, Satisfied: 3

 KSCN
KSCN






 Cite
Cite


