
Articles
- Page Path
- HOME > Korean J Community Nutr > Volume 22(1); 2017 > Article
-
Research Article
- Comparison of Nutritional Status and Eating Behavior of Korean and Chinese Children using the Nutrition Quotient (NQ)
-
Hua Ling, Hokyung Ryu

-
Korean Journal of Community Nutrition 2017;22(1):22-39.
DOI: https://doi.org/10.5720/kjcn.2017.22.1.22
Published online: February 28, 2017
Department of Food Science and Nutrition, Pusan National University, Busan, Korea.
- Corresponding author: Hokyung Ryu. Department of Food Science and Nutrition, Pusan National University, 2, Busandaehak-ro 63beon-gil, Geumjeong-gu, Busan 46241, Korea. Tel: (051) 510-7397, Fax: (051) 583-3648, hokryu@pusan.ac.kr
• Received: February 2, 2017 • Revised: February 27, 2017 • Accepted: February 28, 2017
Copyright © 2017 The Korean Society of Community Nutrition
This is an Open-Access article distributed under the terms of the Creative Commons Attribution Non-Commercial License (http://creativecommons.org/licenses/by-nc/3.0/) which permits unrestricted non-commercial use, distribution, and reproduction in any medium, provided the original work is properly cited.
- 2,041 Views
- 9 Download
- 2 Crossref
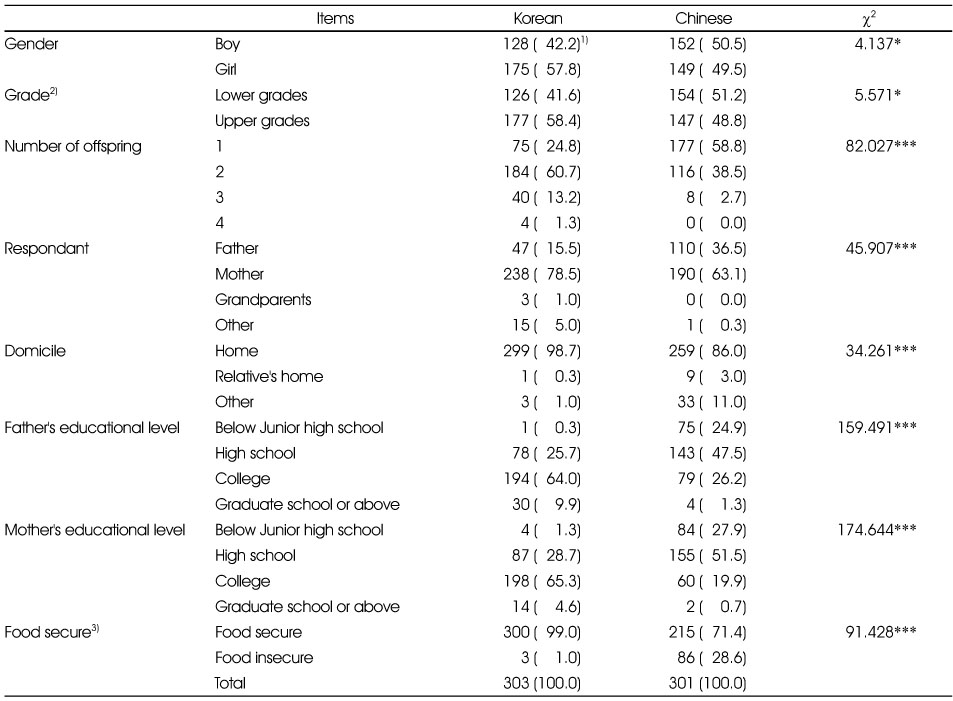
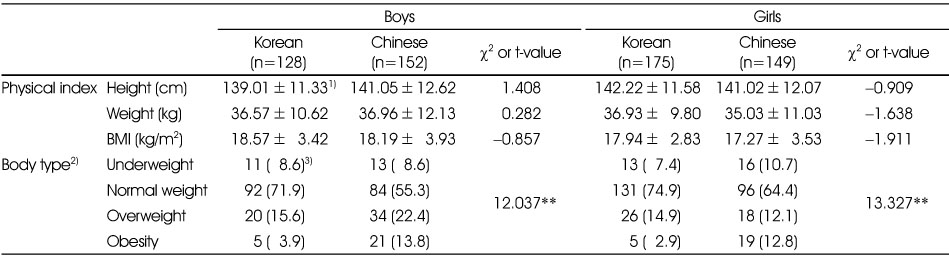
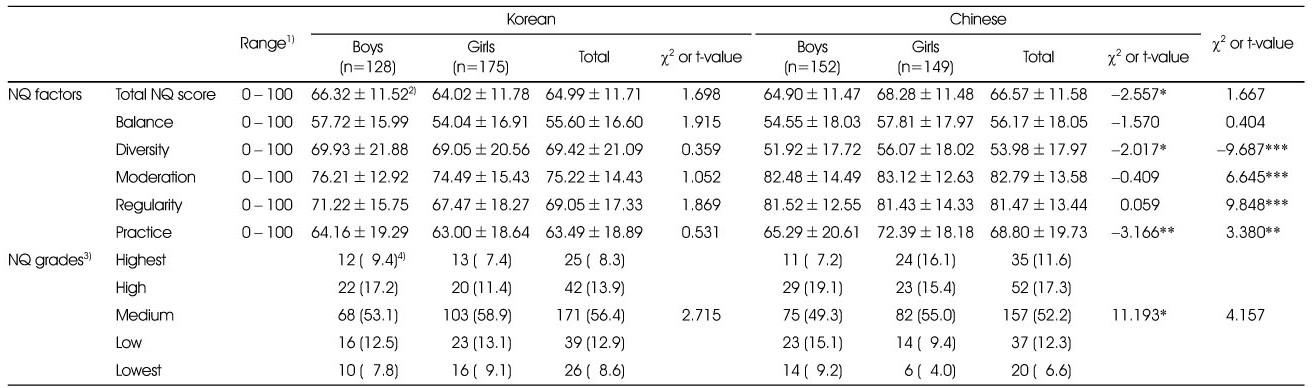
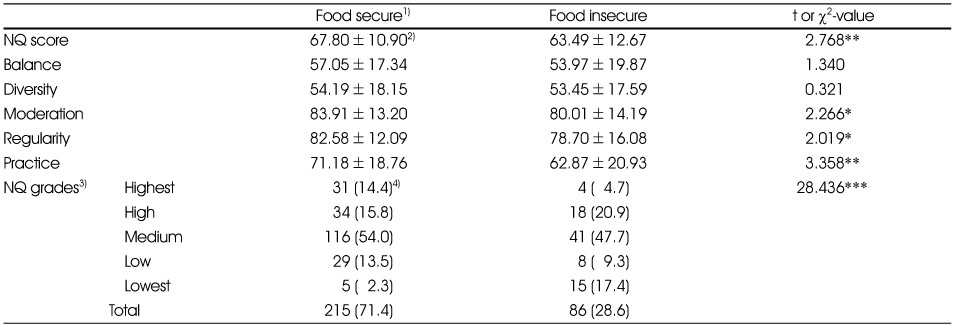
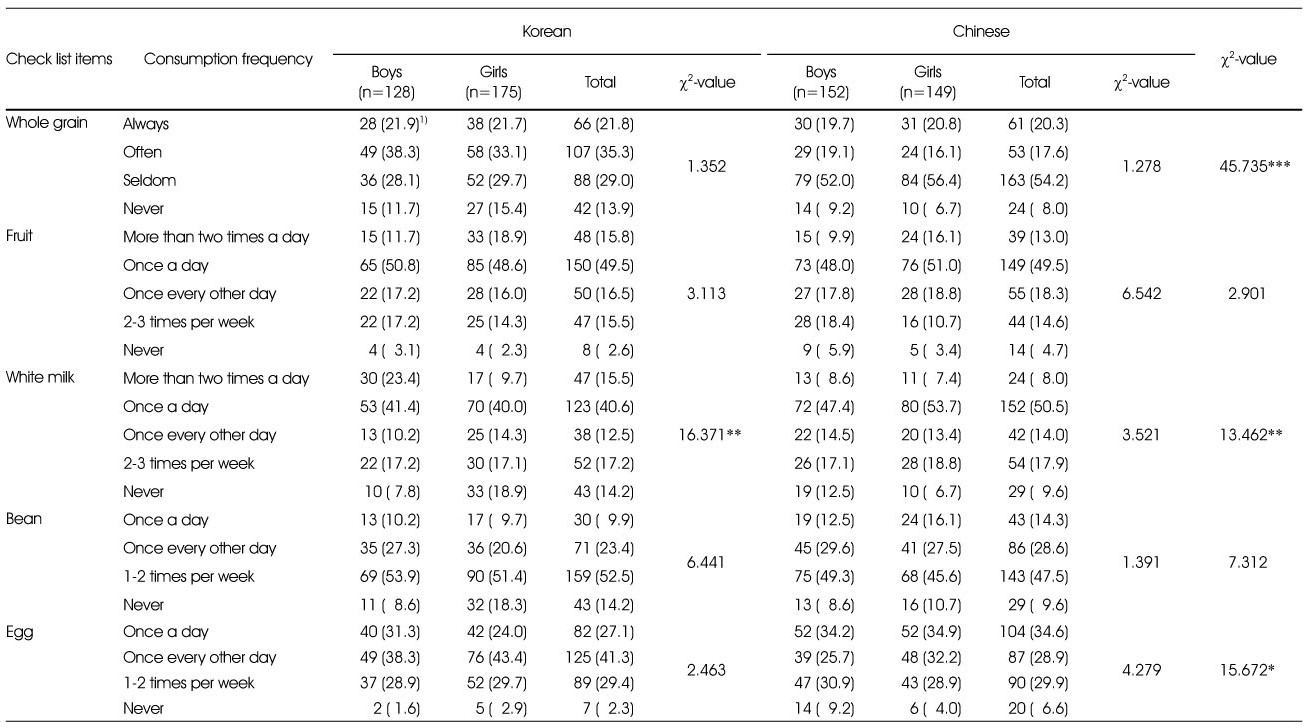
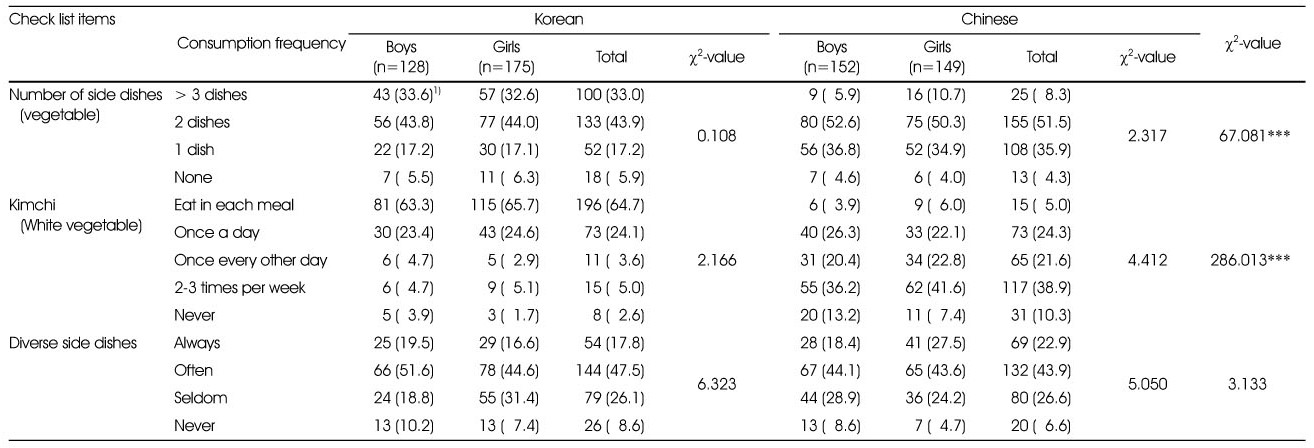
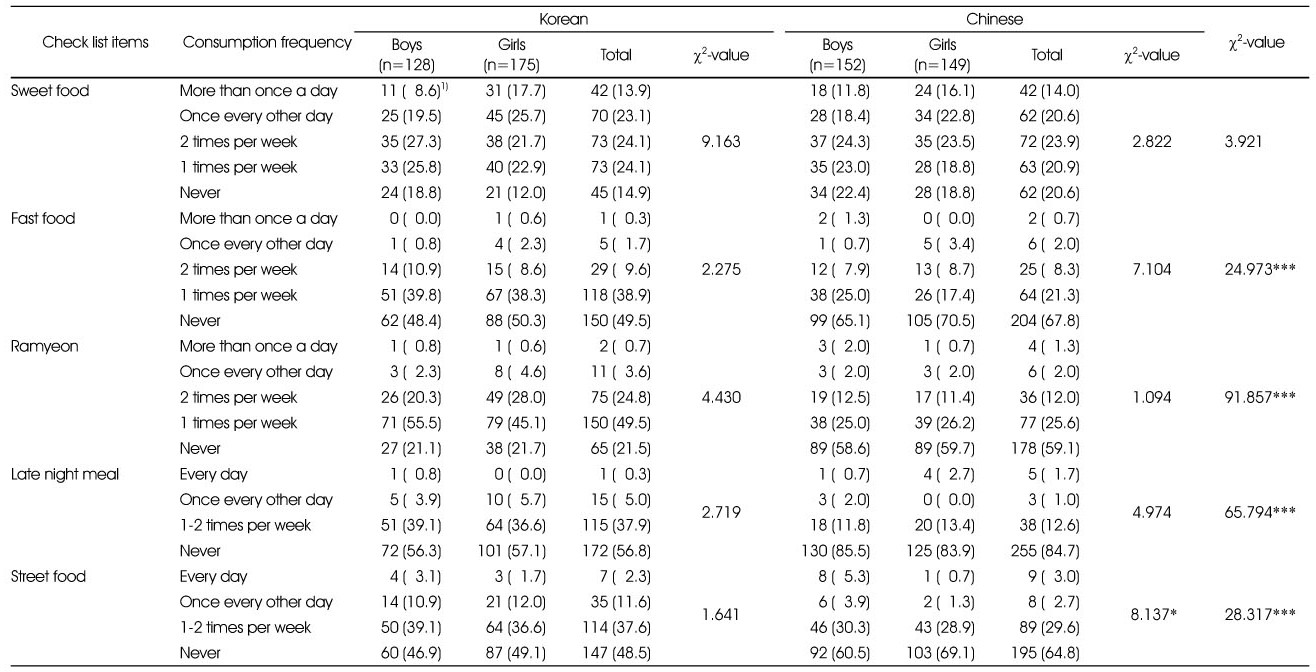
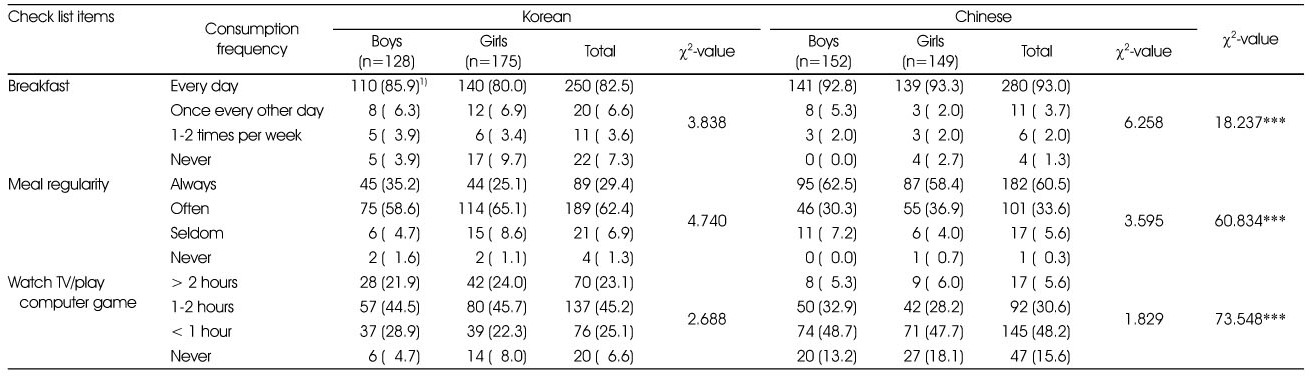
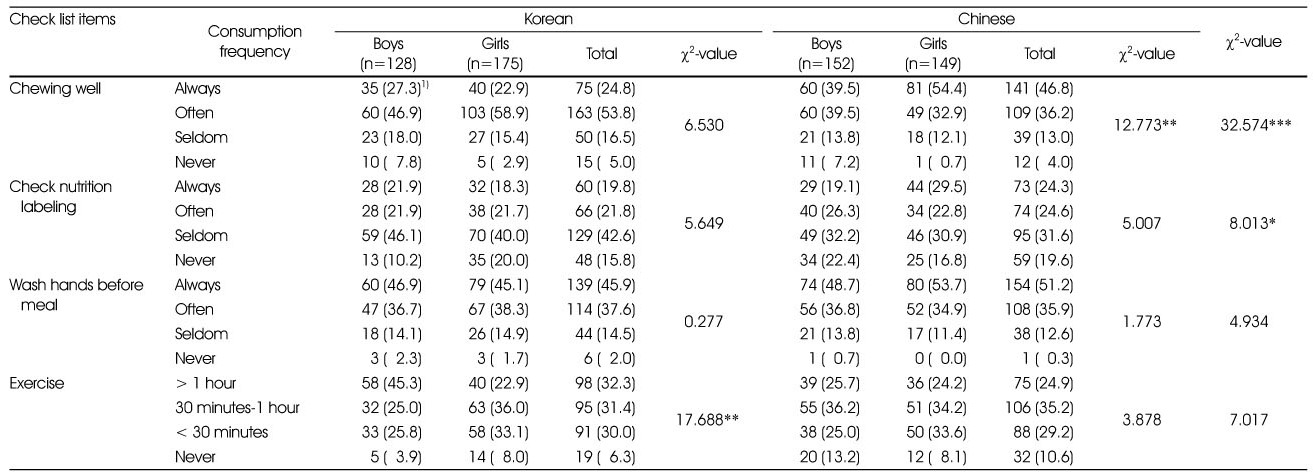
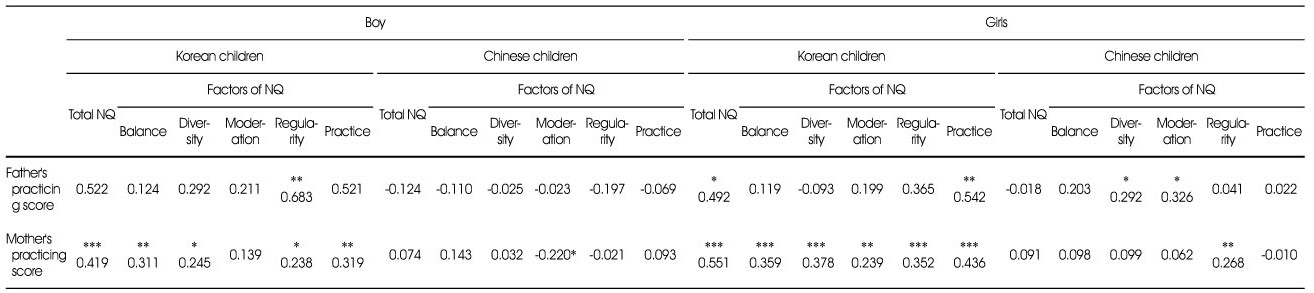
Figure & Data
REFERENCES
Citations
Citations to this article as recorded by 
- Assessment of the dietary quality among Chinese adults living in Shanghai and the Anhui Province using the Nutrition Quotient for adults
Ani Liu, Ji-Yun Hwang
Journal of Nutrition and Health.2025; 58(1): 117. CrossRef - Diet-Related Disparities and Childcare Food Environments for Vulnerable Children in South Korea: A Mixed-Methods Study
Jiyoung Park, Seolhyang Baek, Gahui Hwang, Chongwon Park, Sein Hwang
Nutrients.2023; 15(8): 1940. CrossRef
 Cite
CiteComparison of Nutritional Status and Eating Behavior of Korean and Chinese Children using the Nutrition Quotient (NQ)
Comparison of Nutritional Status and Eating Behavior of Korean and Chinese Children using the Nutrition Quotient (NQ)
Democratic characteristics of the children
1) N (%)
2) Lower grades (1 – 3): 6 – 9 years old, Upper grades (4 – 6): 10 – 12 years old
3) Without children: Food secure 0 – 2, Food insecure without hunger 3 – 5, Food insecure with hunger (moderate) 6 – 8, Food insecure with hunger (severe) 9 – 10. With children: Food secure 0 – 2, Food insecure without hunger 3 – 7, Food insecure with hunger (moderate) 8-12, Food insecure with hunger (severe) 13 – 18.
*: p < 0.05, ***: p < 0.001
Physical status of children
1) Values are Mean±SD.
2) Korean: Based on growth charts for Korean Children and adolescents (2007), Underweight: BMI percentile < 5, Normal weight: 5 ≤ BMI percentile < 85, Overweight: 85 ≤ BMI percentile < 95, Obesity: BMI percentile ≥ 95. Chinese: Underweight: Screening standard for malnutrition of school-age children and adolescents (WS/T 456-2014). Normal weight, Overweight, Obesity: Body mass index growth curves for Chinese children and adolescents aged 0 to 18 years (H Li,CY Ji, XN Zong, YQ Zhang 2009).
3) N (%)
**: p < 0.01
NQ score and NQ grades of children between Korean and Chinese
1) Factor score = sum of [checklist item score (0 – 100) × rounded item weight within a factor], NQ score = sum of [checklist item score (0 – 100) × item weight within NQ
2) Values are Mean±SD.
3) Highest (100~80.9), High (73.8~80.8), Medium (56.5~73.7), Low (47.6~56.4), Lowest (0~47.5)
4) N (%)
*: p < 0.05, **: p < 0.01, ***: p < 0.001
NQ score and NQ grades of Chinese children by food security
1) Without children: Food secure 0 – 2, Food insecure without hunger 3 – 5, Food insecure with hunger (moderate) 6 – 8, Food insecure with hunger (severe) 9 – 10. With children: Food secure 0 – 2, Food insecure without hunger 3 – 7, Food insecure with hunger (moderate) 8 – 12, Food insecure with hunger (severe) 13 – 18.
2) Values are Mean±SD.
3) Best (100~80.9), Excellence (73.8~80.8), Ordinary (56.5~73.7), Imperfectly (47.6~56.4), Bad (0~47.5)
4) N (%)
*: p < 0.05, **: p < 0.01, ***: p < 0.001
Comparison of checklist items for balance factor
1) N (%)
*: p < 0.05, **: p < 0.01, ***: p < 0.001
Comparison of checklist items for diversity factor
1) N (%)
***: p < 0.001
Comparison of checklist items for moderation factor
1) N (%)
*: p < 0.05, ***: p < 0.001
Comparison of checklist items for regularity factor
1) N (%), ***: p < 0.001
Comparison of checklist items for practice factor
1) N (%), *: p < 0.05, **: p < 0.01, ***: p < 0.001
Relationship of children's NQ score with parent's practicing score of Dietary Guidelines
Partial correlation coefficients
Adjusted for nationality, gender, grade, father's educational level, mather's educational level, food secure
*: p < 0.05, **: p < 0.01, ***: p < 0.001
Table 1
Democratic characteristics of the children
1) N (%) 2) Lower grades (1 – 3): 6 – 9 years old, Upper grades (4 – 6): 10 – 12 years old 3) Without children: Food secure 0 – 2, Food insecure without hunger 3 – 5, Food insecure with hunger (moderate) 6 – 8, Food insecure with hunger (severe) 9 – 10. With children: Food secure 0 – 2, Food insecure without hunger 3 – 7, Food insecure with hunger (moderate) 8-12, Food insecure with hunger (severe) 13 – 18. *: p < 0.05, ***: p < 0.001
Table 2
Physical status of children
1) Values are Mean±SD. 2) Korean: Based on growth charts for Korean Children and adolescents (2007), Underweight: BMI percentile < 5, Normal weight: 5 ≤ BMI percentile < 85, Overweight: 85 ≤ BMI percentile < 95, Obesity: BMI percentile ≥ 95. Chinese: Underweight: Screening standard for malnutrition of school-age children and adolescents (WS/T 456-2014). Normal weight, Overweight, Obesity: Body mass index growth curves for Chinese children and adolescents aged 0 to 18 years (H Li,CY Ji, XN Zong, YQ Zhang 2009). 3) N (%) **: p < 0.01
Table 3
NQ score and NQ grades of children between Korean and Chinese
1) Factor score = sum of [checklist item score (0 – 100) × rounded item weight within a factor], NQ score = sum of [checklist item score (0 – 100) × item weight within NQ 2) Values are Mean±SD. 3) Highest (100~80.9), High (73.8~80.8), Medium (56.5~73.7), Low (47.6~56.4), Lowest (0~47.5) 4) N (%) *: p < 0.05, **: p < 0.01, ***: p < 0.001
Table 4
NQ score and NQ grades of Chinese children by food security
1) Without children: Food secure 0 – 2, Food insecure without hunger 3 – 5, Food insecure with hunger (moderate) 6 – 8, Food insecure with hunger (severe) 9 – 10. With children: Food secure 0 – 2, Food insecure without hunger 3 – 7, Food insecure with hunger (moderate) 8 – 12, Food insecure with hunger (severe) 13 – 18. 2) Values are Mean±SD. 3) Best (100~80.9), Excellence (73.8~80.8), Ordinary (56.5~73.7), Imperfectly (47.6~56.4), Bad (0~47.5) 4) N (%) *: p < 0.05, **: p < 0.01, ***: p < 0.001
Table 5
Comparison of checklist items for balance factor
1) N (%) *: p < 0.05, **: p < 0.01, ***: p < 0.001
Table 6
Comparison of checklist items for diversity factor
1) N (%) ***: p < 0.001
Table 7
Comparison of checklist items for moderation factor
1) N (%) *: p < 0.05, ***: p < 0.001
Table 8
Comparison of checklist items for regularity factor
1) N (%), ***: p < 0.001
Table 9
Comparison of checklist items for practice factor
1) N (%), *: p < 0.05, **: p < 0.01, ***: p < 0.001
Table 10
Relationship of children's NQ score with parent's practicing score of Dietary Guidelines
Partial correlation coefficients Adjusted for nationality, gender, grade, father's educational level, mather's educational level, food secure *: p < 0.05, **: p < 0.01, ***: p < 0.001


