
Articles
- Page Path
- HOME > Korean J Community Nutr > Volume 16(5); 2011 > Article
-
Original Article
- Effects of Nutritional Education Practice Program for Cardiocerebrovascular High-risk Group at the Education Information Center
- Hang Me Nam, Seung Hee Woo, Young Ji Cho, Yun Jung Choi, Su Yeon Back, So Yeon Yoon, Jin Young Lee, Jung-Jeung Lee, Hye Jin Lee
-
Korean Journal of Community Nutrition 2011;16(5):580-591.
DOI: https://doi.org/10.5720/kjcn.2011.16.5.580
Published online: October 31, 2011
1KHyDDI (Korea Hypertension Diabetes Daegu Intiative) Project, Deagu, Korea.
2Division of Chronic Disease Control, Korea Centers for Disease Control & Prevention, Osong, Chungbuk, Korea.
3Department of Preventive Medicine & Public Health School of Medicine, Keimyung University, Daegu, Korea.
- Corresponding author: Hye Jin Lee, Korea Hypertension Diabetes Daegu Intiative Project 376-25 Samdeok-dong 3(sam)-ga, Jung-gu, Daegu 700-413, Korea. Tel: (053)428-0109, Fax: (053)422-9436, garden_1@hanmail.net
• Received: September 30, 2011 • Revised: October 12, 2011 • Accepted: October 12, 2011
Copyright © 2011 The Korean Society of Community Nutrition
- 1,723 Views
- 1 Download
- 6 Crossref
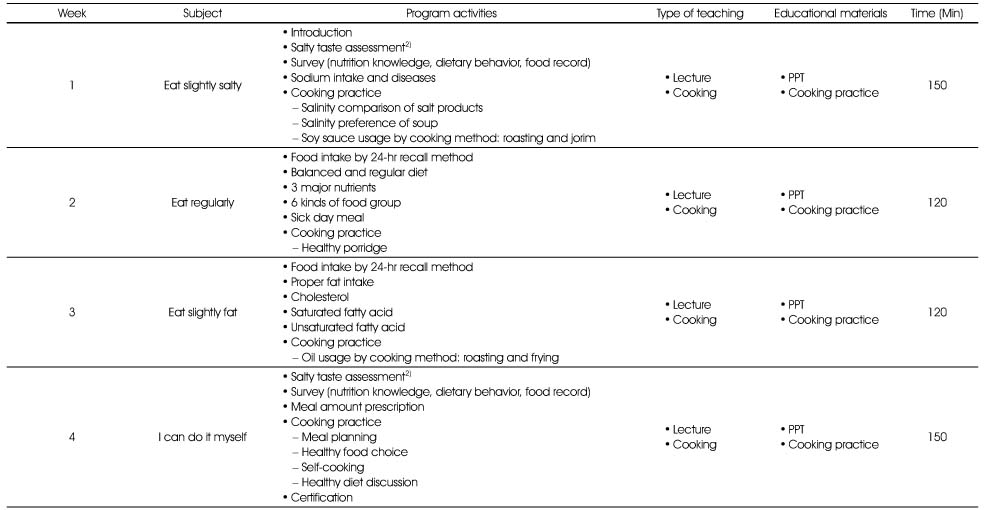


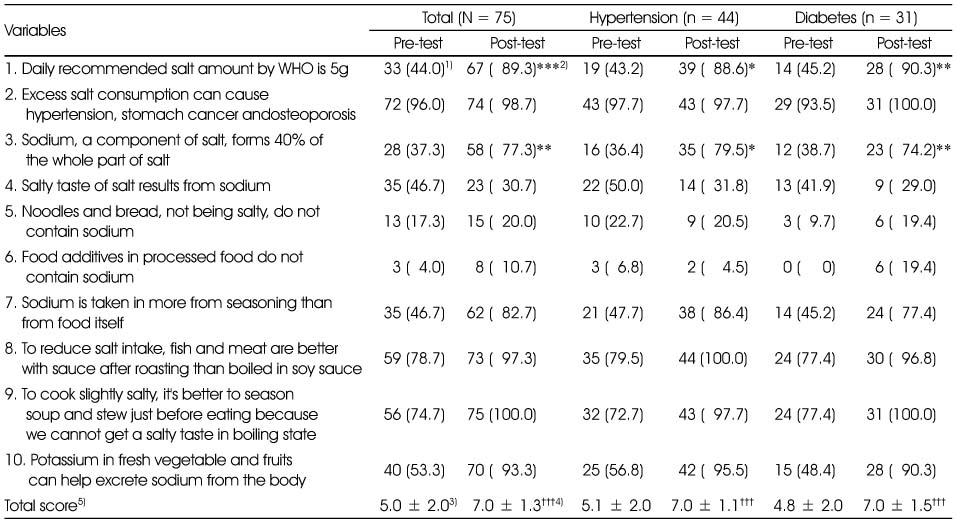
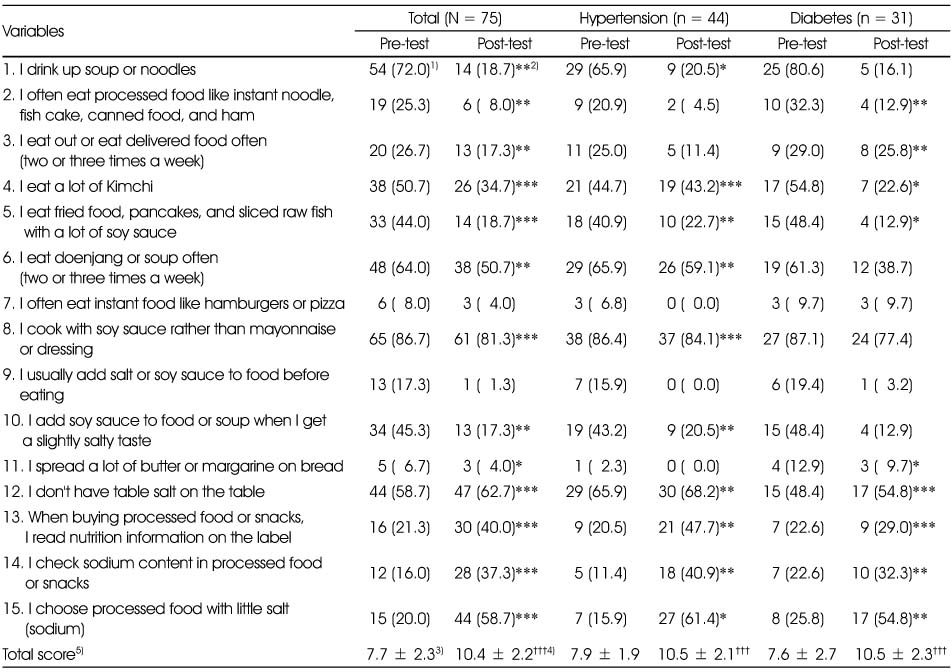


Figure & Data
REFERENCES
Citations
Citations to this article as recorded by 
- The impact of differential cost sharing of prescription drugs on the use of primary care clinics among patients with hypertension or diabetes
Eunja Park, Daeeun Kim, Sookja Choi
Public Health.2019; 173: 105. CrossRef - Effect of Staged Education Program for Hypertension, Diabetes Patients in a Community (Assessment of Quality of Life Using EQ-5D)
Jung Jeung Lee, Hye Jin Lee, Eun Jin Park
Journal of agricultural medicine and community health.2014; 39(1): 37. CrossRef - Comparison of the Health Behaviors according to Income and Education Level among Cardio-Cerebrovascular Patients; based on KNHANES data of 2010-2011
Ji-Yeon Choi, Seong-Woo Choi
Journal of the Korea Academia-Industrial cooperation Society.2014; 15(10): 6223. CrossRef - Effects of Nutrition Education and Personalized Lunch Service Program for Elderly at Senior Welfare Center in Jeonju
Jeong-Sook Bae, Mi-Hyun Kim, Sook-Bae Kim
Korean Journal of Community Nutrition.2013; 18(1): 65. CrossRef - Community-based Nutritional Management for Secondary Prevention of Diabetic Macrovascular Diseases
Hye Jin Lee, Jung Jeung Lee
The Journal of Korean Diabetes.2013; 14(1): 36. CrossRef - Development and Evaluation of a Community Staged Education Program for the Cardiocerebrovascular Disease High-risk Patients
Hye-Jin Lee, Jung-Jeung Lee, Tae-Yoon Hwang, Sin Kam
Journal of agricultural medicine and community health.2012; 37(3): 167. CrossRef
 Cite
CiteEffects of Nutritional Education Practice Program for Cardiocerebrovascular High-risk Group at the Education Information Center
Effects of Nutritional Education Practice Program for Cardiocerebrovascular High-risk Group at the Education Information Center
KHyDDI NEP Program1)
1) Korea Hypertension Diabetes Daegu Intiative Nutritional Education Practice Program
2) Salty taste material by Daegu Metropolitan City Salt Reduction Project (Patent No. 10-2007-0116957)
General characteristics of subjects
1) Values are Mean ± SD
2) N (%)
Comparison of anthropometric data and blood pressure
1) Values are Mean ± SD
2) **: p < 0.01, ***: p < 0.001 by paired t-test
3) Body Mass Index
4) Systolic blood pressure
5) Diastolic blood pressure
Comparison of salty taste assessment
1) N (%)
2) **: p < 0.01, ***: p < 0.001 by χ2-test
Comparison of nutrition knowledge
1) Correct answer's percentage
2) **: p < 0.01, ***: p < 0.001 by χ2-test
3) Values are Mean ± SD
4) †††: p < 0.001 by paired t-test
5) Higher score indicates having more nutrition knowledge, with a possible score of 0 - 10
Comparison of eating behavior
1) N (%)
2) **: p < 0.01, ***: p < 0.001 by c2-test
3) Values are Mean ± SD
4) †††: p < 0.001 by paired t-test
5) Summated score of each item. Scores on undesirable behaviors were reversed to calculate total score.
Higher score indicates more desirable eating behavior, with a possible score from 0 to 15
Comparison of nutrient intakes
1) Values are Mean ± SD
2) *:p < 0.05, **:p < 0.01, ***: p < 0.001 by paired t-test
Comparison of index of nutrition quality (INQ)
1) Values are Mean ± SD
2) *: p < 0.05, **: p < 0.01, ***:p < 0.001 by paired t-test
Table 1
KHyDDI NEP Program1)
1) Korea Hypertension Diabetes Daegu Intiative Nutritional Education Practice Program 2) Salty taste material by Daegu Metropolitan City Salt Reduction Project (Patent No. 10-2007-0116957)
Table 2
General characteristics of subjects
1) Values are Mean ± SD 2) N (%)
Table 3
Comparison of anthropometric data and blood pressure
1) Values are Mean ± SD 2) **: p < 0.01, ***: p < 0.001 by paired t-test 3) Body Mass Index 4) Systolic blood pressure 5) Diastolic blood pressure
Table 4
Comparison of salty taste assessment
1) N (%) 2) **: p < 0.01, ***: p < 0.001 by χ2-test
Table 5
Comparison of nutrition knowledge
1) Correct answer's percentage 2) **: p < 0.01, ***: p < 0.001 by χ2-test 3) Values are Mean ± SD 4) †††: p < 0.001 by paired t-test 5) Higher score indicates having more nutrition knowledge, with a possible score of 0 - 10
Table 6
Comparison of eating behavior
1) N (%) 2) **: p < 0.01, ***: p < 0.001 by c2-test 3) Values are Mean ± SD 4) †††: p < 0.001 by paired t-test 5) Summated score of each item. Scores on undesirable behaviors were reversed to calculate total score. Higher score indicates more desirable eating behavior, with a possible score from 0 to 15
Table 7
Comparison of nutrient intakes
1) Values are Mean ± SD 2) *:p < 0.05, **:p < 0.01, ***: p < 0.001 by paired t-test
Table 8
Comparison of index of nutrition quality (INQ)
1) Values are Mean ± SD 2) *: p < 0.05, **: p < 0.01, ***:p < 0.001 by paired t-test


