
Articles
- Page Path
- HOME > Korean J Community Nutr > Volume 21(5); 2016 > Article
-
Research Article
- Factors Affecting the Frequency of Skipping Meals of Prime-Aged Mothers with Children : Data from the Fifth Korea National Health and Nutrition Examination Survey, 2010-2011
-
Mi-Yeon Park, Pil-Sook Park

-
Korean Journal of Community Nutrition 2016;21(5):451-462.
DOI: https://doi.org/10.5720/kjcn.2016.21.5.451
Published online: October 31, 2016
1)Department of Food & Nutrition, Gyeongsang National University, Jinju, Korea.
2)Department of Food Science & Nutrition, Kyungpook National University, Daegu, Korea.
- Corresponding author: Pil-Sook Park. Department of Food Science & Nutrition, Kyungpook National University, 80, Daehakro, Bukgu, Daegu 41566, Korea. Tel: (053) 950-6236, Fax: (053) 950-6229, pspark@knu.ac.kr
• Received: August 31, 2016 • Revised: October 17, 2016 • Accepted: October 26, 2016
Copyright © 2016 The Korean Society of Community Nutrition
This is an Open-Access article distributed under the terms of the Creative Commons Attribution Non-Commercial License (http://creativecommons.org/licenses/by-nc/3.0/) which permits unrestricted non-commercial use, distribution, and reproduction in any medium, provided the original work is properly cited.
- 1,756 Views
- 1 Download
- 1 Crossref
Abstract
-
Objectives
- This study was designed with the goal of understanding the factors affecting the frequency of skipping meals of prime-aged mothers with children as well as their nutritional status.
-
Methods
- Utilizing data from the 2010-2011 Korea National Health and Nutrition Survey, the frequency of skipping meals of mothers aged between 30 to 49 years with children aged between 3 to 11 years during a two day period was statistically analyzed. The number of meals skipped calculated and categorized into skipping no meals, skipping one meal, skipping two meals or more.
-
Results
- Compared to subjects who corresponded to mean nutrient adequacy ratio(MAR) of 4 quartile, subjects who corresponded to MAR of 2 quartile had 2.766 (95% CI: 1.552-4.931) probability of being in the 1 meal skippers group, while the probability of being in the more than 2 meals skippers group was 2.743(95% CI: 1.353-5.564). Also, compared to subjects who corresponded to MAR of 4 quartile, subjects who corresponded to MAR of 1 quartile had 3.471 (95% CI: 1.871-6.442) probability of being in the 1 meal skippers group, while the odds ratio for being in the more than 2 meals skippers group was 5.258(95% CI: 2.642-10.466).
-
Conclusions
- The results have the advantage of being generalized because the study selected subjects from probability sampling of the female population of Korea. The research results showed that the elements influencing skipping meals of prime-aged mothers with children were mean nutrient adequacy ratio and the number of nutrients, under estimated average requirement intake, and others. Therefore, to encourage dietary behaviors in the right direction, an integrated approach that considers the associated factors must be realized. Future studies are needed to understand how the frequency of skipping meals of mothers affects their children.
- 1. Calle EE, Kaaks R. Overweight, obesity and cancer: epidemiological evidence and proposed mechanisms. Nat Rev Cancer 2004; 4(8): 579-591.ArticlePubMedPDF
- 2. Abdullah A, Peeters A, de Courten M, Stoelwinder J. The magnitude of association between overweight and obesity and the risk of diabetes: a meta-analysis of prospective cohort studies. Diabetes Res Clin Pract 2010; 89(3): 309-319.ArticlePubMed
- 3. Farshchi HR, Taylor MA, Macdonald IA. Regular meal frequency creates more appropriate insulin sensitivity and lipid profiles compared with irregular meal frequency in healthy lean women. Eur J Clin Nutr 2004; 58(7): 1071-1077.ArticlePubMedPDF
- 4. Smeets AJ, Westerterp-Plantenga MS. Acute effects on metabolism and appetite profile of one meal difference in the lower range of meal frequency. Br J Nutr 2008; 99(6): 1316-1321.ArticlePubMed
- 5. Levenstein S, Kaplan GA, Smith MW. Psychological predictors of peptic ulcer incidence in the Alameda County Study. J Clin Gastroenterol 1997; 24(3): 140-146.ArticlePubMed
- 6. Abu Farsakh NA. Risk factors for duodenal ulcer disease. Saudi Med J 2002; 23(2): 168-172.ArticlePubMed
- 7. Edwards FC, Coghill NF. Aetiological factors in chronic atrophic gastritis. Br Med J 1966; 10(2): 1409-1415.Article
- 8. Song WO, Chun OK, Obayashi S, Cho S, Chung CE. Is consumption of breakfast associated with body mass index in US adults? J Am Diet Assoc 2005; 105(9): 1373-1382.ArticlePubMed
- 9. BaHammam A, Alrajeh M, Albabtain M, Bahammam S, Sharif M. Circadian pattern of sleep, energy expenditure, and body temperature of young healthy men during the intermittent fasting of Ramadan. Appetite 2010; 54(2): 426-429.ArticlePubMed
- 10. Fulkerson JA, Story M, Mellin A, Leffert N, Neumark-Sztainer D, French SA. Family dinner meal frequency and adolescent development: relationships with developmental assets and high-risk behaviors. J Adolesc Health 2006; 39(3): 337-345.ArticlePubMed
- 11. Neumark-Sztainer D, Wall M, Story M, Fulkerson JA. Are family meal patterns associated with disordered eating behaviors among adolescents? J Adolesc Health 2004; 35(5): 350-359.ArticlePubMed
- 12. Hulshof KF, Brussaard JH, Kruizinga AG, Telman J, Löwik MR. Socio-economic status, dietary intake and 10 y trends: the Dutch National Food Consumption Survey. Eur J Clin Nutr 2003; 57(1): 128-137.ArticlePubMedPDF
- 13. Miech RA, Kumanyika SK, Stettler N, Link BG, Phelan JC, Chang VW. Trends in the association of poverty with overweight among US adolescents, 1971-2004. JAMA 2006; 295(20): 2385-2393.ArticlePubMed
- 14. Contento IR, Basch C, Zybert P. Body image, weight, and food choices of Latina women and their young children. J Nutr Educ Bhav 2003; 35(5): 236-248.Article
- 15. Wright DE, Radcliffe JD. Parent's perceptions of influences on food behavior development of children attending day care facilities. J Nutr Educ 1992; 24(4): 198-201.Article
- 16. Gibson EL, Wardle J, Watts CJ. Fruit and vegetable consumption, nutritional knowledge and beliefs in mothers and children. Appetite 1998; 31(2): 205-228.ArticlePubMed
- 17. Nam SM. The relationship between the eating habits of elementary school students and parenting behavior characteristics. J Korean Soc Food Cult 2003; 18(6): 515-526.
- 18. Lee KA. Effects of mothers' nutritional attitudes and knowledge on their children's obesity inducing factors. Korean J Nutr 2004; 37(6): 464-478.
- 19. Oh YJ, Chang YK. Children's unbalanced diet and parents' attitudes. Korean J Nutr 2006; 39(2): 184-191.
- 20. Park MY, Park PS. Factors related to eating habits and nutrition status of mother affecting on body mass index of children aged 1-5years: data from the fifth Korea national health and nutrition examination survey, 2010-2011. Korean J Community Nutr 2016; 21(1): 102-111.ArticleLink
- 21. Shin KO, Yoon JA, Lee JS, Chung KH. A comparative study of the dietary assessment and knowledge of (Full-Time) housewives and working (Job-Holding) housewives. J East Asian Soc Diet Life 2010; 20(1): 1-10.
- 22. Shin KO, Yoon JA, Lee JS, Chung KH, Choi SN. A comparison study on interest of dietary life behavior, nutrient intake and health between full-time and working housewives. J Korean Soc Food Cult 2010; 25(3): 285-295.
- 23. Kim SH. The relationship between stress from housewives' attitudes toward dietary life and their health. Korean J Food Cookery Sci 2006; 22(6): 783-791.
- 24. Wen CP, Cheng TYD, Tsai SP, Chan HT, Hsu HL, Hsu CC. Are Asians at greater mortality risks for being overweight than Caucasians? Redefining obesity for Asians. Public Health Nutr 2009; 12(4): 497-506.ArticlePubMed
- 25. The Korean Nutrition Society. Dietary reference intakes for Koreans. 1st revision. Seoul: The Korean Nutrition Society; 2015. p. vi-xii.
- 26. Hansen RG. An index of food quality. Nutr Rev 1973; 31(1): 1-7.ArticlePubMed
- 27. Yi YH, Kim YJ, Lee SY, Lee JG, Jeong DW, Cho YH. The correlation of meal frequency and nutrition with mental health status in women aged 20-39 years: the 5th Korea National Health and Nutrition Examination Survey, 2010-2012. Korean J Obes 2015; 24(2): 101-107.Article
- 28. Sayer LC, England P, Bittman M, Bianchi SM. How long is the second (plus first) shift? Gender differences in paid, unpaid, and total work time in Australia and the United States. J Comp Fam Stud 2009; 40(4): 523-545.Article
- 29. Kim TY, Han DB, Ahn JH, Lee SH. Effect of mothers' identification on nutrition labelling to children's obesity. Korean J Health Econ Policy 2013; 19(3): 51-82.
- 30. Choi JH, Chung YJ. Evaluation of diet quality according to nutrient intake between highly educated, married, unemployed and employed women. Korean J Nutr 2006; 39(2): 160-170.
- 31. Hua LL. The effect of mothers' body mass index on nutritional status and health behaviors of the infants [master's thesis]. Kyungpook National University; 2016.
- 32. Bell RR, Draper HH, Tzeng DY, Shin HK, Schmidt GR. Physiological responses of human adults to foods containing phosphate additives. J Nutr 1977; 107(1): 42-50.ArticlePubMed
- 33. Gaina A, Sekine M, Chandola T, Marmot M, Kagamimori S. Mother employment status and nutritional patterns in Japanese junior high schoolchildren. Int J Obes (Lond) 2009; 33(7): 753-757.ArticlePubMedPDF
REFERENCES
Fig. 1
1) DRI-2015: Dietary reference intakes for Koreans 2015
2) Calculated by Complex Samples General Linear Model ANOVA

Nutrient intakes as percentage of recommended nutrient intake(DRI-2015)1) and number of under nutrients based on frequency of skipping meals of prime-aged mothers2)
Table 1

Frequency of skipping meals based on anthropometric and demographic characteristics in prime-aged mothers

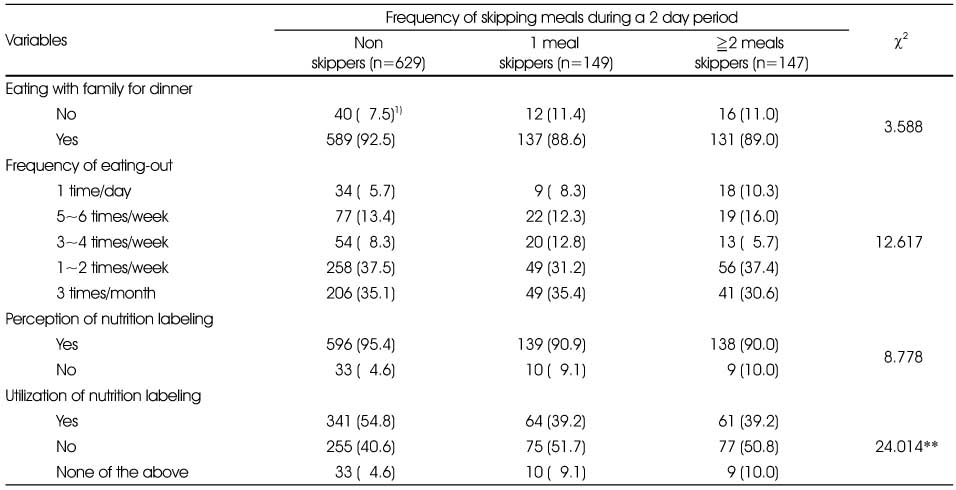
Table 4

Daily intake of energy and nutrients based on frequency of skipping meals of prime-aged mothers
Table 5

Nutrient adequacy ratio(NAR) and mean nutrient adequacy ratio (MAR) based on frequency of skipping meals of prime-aged mothers
Table 6

Index of nutritional quality (INQ) based on frequency of skipping meals of prime-aged mothers
Table 7

Health and dietary behaviors affecting the frequency of skipping meals of prime-aged mothers N=925

Figure & Data
REFERENCES
Citations
Citations to this article as recorded by 
- Dietary Intake and Nutritional Status of Children and Adolescent According to the Meal Frequency: The 7th (2016–2018) Korean National Health and Nutrition Examination Survey
Yonghoon Ji, Junhee Park, Jun-Hyun Yoo
Korean Journal of Family Practice.2022; 12(3): 158. CrossRef
 Cite
Cite- Figure
-
- We recommend
- Related articles
-
- Trends in growth and nutritional status of Korean toddlers and preschoolers: a cross-sectional study using 2010–2021 Korea National Health and Nutrition Examination Survey data
- Comparative study on the health and dietary habits of Korean male and female adults before and after the coronavirus disease 2019 pandemic: utilizing data from the 8th Korea National Health and Nutrition Examination Survey (2019–2021)
Factors Affecting the Frequency of Skipping Meals of Prime-Aged Mothers with Children : Data from the Fifth Korea National Health and Nutrition Examination Survey, 2010-2011

Fig. 1
Nutrient intakes as percentage of recommended nutrient intake(DRI-2015)1) and number of under nutrients based on frequency of skipping meals of prime-aged mothers2)
1) DRI-2015: Dietary reference intakes for Koreans 2015
2) Calculated by Complex Samples General Linear Model ANOVA
Fig. 1
Factors Affecting the Frequency of Skipping Meals of Prime-Aged Mothers with Children : Data from the Fifth Korea National Health and Nutrition Examination Survey, 2010-2011
Frequency of skipping meals based on anthropometric and demographic characteristics in prime-aged mothers
1) Mean±SE, Calculated by Complex Samples General Linear Model ANOVA
2) N (%), Calculated by Complex Samples χ2-test
Frequency of skipping meals based on health behaviors of prime-aged mothers
1) N (%), Calculated by Complex Samples χ2-test
*: p<0.05
Frequency of skipping meals based on dietary behaviors of prime-aged mothers
1) N (%), Calculated by Complex Samples χ2-test
**: p<0.01
Daily intake of energy and nutrients based on frequency of skipping meals of prime-aged mothers
1) Mean±SE, Calculated by Complex Samples General Linear Model ANOVA
2) AMDR (C:P:F): Acceptable Macronutrient Distribution Ranges (Carbohydrate: Protein: Fat)
***: p<0.001
Nutrient adequacy ratio(NAR) and mean nutrient adequacy ratio (MAR) based on frequency of skipping meals of prime-aged mothers
1) Mean±SE, Calculated by Complex Samples General Linear Model ANOVA
2) MAR (9): (energy, protein, calcium, iron, vitamin A, vitamin B1, vitamin B2, niacin, vitamin C) / 9
3) Number of under nutrients: Number of nutrients, under estimated average requirements intake
***: p<0.001
Index of nutritional quality (INQ) based on frequency of skipping meals of prime-aged mothers
1) Mean±SE, Calculated by Complex Samples General Linear Model ANOVA
*: p<0.05, **: p<0.01
Health and dietary behaviors affecting the frequency of skipping meals of prime-aged mothers N=925
1) Calculated by Complex Samples Logistic Regression Model
Mean nutrient adequacy ratio quartile and number of under nutrients affecting the frequency of skipping meals of prime-aged mothers N=925
1) Calculated by Complex Samples Logistic Regression Model
Values were adjusted by age
2) Number of under nutrients: Number of nutrients, under estimated average requirements intake
Table 1
Frequency of skipping meals based on anthropometric and demographic characteristics in prime-aged mothers
1) Mean±SE, Calculated by Complex Samples General Linear Model ANOVA 2) N (%), Calculated by Complex Samples χ2-test
Table 2
Frequency of skipping meals based on health behaviors of prime-aged mothers
1) N (%), Calculated by Complex Samples χ2-test *: p<0.05
Table 3
Frequency of skipping meals based on dietary behaviors of prime-aged mothers
1) N (%), Calculated by Complex Samples χ2-test **: p<0.01
Table 4
Daily intake of energy and nutrients based on frequency of skipping meals of prime-aged mothers
1) Mean±SE, Calculated by Complex Samples General Linear Model ANOVA 2) AMDR (C:P:F): Acceptable Macronutrient Distribution Ranges (Carbohydrate: Protein: Fat) ***: p<0.001
Table 5
Nutrient adequacy ratio(NAR) and mean nutrient adequacy ratio (MAR) based on frequency of skipping meals of prime-aged mothers
1) Mean±SE, Calculated by Complex Samples General Linear Model ANOVA 2) MAR (9): (energy, protein, calcium, iron, vitamin A, vitamin B1, vitamin B2, niacin, vitamin C) / 9 3) Number of under nutrients: Number of nutrients, under estimated average requirements intake ***: p<0.001
Table 6
Index of nutritional quality (INQ) based on frequency of skipping meals of prime-aged mothers
1) Mean±SE, Calculated by Complex Samples General Linear Model ANOVA *: p<0.05, **: p<0.01
Table 7
Health and dietary behaviors affecting the frequency of skipping meals of prime-aged mothers N=925
1) Calculated by Complex Samples Logistic Regression Model
Table 8
Mean nutrient adequacy ratio quartile and number of under nutrients affecting the frequency of skipping meals of prime-aged mothers N=925
1) Calculated by Complex Samples Logistic Regression Model Values were adjusted by age 2) Number of under nutrients: Number of nutrients, under estimated average requirements intake


