Articles
- Page Path
- HOME > Korean J Community Nutr > Volume 25(4); 2020 > Article
- Research Article
- Evaluation of Nutritional Content in Convenience Store Lunchboxes by Meal Type, Price, and Store Brand
- Jin-Seon Park, Young-Hee Han, Taisun Hyun
-
Korean Journal of Community Nutrition 2020;25(4):280-290.
DOI: https://doi.org/10.5720/kjcn.2020.25.4.280
Published online: August 31, 2020

2Invited professor, Department of Food and Nutrition, Chungbuk National University, Cheongju, Korea

3Professor, Department of Food and Nutrition, Chungbuk National University, Cheongju, Korea

-
Corresponding author:
Taisun Hyun,
Email: taisun@cbnu.ac.kr
- 1,168 Views
- 12 Download
- 3 Crossref
- 0 Scopus
Abstract
Objective
This study investigated the menu and nutritional contents of convenience store lunchboxes, and evaluated the nutritional content by meal type, price, and store brand.
Methods
In September 2019, 93 convenience store lunchboxes from the top five franchise stores were purchased. Relevant information on price, food weight, food ingredients, cooking methods, and nutrition labeling were subsequently collected.
Nutritional content was evaluated based on the daily value (DV) and Index of Nutritional Quality (INQ), and energy contribution of carbohydrate, protein, fat, saturated fat and sugar was compared with the recommended range.
Results
Most lunchboxes included the food groups; grains/starches, meats/fish/eggs/ legumes, and vegetables. However, none provided fruits, and only a few lunchboxes provided milk/milk products. Stir-frying, deep-frying, and pan-frying were the most frequent methods of cooking. The average energy content of the lunchboxes was 736.6 kcal, whereas the average contents of protein, fat and saturated fat were higher than 40% of the DV, and sodium content was 66.8% of the DV. The contents of most nutrients in traditional type lunchboxes were higher, as compared to nutrients in onedish type lunchboxes. Considering pricing of lunchboxes, protein and sodium contents were higher in the higher-priced lunchboxes as compared to lower-priced lunchboxes, but there were no differences in the INQs. The contents of energy, protein, fat, saturated fat, and cholesterol significantly differed by brand.
Conclusions
Our results indicate that convenience store lunchboxes contain high levels of protein, fat, saturated fat, and sodium. The nutritional contents differed by meal type, price, and store brand, and higher price did not imply higher nutritional quality. We propose the need to educate consumers to check nutrition labels and purchase appropriate lunchboxes. Manufacturers also need to make efforts to reduce the amounts of fat, saturated fat, and sodium, and not provide protein in excess.
Published online Aug 31, 2020.
https://doi.org/10.5720/kjcn.2020.25.4.280
Evaluation of Nutritional Content in Convenience Store Lunchboxes by Meal Type, Price, and Store Brand
Abstract
Objectives
This study investigated the menu and nutritional contents of convenience store lunchboxes, and evaluated the nutritional content by meal type, price, and store brand.
Methods
In September 2019, 93 convenience store lunchboxes from the top five franchise stores were purchased. Relevant information on price, food weight, food ingredients, cooking methods, and nutrition labeling were subsequently collected. Nutritional content was evaluated based on the daily value (DV) and Index of Nutritional Quality (INQ), and energy contribution of carbohydrate, protein, fat, saturated fat and sugar was compared with the recommended range.
Results
Most lunchboxes included the food groups; grains/starches, meats/fish/eggs/legumes, and vegetables. However, none provided fruits, and only a few lunchboxes provided milk/milk products. Stir-frying, deep-frying, and pan-frying were the most frequent methods of cooking. The average energy content of the lunchboxes was 736.6 kcal, whereas the average contents of protein, fat and saturated fat were higher than 40% of the DV, and sodium content was 66.8% of the DV. The contents of most nutrients in traditional type lunchboxes were higher, as compared to nutrients in onedish type lunchboxes. Considering pricing of lunchboxes, protein and sodium contents were higher in the higher-priced lunchboxes as compared to lower-priced lunchboxes, but there were no differences in the INQs. The contents of energy, protein, fat, saturated fat, and cholesterol significantly differed by brand.
Conclusions
Our results indicate that convenience store lunchboxes contain high levels of protein, fat, saturated fat, and sodium. The nutritional contents differed by meal type, price, and store brand, and higher price did not imply higher nutritional quality. We propose the need to educate consumers to check nutrition labels and purchase appropriate lunchboxes. Manufacturers also need to make efforts to reduce the amounts of fat, saturated fat, and sodium, and not provide protein in excess.
Fig. 1
Percentage of the daily value (%DV) and Index of Nutritional Quality (INQ) for each nutritional component in the lunchboxes by meal type
*P < 0.05, **P < 0.01, ***P < 0.001 by t-test
Fig. 3
Index of Nutritional Quality (INQ) of each nutritional component in the traditional type lunchboxes by price and by brand *P < 0.05, **P < 0.01 by Kruskal-Wallis H test
1) Q1: ≤₩4,200, Q2: ₩4,300~4,600, Q3: ≥₩4,700
Fig. 4
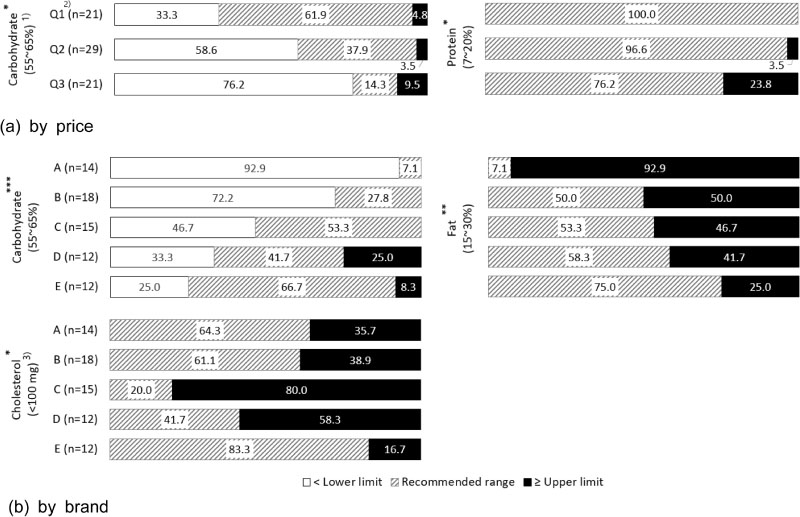
1) Recommended range [17], 2) Q1: ≤₩4,200, Q2: ₩4,300~4,600, Q3: ≥₩4,700, 3) ⅓ of the goal intake (< 300 mg/day)
Distribution of the lunchboxes according to the recommendations of the Dietary Recommended Intakes for Koreans by price and by brand
*P < 0.05, **P < 0.01, ***P < 0.001 by Fisher's exact test
Table 1
The meal type of convenience store lunchboxes
Table 2
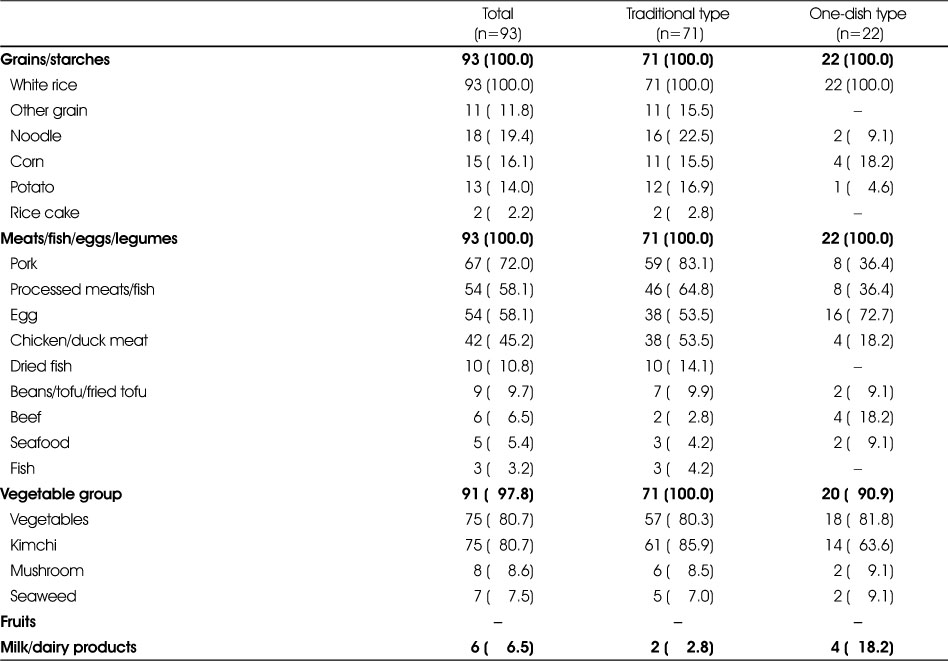
The number of lunchboxes providing each food group or each food item
Table 3
The number of lunchboxes where each cooking method was used for dishes except white rice and kimchi
Table 4
Average price, food weight, and nutritional content of the lunchbox by meal type
Table 5
Average price, food weight, and nutritional content of the traditional type lunchbox by price and brand
References
-
Kang JM. The history of Korean lunchbox: From ‘the lunchbox of Lee Wan-yong’ to ‘the lunchbox of Lee Myung-bak’. Inmulgwasasang 2008;9:173–207.
-
-
Park HW, Koh HY, Park NH, Kang TS, Mo SM. Optimization of the Korean packaged meal (Dosirak) production facilities for food service delivered long distance. Korean J Dietary Culture 1988;3(1):89–93.
-
-
Ministry of Food and Drug Safety. Enforcement Decree of the Food Sanitation Act (Presidential Decree No. 12000, 1986 November 11, whole amendment) [Internet]. Ministry of Food and Drug Safety; 1986 [cited 2020 Jul 28].Available from: http://www.law.go.kr/LSW/lsInfoP.do?lsiSeq=21646&ancYd=19861111&ancNo=12000&efYd=19861111&nwJoYnInfo=N&efGubun=Y&chrClsCd=010202&ancYnChk=0#0000.
-
-
Ministry of Agriculture, Food and Rural Affairs, Korea Agro-Fisheries & Food Trade Corporation. Status of processed food market segment: lunchbox market [Internet]. Korea Agro-Fisheries and Food Trade Corporation; 2016 [cited 2020 Jul 3].Available from: http://www.atfis.or.kr/article/M001050000/view.do?articleId=2458&page=&searchKey=&searchString=&searchCategory.
-
-
Juhn SI. In: Convenience store sociology. Seoul: Minumsa; 2014. pp. 42.
-
-
Kim BR. Lunchbox fights for 1 trillion won: A big match of convenience store vs Hansot·Bon [Internet]. Korea Economic Daily; 2019 [cited 2020 Jul 29].Available from: https://www.hankyung.com/economy/article/2019110307681.
-
-
Embrain Trend Monitor. A survey of use and recognition of (convenience store) lunchbox [Internet]. Macromillembrain; 2016 [cited 2020 Jul 29].Available from: https://www.trendmonitor.co.kr/tmweb/trend/allTrend/detail.do?bIdx=1460&code=0301&trendType=CKOREA.
-
-
Hong MS, Kang HS, Myeong SH, Yoon DI. The effect of customer's selection attributes of convenience store box lunch on positive consumption emotion and customer loyalty. Food Serv Ind J 2017;13(2):29–44.
-
-
Jin YH, Kim SO. A study on the selection attributes of convenience store PB lunch box using IPA. Culin Sci Hosp Res 2017;23(8):17–26.
-
-
Kim JH, Kim YS, Jeon YJ. The effects of the convenience store lunch-box selection attributes on satisfaction and behavioral intentions. J Tour Leis Res 2017;29(7):353–370.
-
-
Choi J, Park H, Song K, Kwon S, Lee Y. Menu evaluation of meal boxes sold in Korean convenience stores. J Food Nutr Res 2018;6(1):18–25.
-
-
Kim SY, Choi JY. The changing role of convenience stores in South Korea. Br Food J 2019;121(7):1642–1654.
-
-
Ministry of Food and Drug Safety. Lunchbox: get conveniently and enjoy healthy eating. Results of a survey on sodium in commercially available lunchbox [Internet]. Ministry of Food and Drug Safety; 2019 [cited 2020 Feb 29].
-
-
Ministry of Food and Drug Safety. Enforcement rules of the act on labeling or advertising of foods (Prime Minister's Order No. 1535, Enacted on 2019 April 25) [Internet]. Ministry of Food and Drug Safety; 2019 [cited 2020 Feb 27].Available from: http://www.law.go.kr/lsInfoP.do?lsiSeq=208516#0000.
-
-
Ministry of Health & Welfare, The Korean Nutrition Society. Dietary reference intakes for Koreans 2015. Sejong: Ministry of Health & Welfare; 2015.
-
-
Korea Fair Trade Commission. Franchise business transaction. Comparison between brands [Internet]. Korea Fair Trade Commission; 2019 [cited 2020 Jul 13].
-
-
Ministry of Food and Drug Safety. Labeling standards of foods, etc. (Notification No. 2020-1, 2020 January 3) [Internet]. Ministry of Food and Drug Safety; 2020 [cited 2020 Feb 27].Available from: https://www.mfds.go.kr/brd/m_
211/view.do?seq=14420.
-
-
Christoforou AK, Dunford EK, Neal BC. Changes in the sodium content of Australian ready meals between 2008 and 2011. Asia Pac J Clin Nutr 2013;22(1):138–143.
-
-
Action on Salt. Ready meals survey [Internet]. Action on Salt; 2007 [cited 2020 Feb 26].Available from: http://www.actiononsalt.org.uk/news/surveys/2007/ready/.
-
-
Kwon KL, Park SH, Lee JH, Kim JY, Yoo KS, Lee JS. Prevalence of nutrition labeling and claims on processed, and packaged foods. Korean J Community Nutr 2007;12(2):206–213.
-
-
Ministry of Food and Drug Safety, National Institute of Food and Drug Safety Evaluation. Risk assessment of trans fat [Internet]. National Institute of Food and Drug Safety Evaluation; 2016 [cited 2020 Feb 27].Available from: http://www.nifds.go.kr/brd/m_
271/view.do?seq=10116.
-
-
Ministry of Food and Drug Safety. Check nutrition label of home meal replacements before you choose [Internet]. Ministry of Food and Drug Safety; 2020 [cited 2020 Feb 27].Available from: https://www.mfds.go.kr/brd/m_
99/view.do?seq=43964.
-
-
Korea Consumer Agency. Results of sandwich quality test [Internet]. Korea Consumer Agency; 2019 [cited 2020 Feb 27].
-

 KSCN
KSCN


 Cite
Cite


