Articles
- Page Path
- HOME > Korean J Community Nutr > Volume 20(3); 2015 > Article
-
Research Article
- A Comparison of Dietary Habits, Weight Control Behaviors, Eating Disorder Risk, and Depression of Middle School Girls according to Various Stages of Dieting
- Aekyung Jung, Hyunsuk Ryu, Kyunghee Song, Hongmie Lee
-
Korean Journal of Community Nutrition 2015;20(3):178-187.
DOI: https://doi.org/10.5720/kjcn.2015.20.3.178
Published online: June 30, 2015
1Graduate School of Nutrition Education, Daejin University, Pocheon, Korea.
2Department of Nursing, Daejin University, Pocheon, Korea.
3Department of Food and Nutrition, Myongji University, Yongin, Korea.
4Department of Food Science & Nutrition, Daejin University, Pochoeon, Korea.
- Corresponding author: Hongmie Lee. Department of Food Science & Nutrition, Daejin University, 11-1 Sundan-dong, Pocheon-si, Gyeonggi 487-711, Korea. Tel: (031) 539-1862, Fax: (031) 539-1860, hmlee@daejin.ac.kr
Copyright © 2015 The Korean Society of Community Nutrition
This is an Open-Access article distributed under the terms of the Creative Commons Attribution Non-Commercial License (http://creativecommons.org/licenses/by-nc/3.0/) which permits unrestricted non-commercial use, distribution, and reproduction in any medium, provided the original work is properly cited.
- 1,069 Views
- 3 Download
- 4 Crossref
Figure & Data
REFERENCES
Citations

- Relationship between consumer behavior, perception of nutritional
information, and menu factors on fast food using eye-tracking: A study on
university students in Jeonju
Kyungjong Min, Kunjong Lee, Heajung Chung
Food Science and Preservation.2024; 31(3): 408. CrossRef - Relationship between convergence awareness for healthy weight management and eating behavior, creativity and convergence competency of adolescents
Yunhwa Kim, Youngmi Lee, Yeon-Kyung Lee
Journal of Nutrition and Health.2022; 55(3): 376. CrossRef - Factors influencing disordered eating behavior based on the theory of triadic influence
Jee Hee Han, Sun Ah Kim, Sue Kim, Jin Young Park
Perspectives in Psychiatric Care.2019; 55(3): 366. CrossRef - Tendency and Network Analysis of Diet Using Big Data
Eun-Jin Jung, Un-Jae Chang
Journal of the Korean Dietetic Association.2016; 22(4): 310. CrossRef
Age and anthropometric measurements of middle school girls according to various stages of dieting
1) Mean ±SD
abc: different superscripts were significantly different at p < 0.05 by Duncan's multiple range test.
**: p < 0.01, ***: p < 0.001
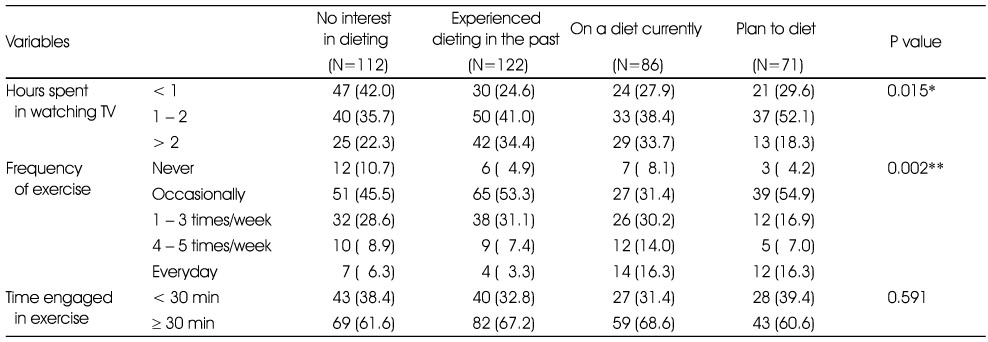
Lifestyle of middle school girls according to various stages of dieting
*: p < 0.05, **: p < 0.01
Desirable dietary habits of middle school girls according to various stages of dieting
1) Mean ± SD
ab: different superscripts were significantly different at p < 0.05 by Duncan's multiple range test.
*: p < 0.05, **: p < 0.01, ***: p < 0.001
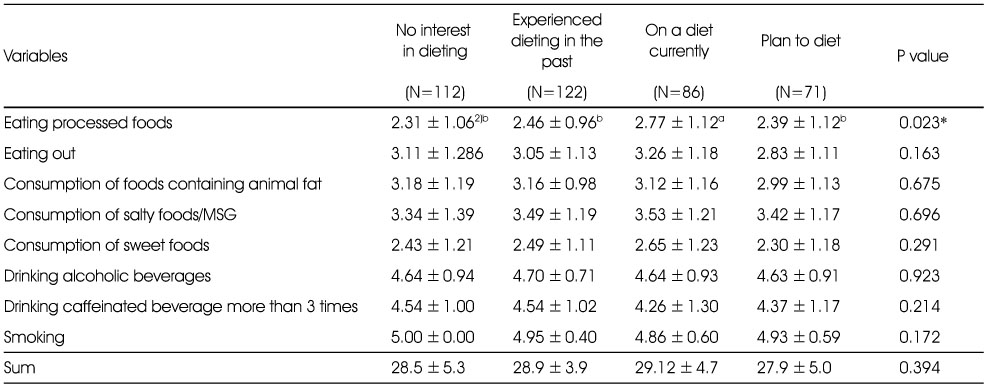
Undesirable dietary habits of middle school girls according to various stages of dieting1)
1) reversely coded: yes=1, sometimes=3, no=5
2) Mean ± SD
ab: different superscripts were significantly different at p < 0.05 by Duncan's multiple range test.
*: p < 0.05
Disordered eating of middle school girls according to various stages of dieting
1) Three subclasses of EAT-26
2) Mean ± SD
abc: different superscripts were significantly different at p < 0.05 by Duncan's multiple range test.
**: p < 0.01, ***: p < 0.001
Distribution of middle school girls with disordered eating according to various stages of dieting
1) N (%)
*: p < 0.05
The features of depression of middle school girls according to various stages of dieting
1) Mean ± SD
abc: different superscripts were significantly different at p < 0.05. by Duncan's multiple range test.
*: p < 0.05, **: p < 0.01
Distribution of middle school girls with depression according to various stages of dieting
***: p < 0.001
Weight distortion of middle school girls according to various stages of dieting
1) Underestimation group, 2) Normal perception group, 3) Overestimation group
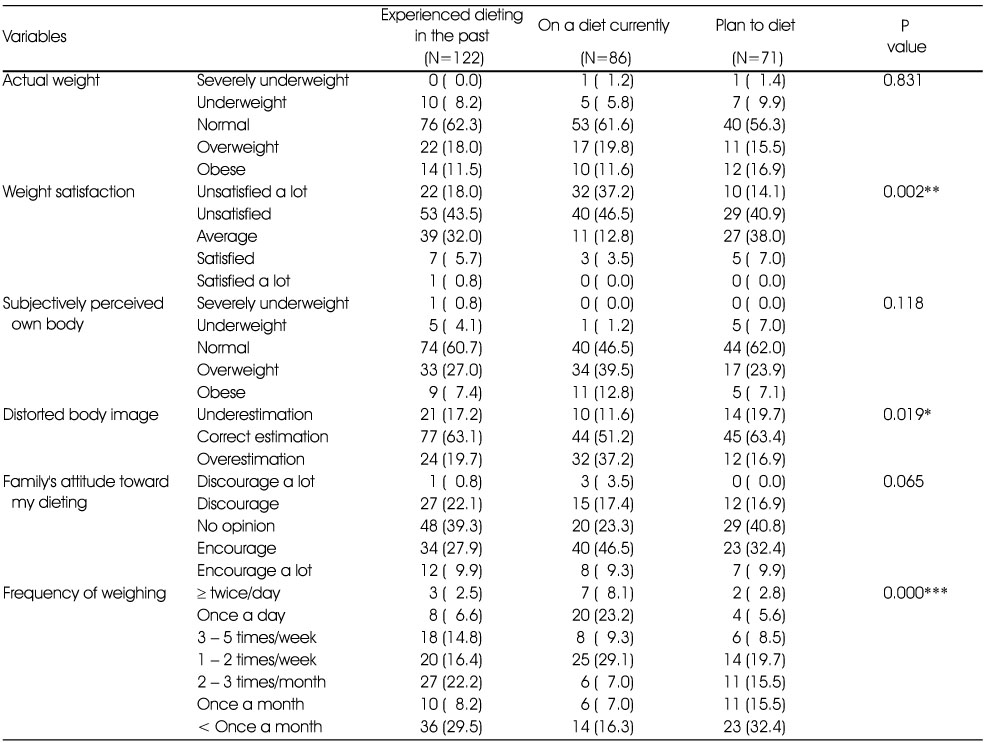
Weight-related perception and dieting behavior of middle school girls according to various stages of dieting
*: p < 0.05, **: p < 0.01, ***: p < 0.001
1) Mean ±SD abc: different superscripts were significantly different at p < 0.05 by Duncan's multiple range test. **: p < 0.01, ***: p < 0.001
*: p < 0.05, **: p < 0.01
1) Mean ± SD ab: different superscripts were significantly different at p < 0.05 by Duncan's multiple range test. *: p < 0.05, **: p < 0.01, ***: p < 0.001
1) reversely coded: yes=1, sometimes=3, no=5 2) Mean ± SD ab: different superscripts were significantly different at p < 0.05 by Duncan's multiple range test. *: p < 0.05
1) Three subclasses of EAT-26 2) Mean ± SD abc: different superscripts were significantly different at p < 0.05 by Duncan's multiple range test. **: p < 0.01, ***: p < 0.001
1) N (%) *: p < 0.05
1) Mean ± SD abc: different superscripts were significantly different at p < 0.05. by Duncan's multiple range test. *: p < 0.05, **: p < 0.01
***: p < 0.001
1) Underestimation group, 2) Normal perception group, 3) Overestimation group
*: p < 0.05, **: p < 0.01, ***: p < 0.001

 KSCN
KSCN


 Cite
Cite


