Articles
- Page Path
- HOME > Korean J Community Nutr > Volume 17(4); 2012 > Article
-
Original Article
- A Study on the Health and Nutritional Characteristics according to Household Income and Obesity in Korean Adults Aged over 50: Based on 2005 KNHANES
- So Hyun Ahn, Sook Mee Son, Hye Kyeong Kim
-
Korean Journal of Community Nutrition 2012;17(4):463-478.
DOI: https://doi.org/10.5720/kjcn.2012.17.4.463
Published online: August 31, 2012
Department of Food Science & Nutrition, The Catholic University of Korea, Bucheon, Korea.
- Corresponding author: Hye-Kyeong Kim, Department of Food Science & Nutrition, The Catholic University of Korea, 43-1 Yeokgok 2-dong, Wonmi-gu, Bucheon, Gyeonggi-do 420-743, Korea. Tel: (02) 2164-4314, Fax: (02) 2164-4314, hkyeong@catholic.ac.kr
Copyright © 2012 The Korean Society of Community Nutrition
- 411 Views
- 1 Download
- 9 Crossref
Figure & Data
REFERENCES
Citations

- Dietary Behaviors and Health Status by Income Level in Single-Adult Households in Korea: An Analysis of Data From the 2016-2018 Korea National Health and Nutrition Examination Survey
Min-Hee Han, Bok-Mi Jung, Mi-Kyeong Choi
Clinical Nutrition Research.2025; 14(1): 55. CrossRef - Changes in the prevalence of metabolic syndrome before and after the COVID-19 pandemic according to household income levels
Hyunjung Kang, Dagyeong Lee, Junhee Park, Su-Min Jung
Korean Journal of Family Medicine.2025; 46(1): 27. CrossRef - Comparison of the health and nutritional status of Korean elderly considering the household income level, using the 2018 Korea National Health and Nutrition Examination Survey
Jin Mo Khil
Journal of Nutrition and Health.2021; 54(1): 39. CrossRef - Biochemical Characteristics and Dietary Intake according to Household Income Levels of Korean Adolescents: Using Data from the 6th (2013 ~ 2015) Korea National Health and Nutrition Examination Survey
Yu-Kyeong Kwon, Sook-Bae Kim
Korean Journal of Community Nutrition.2021; 26(6): 467. CrossRef - Estimated dietary intake of vitamin A in Korean adults: Based on the Korea National Health and Nutrition Examination Survey 2007~2012
Seong-Ah Kim, Shinyoung Jun, Hyojee Joung
Journal of Nutrition and Health.2016; 49(4): 258. CrossRef - Optimization of Extraction Conditions for Mixture of Camellia sinensis L. and Artemisia argyi by Response Surface Methodology
Young-Hyun Kim, Woo-Sik Kim, Jae-Min Kim, Sun-il Choi, Tae-Dong Jung, Jin-Ha Lee, Jong-Dai Kim, Jae Kag Lim, Ok-Hwan Lee
Journal of Food Hygiene and Safety.2016; 31(4): 278. CrossRef - A study on nutritional intakes in middle income adults based on data from the 5thKorean National Health and Nutrition Examination Survey
Ji-Myung Kim, Hye Sook Kim, Ki Nam Kim
Journal of Nutrition and Health.2015; 48(4): 364. CrossRef - Evaluation of Obesity and Nutritional Status by Age among Low-income Women aged over 20 -Using Data from the Fourth Korea National Health and Nutrition Examination Survey-
Hee-Kyung Jang
Journal of the East Asian Society of Dietary Life.2015; 25(2): 246. CrossRef - An Evaluation of Dietary Habit and Nutritional Status by Household Income in Female Adults over the Age of 20 - Using Data from the Fourth Korea National Health and Nutrition Examination Survey -
Hee-Kyung Jang
The Korean Journal of Food And Nutrition.2014; 27(4): 660. CrossRef
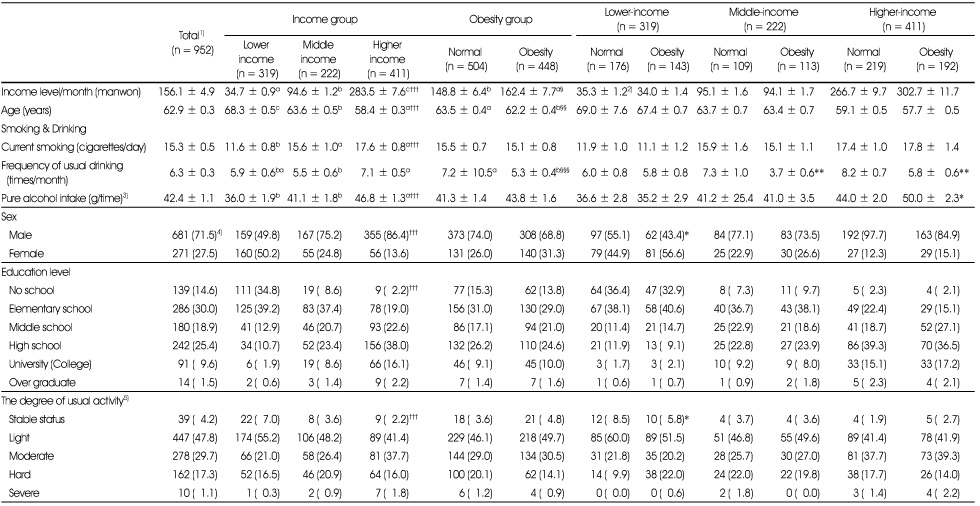
General characteristics of subjects
1) By two-way analysis, Mean ± SE: Mean values are significantly different among the income groups by DUNCAN's multiple range test (†: p < 0.05, ††: p < 0.01, †††: p < 0.001), Mean ± SE: Mean values are significantly different between normal group and obesity group (§: p < 0.05, §§: p < 0.01, §§§: p < 0.001)
2) Mean ± SE: Mean values are significantly different between normal and obesity in each income group by t-test or χ2-test (*: p < 0.05, **: p < 0.01, ***: p < 0.001)
3) Pure alcohol intake (g/time) : a glass of Soju = 45 g, alcohol concentration in a glass of soju-20%, quantity of pure alcohol in a glass of Soju = 45 × 0.2 = 9 g
4) N (%)
5) The degree of usual activity
Stable status : almost lying down or spending a sedentary life Light : a white-collar worker, a office manager, a technical worker, a housewife do light household cores or a worker in a similar position Moderate : a housewife doing heavy household chores Hard : who works in farming, fishing, civil engineering, building industry or something like this Severe : a very heavy blue-collar worker such as transporting wooden or an athlete and so on.
Means without a common letter (a, b, c) differ significantly among income groups.
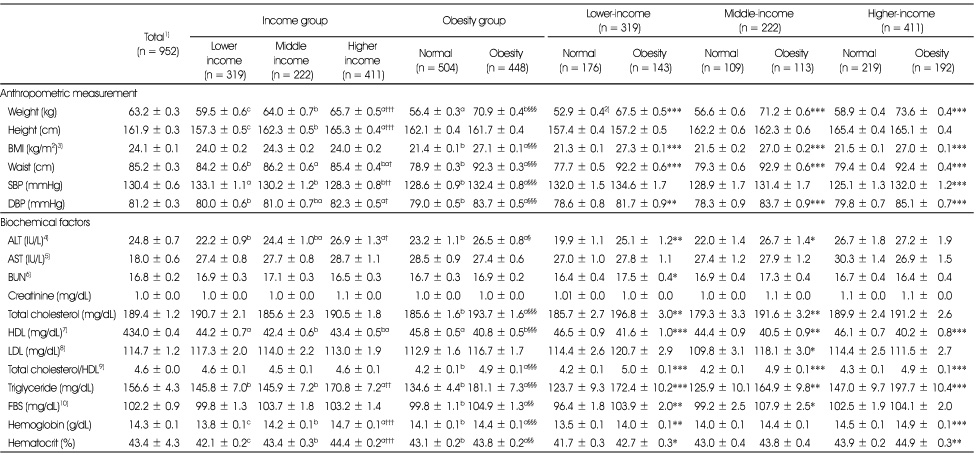
Anthropometric measurement and biochemical factors of subjects
1) By two-way analysis, Mean ± SE: Mean values are significantly different among the income groups by DUNCAN's multiple range test (†: p < 0.05, ††: p < 0.01, †††: p < 0.001), Mean ± SE: Mean values are significantly different between normal group and obesity group (§: p < 0.05, §§: p < 0.01, §§§: p < 0.001)
2) Mean ± SE: Mean values adjusted by age and sex are significantly different between normal and obesity in each income group by t-test or χ2-test, (*: p < 0.05, **: p < 0.01, ***: p < 0.001)
3) BMI (kg/m2) = weight (kg)/height (m2), 4) ALT = Alanine aminotransferase (IU/L), GPT, 5) AST = Aspartate transminase, GOT (IU/L), 6) BUN = Blood urea nitrogen (mg/dL), 7) HDL = low density lipoprotein, 8) LDL (low density lipoprotein) = Total cholesterol-HDL-cholesterol-Triglyceride/5, 9) Total cholesterol/HDL = Total cholesterol/HDL-cholesterol ratio, 10)
FBS = Fasting blood sugar (mg/dL)
Means without a common letter (a, b, c) differ significantly among income groups.
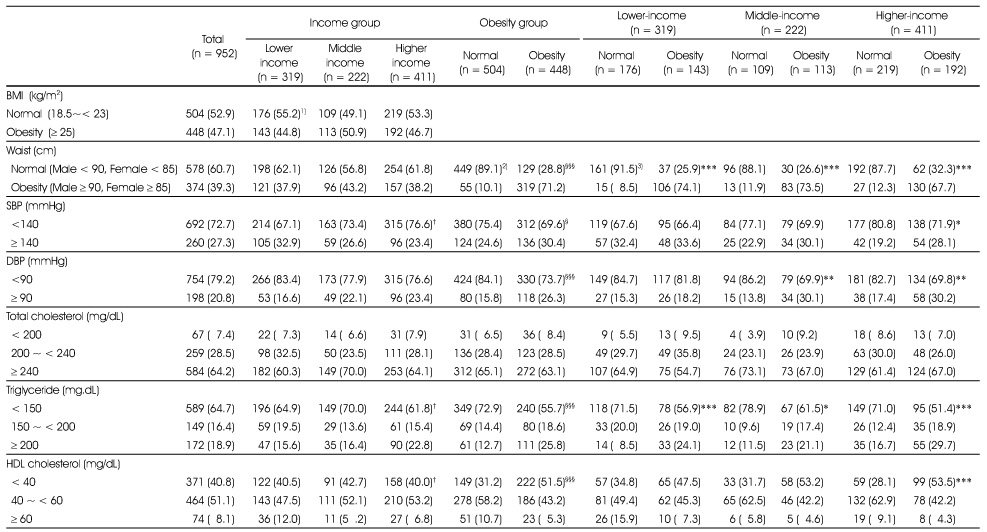
Distribution of the subjects according to anthropometric measurement and biochemical factors of subjects
1) N (%): by χ2-test among the income groups (†: p < 0.05, ††: p < 0.01, †††: p < 0.001)
2) N (%): by χ2-test between normal group and obesity group (§: p < 0.05, §§: p < 0.01, §§§: p < 0.001)
3) N (%): by χ2-test between normal and obesity in each income group (*: p < 0.05, **: p < 0.01, ***: p < 0.001)
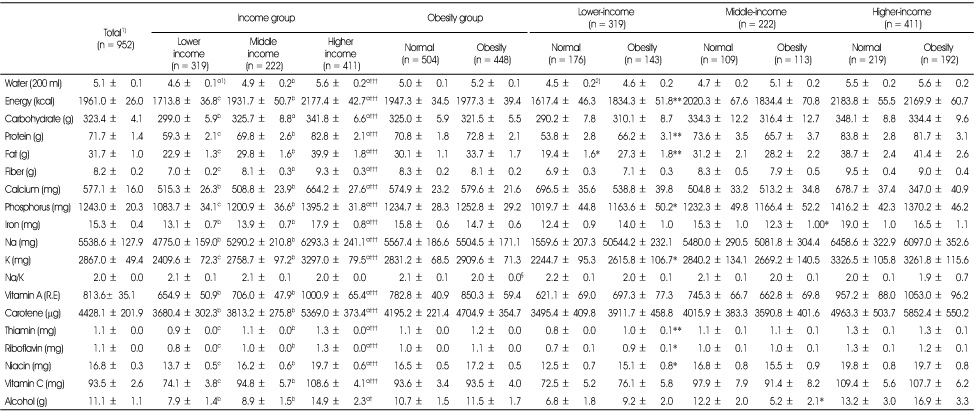
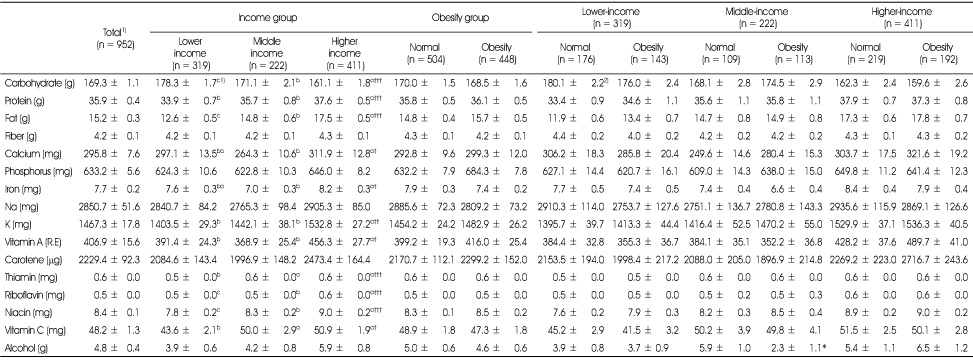
Nutrient intakes of subjects
1) By two-way analysis, Mean ± SE: Mean values are significantly different among the income groups by DUNCAN's multiple range test (†: p < 0.05, ††: p < 0.01, †††: p < 0.001), Mean ± SE: There were no significance between normal group and obesity group.
2) Mean ± SE: Mean values adjusted by age and sex are significantly different between normal and obesity in each income group by t-test or χ2-test, (*: p < 0.05, **: p < 0.01, ***: p < 0.001)
Means without a common letter (a, b, c) differ significantly among income groups.
Nutrient intakes per 1000kcal of subjects
1) By two-way analysis, Mean ± SE: Mean values are significantly different among the income groups by DUNCAN's multiple range test (†: p < 0.05, ††: p < 0.01, †††: p < 0.001), Mean ± SE: There were no significance between normal group and obesity group.
2) Mean ± SE: Mean values adjusted by age and sex are significantly different between normal and obesity in each income group by t-test or χ2-test, (*: p < 0.05, **: p < 0.01, ***: p < 0.001)
Means without a common letter (a, b, c) differ significantly among income groups.
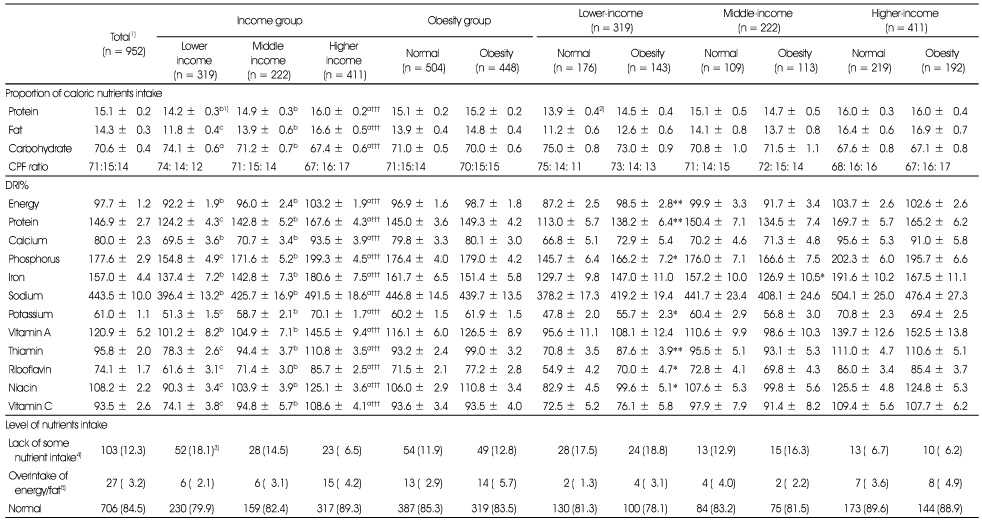
Proportion of nutrients intake of subjects
1) By two-way analysis, Mean ± SE: Mean values are significantly different among the income groups by DUNCAN's multiple range test (†: p < 0.05, ††: p < 0.01, †††: p < 0.001), Mean ± SE: There were no significance between normal group and obesity group.
2) Mean ± SE: Mean values adjusted by age and sex are significantly different between normal and obesity in each income group by t-test or χ2-test, (*: p < 0.05, **: p < 0.01, ***: p < 0.001)
3) N (%): †: p < 0.05, ††: p < 0.01, †††: p < 0.001, χ2-test
4) The subjects consuming below 75% EER (estimated energy requirement) and below EAR (estimated average requirement) in Ca, Fe, Vit A, riboflavin.
5) The subjects consuming over 125% EER and beyond optimal proportion of fat to energy.
Means without a common letter (a, b, c) differ significantly among income groups.
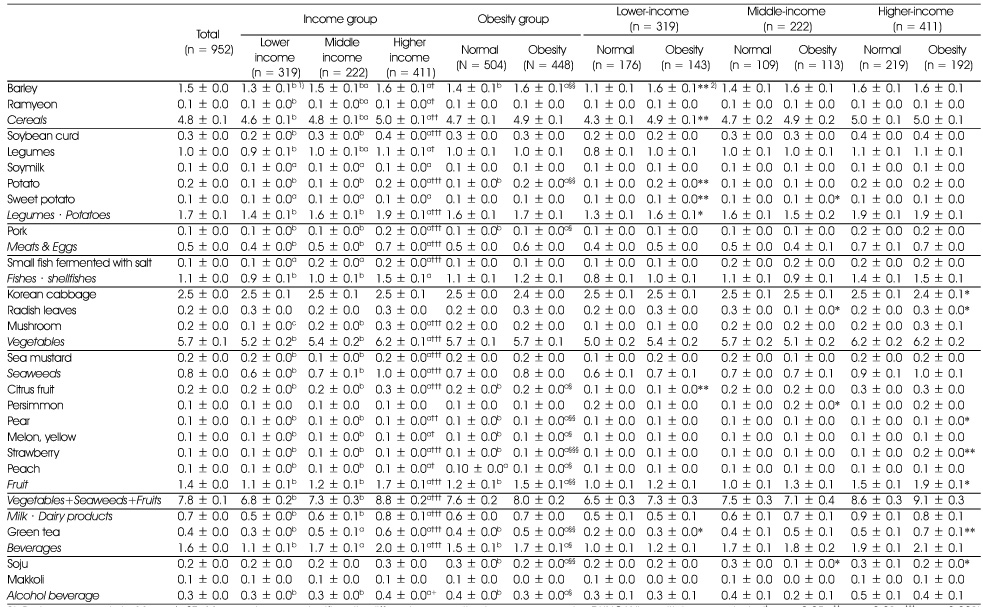
Food consumption frequency of subjects
1) By two-way analysis, Mean ± SE: Mean values are significantly different among the income groups by DUNCAN's multiple range test (†: p < 0.05, ††: p < 0.01, †††: p < 0.001), Mean ± SE: Mean values are significantly different between normal group and obesity group (§: p < 0.05, §§: p < 0.01, §§§: p < 0.001)
2) Mean ± SE: Mean values adjusted by age and sex are significantly different between normal and obesity in each income group by t-test or χ2-test, (*: p < 0.05, **: p < 0.01, ***: p < 0.001)
Score: 3 times/day = 3.0, 2 times/day = 2.0, 1 time/day = 1.0, 4-6 times/week = 0.71, 2-3 times/week = 0.36, 1 time/week = 0.14, 2-3 times/month = 0.09, 1 time/month = 0.04, 6-11 times/year = 0.02, seldom = 0
Means without a common letter (a, b, c) differ significantly among income groups.
1) By two-way analysis, Mean ± SE: Mean values are significantly different among the income groups by DUNCAN's multiple range test (†: p < 0.05, ††: p < 0.01, †††: p < 0.001), Mean ± SE: Mean values are significantly different between normal group and obesity group (§: p < 0.05, §§: p < 0.01, §§§: p < 0.001) 2) Mean ± SE: Mean values are significantly different between normal and obesity in each income group by t-test or χ2-test (*: p < 0.05, **: p < 0.01, ***: p < 0.001) 3) Pure alcohol intake (g/time) : a glass of Soju = 45 g, alcohol concentration in a glass of soju-20%, quantity of pure alcohol in a glass of Soju = 45 × 0.2 = 9 g 4) N (%) 5) The degree of usual activity
Stable status : almost lying down or spending a sedentary life Light : a white-collar worker, a office manager, a technical worker, a housewife do light household cores or a worker in a similar position Moderate : a housewife doing heavy household chores Hard : who works in farming, fishing, civil engineering, building industry or something like this Severe : a very heavy blue-collar worker such as transporting wooden or an athlete and so on. Means without a common letter (a, b, c) differ significantly among income groups.
1) By two-way analysis, Mean ± SE: Mean values are significantly different among the income groups by DUNCAN's multiple range test (†: p < 0.05, ††: p < 0.01, †††: p < 0.001), Mean ± SE: Mean values are significantly different between normal group and obesity group (§: p < 0.05, §§: p < 0.01, §§§: p < 0.001) 2) Mean ± SE: Mean values adjusted by age and sex are significantly different between normal and obesity in each income group by t-test or χ2-test, (*: p < 0.05, **: p < 0.01, ***: p < 0.001) 3) BMI (kg/m2) = weight (kg)/height (m2), 4) ALT = Alanine aminotransferase (IU/L), GPT, 5) AST = Aspartate transminase, GOT (IU/L), 6) BUN = Blood urea nitrogen (mg/dL), 7) HDL = low density lipoprotein, 8) LDL (low density lipoprotein) = Total cholesterol-HDL-cholesterol-Triglyceride/5, 9) Total cholesterol/HDL = Total cholesterol/HDL-cholesterol ratio, 10) FBS = Fasting blood sugar (mg/dL) Means without a common letter (a, b, c) differ significantly among income groups.
1) N (%): by χ2-test among the income groups (†: p < 0.05, ††: p < 0.01, †††: p < 0.001) 2) N (%): by χ2-test between normal group and obesity group (§: p < 0.05, §§: p < 0.01, §§§: p < 0.001) 3) N (%): by χ2-test between normal and obesity in each income group (*: p < 0.05, **: p < 0.01, ***: p < 0.001)
1) By two-way analysis, Mean ± SE: Mean values are significantly different among the income groups by DUNCAN's multiple range test (†: p < 0.05, ††: p < 0.01, †††: p < 0.001), Mean ± SE: There were no significance between normal group and obesity group. 2) Mean ± SE: Mean values adjusted by age and sex are significantly different between normal and obesity in each income group by t-test or χ2-test, (*: p < 0.05, **: p < 0.01, ***: p < 0.001) Means without a common letter (a, b, c) differ significantly among income groups.
1) By two-way analysis, Mean ± SE: Mean values are significantly different among the income groups by DUNCAN's multiple range test (†: p < 0.05, ††: p < 0.01, †††: p < 0.001), Mean ± SE: There were no significance between normal group and obesity group. 2) Mean ± SE: Mean values adjusted by age and sex are significantly different between normal and obesity in each income group by t-test or χ2-test, (*: p < 0.05, **: p < 0.01, ***: p < 0.001) Means without a common letter (a, b, c) differ significantly among income groups.
1) By two-way analysis, Mean ± SE: Mean values are significantly different among the income groups by DUNCAN's multiple range test (†: p < 0.05, ††: p < 0.01, †††: p < 0.001), Mean ± SE: There were no significance between normal group and obesity group. 2) Mean ± SE: Mean values adjusted by age and sex are significantly different between normal and obesity in each income group by t-test or χ2-test, (*: p < 0.05, **: p < 0.01, ***: p < 0.001) 3) N (%): †: p < 0.05, ††: p < 0.01, †††: p < 0.001, χ2-test 4) The subjects consuming below 75% EER (estimated energy requirement) and below EAR (estimated average requirement) in Ca, Fe, Vit A, riboflavin. 5) The subjects consuming over 125% EER and beyond optimal proportion of fat to energy. Means without a common letter (a, b, c) differ significantly among income groups.
1) By two-way analysis, Mean ± SE: Mean values are significantly different among the income groups by DUNCAN's multiple range test (†: p < 0.05, ††: p < 0.01, †††: p < 0.001), Mean ± SE: Mean values are significantly different between normal group and obesity group (§: p < 0.05, §§: p < 0.01, §§§: p < 0.001) 2) Mean ± SE: Mean values adjusted by age and sex are significantly different between normal and obesity in each income group by t-test or χ2-test, (*: p < 0.05, **: p < 0.01, ***: p < 0.001) Score: 3 times/day = 3.0, 2 times/day = 2.0, 1 time/day = 1.0, 4-6 times/week = 0.71, 2-3 times/week = 0.36, 1 time/week = 0.14, 2-3 times/month = 0.09, 1 time/month = 0.04, 6-11 times/year = 0.02, seldom = 0 Means without a common letter (a, b, c) differ significantly among income groups.

 KSCN
KSCN
 PubReader
 Cite
Cite


