
Articles
- Page Path
- HOME > Korean J Community Nutr > Volume 20(3); 2015 > Article
-
Research Article
- The relationship between Physical Growth and Major Sources of Serum Vitamin D among Hospitalized Children of Changwon City
- Haeyoung Kang, Eunsil Her, Kyung-Hea Lee
-
Korean Journal of Community Nutrition 2015;20(3):197-207.
DOI: https://doi.org/10.5720/kjcn.2015.20.3.197
Published online: June 30, 2015
1Department of Food and Nutrition, Changwon National University, Changwon, Korea.
2Department of Food and Nutriton, Changshin University, Changwon, Korea.
- Corresponding author: Kyung-Hea Lee. Department of food and nutrition, Changwon National University, 20 Changwondaehak-ro, Uichanggu, Changwon, Gyeongsangnam-do 641-773, Korea. Tel: (055) 213-3514, Fax: (055) 281-7480, khl@changwon.ac.kr
• Received: May 26, 2015 • Revised: June 26, 2015 • Accepted: June 26, 2015
Copyright © 2015 The Korean Society of Community Nutrition
This is an Open-Access article distributed under the terms of the Creative Commons Attribution Non-Commercial License (http://creativecommons.org/licenses/by-nc/3.0/) which permits unrestricted non-commercial use, distribution, and reproduction in any medium, provided the original work is properly cited.
- 1,615 Views
- 0 Download
Abstract
-
Objectives
- This study was conducted to investigate the effects of the sources of vitamin D (duration of exposure to sunlight, intake of major food sources for vitamin D or vitamin D supplements) on the serum 25-(OH) D3 levels, and the physical growth of a child.
-
Methods
- Subjects were 296 children aged 1 to 5 years who visited S hospital located in Changwon City. Survey data collection was carried out by direct interview method, and the biochemical data were collected using hospital records.
-
Results
- The study subjects were divided into three groups according to their levels of serum 25-(OH) D3 (deficient, relatively insufficient, sufficient) and their percentage were 48.3%, 44.3% and 7.4% respectively. The average concentration of serum 25-(OH) D3 was 20.41 ± 6.55 ng/mL, which was relatively insufficient. The average duration of exposure to sunlight was 58.86 ± 49.18 minutes/day. A total score of vitamin D major food sources was 46.71 points (full marks 153), and the most frequently consumed food items were milk, eggs, and cheese. Thirty-four percent of the subjects took vitamin D supplements and their dose were 11.96 µg/day. Three vitamin D sources in sufficient group were higher than deficient or relatively insufficient group significantly. Intake of vitamin D supplements showed positive relation (+) and high explanation power (R2= 0.288) on serum 25-(OH) D3 concentration, but intake of vitamin D major food sources (+) and the duration of exposure to sunlight (+) had a low explanation power (R2= 0.068). The relations between serum 25-(OH) D3 concentration and physical growth (height and weight) were shown as negative (??, and their explanation powers were low as 7.3% and 5.9% respectively.
-
Conclusions
- This study results can be useful when discussing the intake standard of vitamin D and the effective intake method for children. In addition, it will be helpful to build the children's nutrition policy and to plan the nutrition education program to improve the vitamin D status in children.
- 1. Ahn HS, Um SS. Dietary intakes of infants and young children in Seoul area. J Korean Soc Matern Child Health 2003; 7(2): 179-191.
- 2. Lee HJ, Kim YA, Lee HS. The estimated dietary fiber intake of Korean by age and sex. J Korean Soc Food Sci Nutr 2006; 35(9): 1207-1214.Article
- 3. Pyo SH, Kang HJ. A study on the actual state of nutrition knowledge, dietary attitude, eating behavior, physical ability and locomotion of children aged 5 years in Siheung-city. Korean J Food Nutr 2014; 27(5): 760-770.Article
- 4. Choi MJ. Bone health and calcium, vitamin D, potassium: shortfall nutrients in Korean. Korean J Obes 2013; 22(3): 129-136.Article
- 5. Yu A, Yang YJ, Jeong SR, Kim JH, Kim YJ, Kwon OR. Calcium intakes in Korean and American populations. J Korean Diet Assoc 2013; 19(1): 46-58.Article
- 6. James LG, Sareen SG. Advanced nutrition and human metabolism. 3rd ed. California: Wadsworth; 1999. p. 373.
- 7. Chung YS, Yoo BW, Oh JE, Lee DC, Lee HS, Cho CY. The relationship between vitamin D levels and chronic diseases. Korean J Clin Geriatr 2010; 11(2): 154-169.
- 8. Shin MY, Kwun IS. Vitamin D revolution: Is it a vitamin or a hormone? Food Ind Nutr 2012; 17(2): 1-6.
- 9. Yang HR, Seo JW, Kim YJ, Kim JY, Ryoo E, Sim JG. Recent concepts on vitamin D in children and adolescents. Korean J Pediatr 2009; 52(10): 1082-1089.Article
- 10. Na B, No SJ, Kim MJ, Han HS, Jeong EH, Han YH. Nutritional status of vitamin D in Korean mothers and their newborn infants. Korean J Perinatol 2007; 18(4): 399-406.
- 11. Park Y. Vitamin D and atopic dermatitis. Allergy Asthma Respir Dis 2013; 1(3): 197-202.Article
- 12. Holick MF, Binkley NC, Bischoff-Ferrari HA, Gordon CM, Hanley DA, Heaney RP. Evaluation, treatment, and prevention of vitamin D deficiency: an endocrine society clinical practice guideline. J Clin Endocrinol Metab 2011; 96(7): 1911-1930.ArticlePubMed
- 13. Ross AC, Manson JE, Abrams SA, Aloia JF, Brannon PM, Clinton SK. The 2011 report on dietary reference intakes for calcium and vitamin D from the institute of medicine: What clinicians need to know. J Clin Endocrinol Metab 2011; 96(1): 53-58.PubMed
- 14. Yu A, Kim JH, Kwon OR, Oh SY, Kim JH, Yang YJ. Associations between serum 25-hydroxyvitamin D and consumption frequencies of vitamin D rich foods in Korean adults and older adults. Korean J Community Nutr 2014; 19(2): 122-132.Article
- 15. Kim SN, Kim SH. A survey on use of vitamin, mineral supplements by children in Daejeon city and Chungcheong province in Korea. Korean J Food Cult 2010; 25(2): 117-125.
- 16. Lee HS, Han JH, Kim SH. A survey on the consumption of vitamin and mineral supplements as health functional foods and related factors by Korean adolescents. Korean J Food Cult 2013; 28(4): 415-423.Article
- 17. Ministry of food and drug safety. Food and nutrient data system [Internet]. 2015; cited 2015 Mar 23]. Available from: http://www.foodnara.go.kr/kisna/index.do/.
- 18. The Korean Nutrition Society. Dietary reference intake for Korean. 2nd ed. Seoul: The Korean Nutrition Society; 2010. p. 165-178.
- 19. Kim YJ, Moon MS, Yang YJ, Kwon OR. Relationship between serum 25-hydroxyvitamin D concentration and the risks of metabolic syndrome in premenopausal and postmenopausal women. Korean J Nutr 2012; 45(1): 20-29.Article
- 20. Ronni C. Geriatric nutrition : A health professional's handbook. 4th ed. America: Jones & Bartlett Publishers; 2013. p. 39-43.
- 21. Yoo HN. Related factors of vitamin D deficiency and metabolic syndrome in children and adolescents - based on Korea National Health And Nutrition Examination Survey V, (KNHANES) ??[master's thesis]. Hanyang University; 2013.
- 22. Yoon JS, Song MK. Seasonal differences in outdoor activity time and serum 25-(OH) vitamin D status of Korean young women. Korean J Community Nutr 2014; 19(3): 231-240.Article
- 23. Kim YJ, Lee JS. Association of vitamin D status with acute lower respiratory infection in children. Pediatr Allergy Respir Dis 2010; 20(3): 173-178.
- 24. Baek JU, Hwangbo JW, Lee HR, Lee SY. Vitamin D insufficiency is associated with food sensitization in children under 2 years with atopic dermatitis. Allergy Asthma Respir Dis 2013; 1(3): 211-215.Article
- 25. Shin YH, Park JH, Sung MS, Kim SW. Correlation between serum 25-hydroxyvitamin D levels and severity of atopic dermatitis in children. Allergy Asthma Respir Dis 2014; 2(2): 114-121.Article
- 26. Bedner M, Lippa KA, Tai SSC. An assessment of 25-hydroxyvitamin D measurements in comparability studies conducted by the Vitamin D Metabolites Quality Assurance Program. Clin Chim Acta 2013; 426(15): 6-11.ArticlePubMedPMC
- 27. Kim HJ, Kim EH. Comparison of chemiluminescence immunoassay (CIA) and immunochromatography assay(ICA) for Detecting HBsAg and Anti-HBs. J Korea Acad Ind Coop Soc 2013; 14(7): 3419-3424.Article
- 28. Ministry of Health and Welfare, Korea Center for Disease Control and Prevention. Korea National Health And Nutrition Examination Survey(KNHANES -1) [Internet]. 2014; cited 2015 Mar 19]. Available from: https://knhanes.cdc.go.kr/knhanes/index.do/.
- 29. National Academy of Agricultural Science. Functional ingredient list of food-Vitamin D [Internet]. 2015; cited 2015 Mar 23]. Available from: http://koreanfood.rda.go.kr/.
- 30. Ministry of food and drug safety. Functional food-Vitamin D standard [Internet]. 2015; cited 2015 Mar 20]. Available from: http://www.foodnara.go.kr/hfoodi/industry/.
- 31. Kwak MK, Kim JH. The radiative characteristics of EUV-B over the Korean peninsula and exposure time for synthesizing adequate vitamin D. Atmos. J Korean Meteorological Soc 2011; 21(1): 123-130.
- 32. Hyun HJ, Kim JH, Ko GY, Park BS, Choi EY, Ahn MH. The relationship among sun-screening agent use, bone health promotion behavior and bone mineral density of female college students. J Korean Biol Nurs Sci 2013; 15(4): 202-209.Article
- 33. Kim MY, Yoon CS. The research on the ultraviolet protector recognition of the adult and propensity to consume. J Beauty Ind 2014; 8(1): 63-84.
- 34. Kang JH. The relationship between vitamin D levels and extraskeletal disease [master's thesis]. Seoul National University; 2013.
- 35. Shin ES, Kim EJ, You YE. A study on the spatial configuration and uses of kindergartens outdoor playground. Soonchunhyang J Hum 2012; 31(2): 200-228.
- 36. Choi HJ. New insight into the action of vitamin D. Korean J Fam Med 2011; 32(2): 89-96.Article
REFERENCES
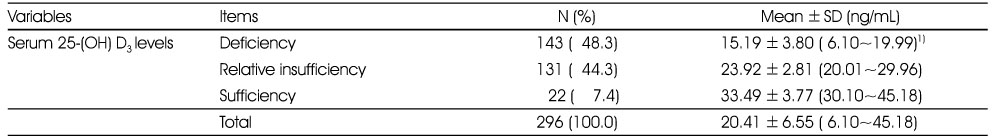

Table 3

Comparison of the duration of exposure to sunlight and methods of ultraviolet block by the serum 25-(OH) D3 levels
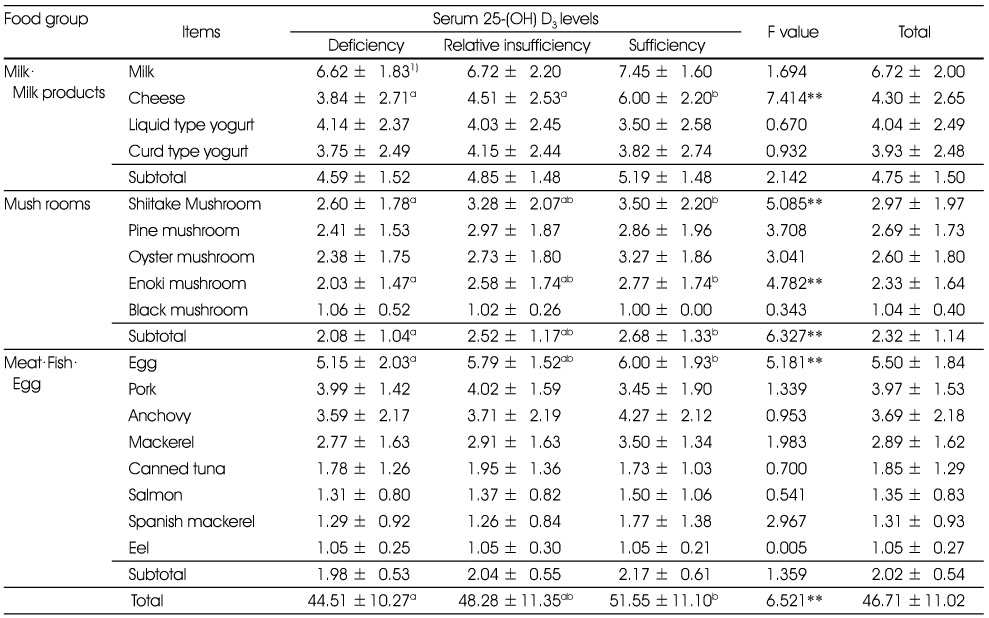
Table 5

Comparison of intake of vitamin D supplements and their daily dose by serum 25-(OH) D3 levels
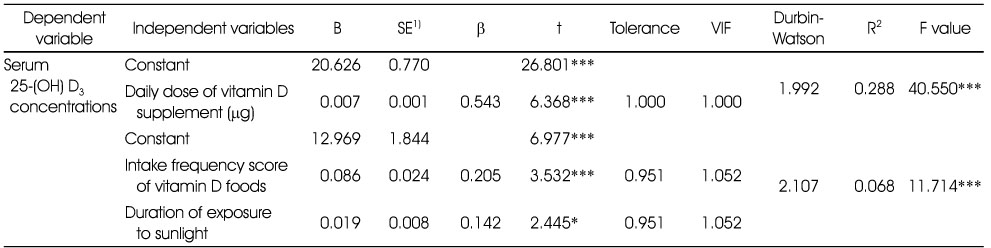


Figure & Data
REFERENCES
Citations
Citations to this article as recorded by 
 Cite
CiteThe relationship between Physical Growth and Major Sources of Serum Vitamin D among Hospitalized Children of Changwon City
The relationship between Physical Growth and Major Sources of Serum Vitamin D among Hospitalized Children of Changwon City
Distribution of independent variables
1) Range
The general characteristics of the subjects by serum 25-(OH) D3 levels
1) N (%)
2) Mean ± SD
ab: Means with different letters are significantly different at a=0.05 by Duncan's multiple range test.
*: p < 0.05, ***: p < 0.001
Comparison of the duration of exposure to sunlight and methods of ultraviolet block by the serum 25-(OH) D3 levels
1) Mean ± SD
2) N (%)
3) Multiple responses
ab: Means with different letters are significantly different at a=0.05 by Duncan's multiple range test.
**: p < 0.01
Intake frequency scores of vitamin D food sources by serum 25-(OH) D3 levels
1) Mean ± SD
ab: Means with different letters are significantly different at α=0.05 by Duncan's multiple range test.
**: p < 0.01
Comparison of intake of vitamin D supplements and their daily dose by serum 25-(OH) D3 levels
1) N (%)
2) Mean ± SD
3) Range
ab: Means with different letters are significantly different at α=0.05 by Duncan's multiple range test.
***: p < 0.001
Regression analysis of the influence of vitamin D sources on serum 25-(OH) D3 concentrations
1) Standard error
*: p < 0.05, ***: p < 0.001
Comparison of physical growth characteristics by serum 25-(OH) D3 levels
1) Mean ± SD
ab: Means with different letters are significantly different at α=0.05 by Duncan's multiple range test.
***: p < 0.001
Regression analysis of influence of the serum 25-(OH) D3 concentration on height and body weight
1) Standard error
***: p < 0.001
Regression analysis of the influence of age on height, body weight and serum 25-(OH) D3 concentrations
1) Standard error
***: p < 0.001
Table 1
Distribution of independent variables
1) Range
Table 2
The general characteristics of the subjects by serum 25-(OH) D3 levels
1) N (%) 2) Mean ± SD ab: Means with different letters are significantly different at a=0.05 by Duncan's multiple range test. *: p < 0.05, ***: p < 0.001
Table 3
Comparison of the duration of exposure to sunlight and methods of ultraviolet block by the serum 25-(OH) D3 levels
1) Mean ± SD 2) N (%) 3) Multiple responses ab: Means with different letters are significantly different at a=0.05 by Duncan's multiple range test. **: p < 0.01
Table 4
Intake frequency scores of vitamin D food sources by serum 25-(OH) D3 levels
1) Mean ± SD ab: Means with different letters are significantly different at α=0.05 by Duncan's multiple range test. **: p < 0.01
Table 5
Comparison of intake of vitamin D supplements and their daily dose by serum 25-(OH) D3 levels
1) N (%) 2) Mean ± SD 3) Range ab: Means with different letters are significantly different at α=0.05 by Duncan's multiple range test. ***: p < 0.001
Table 6
Regression analysis of the influence of vitamin D sources on serum 25-(OH) D3 concentrations
1) Standard error *: p < 0.05, ***: p < 0.001
Table 7
Comparison of physical growth characteristics by serum 25-(OH) D3 levels
1) Mean ± SD ab: Means with different letters are significantly different at α=0.05 by Duncan's multiple range test. ***: p < 0.001
Table 8
Regression analysis of influence of the serum 25-(OH) D3 concentration on height and body weight
1) Standard error ***: p < 0.001
Table 9
Regression analysis of the influence of age on height, body weight and serum 25-(OH) D3 concentrations
1) Standard error ***: p < 0.001


