Warning: mkdir(): Permission denied in /home/virtual/lib/view_data.php on line 81
Warning: fopen(upload/ip_log/ip_log_2024-11.txt): failed to open stream: No such file or directory in /home/virtual/lib/view_data.php on line 83
Warning: fwrite() expects parameter 1 to be resource, boolean given in /home/virtual/lib/view_data.php on line 84 Comparative Analysis of the Quality Attributes Affecting Students' Satisfaction on School Lunch Service of Middle School by Year
Department of Food & Nutrition, Hanyang Women's University, Seoul, Korea.
Corresponding author: Bo Sook Yi, Department of Food & Nutrition, Hanyang Women's University, 17 Haengdangdong Sungdonggu, Seoul 133-793, Korea. Tel: (02)2290-2180, Fax: (02) 2290-2199, bslee@hywoman.ac.kr
• Received: June 25, 2012 • Revised: August 1, 2012 • Accepted: August 8, 2012
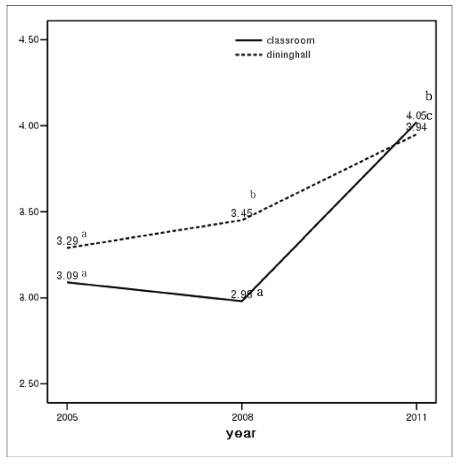
This study was conducted to investigate quality attributes which could affect foodservic satisfaction by the year (2005, 2008, 2011) and dining area (classroom vs. dining hall) in order to find ways to improve school lunch service and foodservice satisfaction of middle school students. The numbers of those surveyed were 1,103 students in 2005, 1,917 students in 2008, and 1,921 students in 2011. Overall foodservice satisfaction was significantly increased gradually in dining hall food service: 3.29 ± 1.21 in 2005, 3.45 ± 1.00 in 2008, 3.94 ± 0.98 in 2011. In classroom food service, overall foodservice satisfaction was not significantly different between in 2005 (3.09 ± 0.97) and in 2008 (2.98 ± 1.02), but it was significantly increased in 2011 (4.05 ± 1.00). Stepwise multiple regression analysis showed that overall foodservice satisfaction was most affected by the taste of food. The importance of 11 quality attributes except food sanitation and gathering feedback on school meals was significantly increased in 2011 compared with 2005. Food sanitation among 13 attributes was most important attribute in 2005 and 2011. The numbers of quality attributes affecting students' overall foodservice satisfaction were 5 to 7 by year, those attributes were almost identical with attributes which students thought importantly. Therefore, in order to increase the overall foodservice satisfaction of the school lunch service continually, it is recommended to identify the quality attributes that are important to students, and to check their levels of performance in order to overcome their differences.
This study was supported by grants from Hanyang Women's University in 2009.
REFERENCES
1. Byun GI, Jung BH. A study on the preference and satisfaction on menu of school lunch service of high school students in Gyeonju area. Korean J Food Cult. 2006; 21(5): 481-490.
2. Han KS, Hong SK. A study of the operation of contract food services management and menu preferences of middle school students in Seoul. Korean J Community Nutr. 2002; 7(4): 559-570.
3. Jang MR, Kim JY. Comparison of importance and performance to the school lunch service according of male and female middle school students in the Gangwon province. J Korean Diet Assoc. 2005; 11(1): 95-104.
4. Kim KA, Kim SJ, Jung LH, Jeon ER. Degree of satisfaction on the school foodservice among the middle school students in Gwangju and Chonnam area. Korean J Soc Food Cookery Sci. 2002; 18(6): 579-585.
5. Kim KJ, Yi BS, Park MK. Analysis of the recognition and quality attributes on school lunch swevice of middle school students by gender in Gyeonggi province. J Korean Soc Sch Health. 2010; 23(2): 297-307.
6. Kim SH, Lee KA, Yu CH, Song YS, Kim WK, Yoon HR, Kim JH, Lee JS, Kim MK. Comparison of student satisfaction with the school food service programs in middle and high schools by food service management types. Korean J Nutr. 2003; 36(2): 211-222.
7. Kim SH, Lee KA, Yu CH, Song YS, Kim WK, Yoon HR, Kim JH, Lee JS, Kim MK. Elementary, middle and high school teachers' opinions of school foodservice programs. Korean J Nutr. 2004; 37(8): 701-711.
8. Kwak T, Chang H, Lee N. A Study on Cost Analyses and an Efficient Financial Management in Self-Operated and Contract-Managed Secondary School Foodservices. Korean J Nutr. 2003; 36(10): 1083-1093.
9. Lee HS, Jang MH. Survey of students satisfaction with school food-service programs in Gangwon province. Korean J Food Nutr. 2005; 18(3): 175-191.
10. Lee KE. Adolescents' Nutrient Intake Determined by Plate Waste at School Food Services. Korean J Community Nutr. 2005; 10(4): 484-492.
11. Lee YE. An analysis on the satisfaction with the quality of school foodservice in Chungbuk privince. Korean J Food Cult. 2008; 23(1): 105-114.
12. Ministry of Education & Human Resources. Comprehensive Plan for School Foodservice Improvement. 2007; 12-40.
13. Ministry of Education, Science and Technology. School Meals hygiene guidelines 11-134000-000185-14. 2010; 94-99.
14. Mo SJ, Suh JS, Lyu ES. The evaluation of the perception of students and employees for foodservice characteristics of in high schools in the Busan area. Korean J Food Cookery Sci. 2005; 21(2): 250-262.
15. Oh YM, Kim MH, Chung JS. The study of satisfaction, meal preference and improvement on school lunch program of middleschoolboys and girls in Jeonju. J Korean Diet Assoc. 2006; 12(4): 358-368.
16. Park MH, Choi YS, Kim YJ. Comparison of dietary attitudes and attitudes to the school lunch service of elementary and middle school students living in the same region. Korean J Community Nutr. 2002; 7(1): 3-13.
17. Park MK, Yang IS, Yi BS, Kim YS. Analysis of the quality attributes and the customer satisfaction in school foodservice by school type and distribution place. J Korean Diet Assoc. 2010; 16(2): 83-99.
18. Park YS, Lee JW, Lee MS. Comparisons of Students' and their Parents' Satisfaction of School Lunch Program in middle School by Foodservice Mangement. Korean J Community Nutr. 1997; 2(2): 218-231.
19. Ryu K, Woo CN, Kim WJ. Assessment of dietitian's nutritional quality management for school food service. J Korean Soc Food Sci Nutr. 2006; 35(2): 238-247.
21. Woodruff RB, Cadotte ER, Jenkins RL. Modeling consumer satisfaction process using experience-based norms. J Marketing Res. 1983; 20: 296-304.
22. Yang IS, Park MK. Identifying the Quality Attributes Affecting Customer Satisfaction of School Foodservice by City and Province: Students, Parents, and Faculty. J Korean Diet Assoc. 2008; 14(3): 302-318.
23. Yang IS, Yi BS, Cha JA, Han KS, Chae IS, Lee JM. Foodservice in institution. 2003; Paju: Kyomunsa; 39-40.
24. Yang IS, Yi BS, Park MK, Kim HY. Survey on school foodservice satisfaction(Report by grnats from of Ministry of Education, Science and Technology). 2011; Yonsei University; 3-5.
25. Yi BS, Yang IS, Park MK. Annual analysis on quality attributes and customer satisfaction in school foodservice. Korean J Nutr. 2009; 42(8): 770-783.
26. Yoo YJ, Hong WS, Chio YS. The assessment of high school students' foodservice satisfaction in accordance with type of foodservice management. Korean J Soc Food Sci. 2000; 16(2): 112-120.
27. Yoon JH, Choo JC, Chung SJ, Ryu SH. Satisfaction of Elementary Students Eating School Lunch; Association with Level of Involvement in School Lunch Service. Korean J Community Nutr. 2005; 10(5): 668-676.
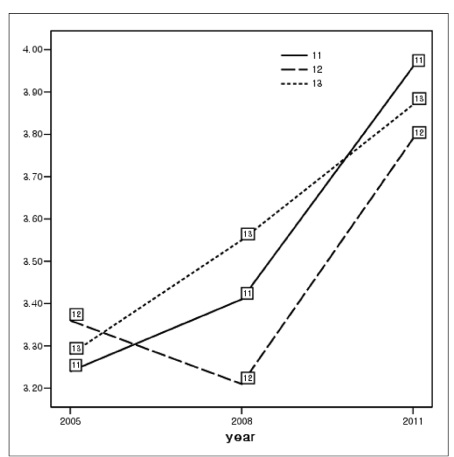
Fig. 1
Students' overall satisfaction on school lunch service by year and dining area.
Fig. 2-1
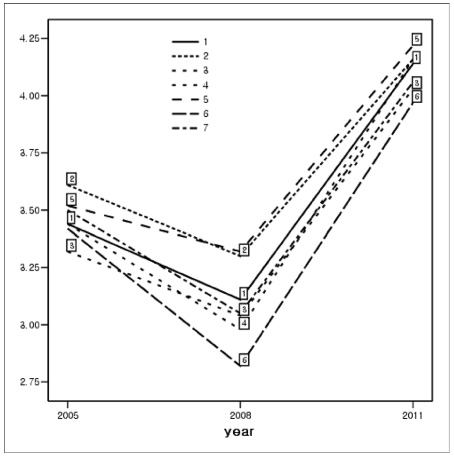
Changes of the foodservice quality attributes relating to the quality of meals served in classroom by year.
1. Food taste bac F 131.2 p < 0.001
2. Proper temperature of food bac F 93.2 p < 0.001
3. Adequate food quantity bac F 96.3 p < 0.001
4. Diversity of the menu bac F 132.9 p < 0.001
5. Nutrition of food bac F 98.1 p < 0.001
6. Food sanitation bac F 130.3 p < 0.001
7. Quality of food ingredients bac F 124.7 p < 0.001
a, b, c: values are significantly different by year (2005, 2008, 2011)
Fig. 2-2
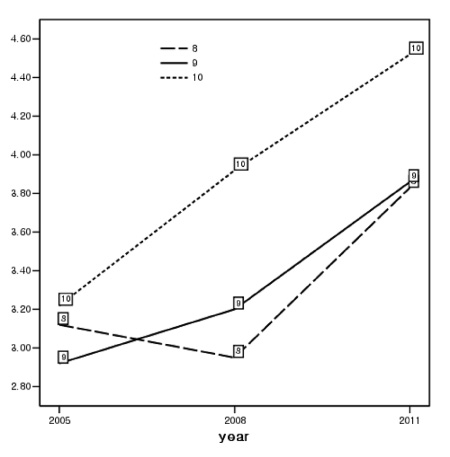
Changes of the foodservice quality attributes relating to the foodservice operation served in classroom by year.
8. Teacher's guidance in order aab F 54.8 p < 0.001
9. Gathering feedback on school meals abc F 73.9 p < 0.001
10. Providing information about school meals abc F 161.9 p < 0.001
a, b, c: values are significantly different by year (2005, 2008, 2011)
Fig. 2-3
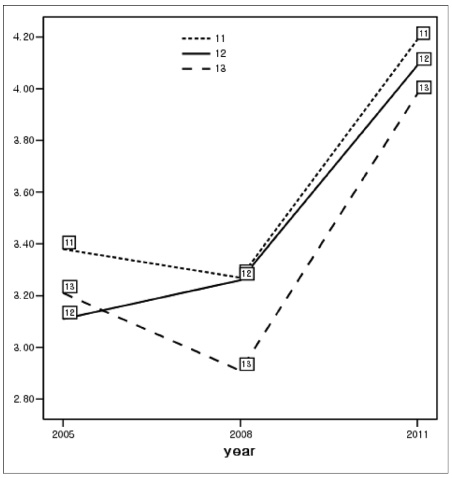
Changes of the foodservice quality attributes relating to dining environment served in classroom by year.
11. Distribution smoothly aab F 87.1 p < 0.001
12. Comfort eating places aab F 82.3 p < 0.001
13. Kindness of employee bac F 84.1 p < 0.001
a, b, c: values are significantly different by year (2005, 2008, 2011)
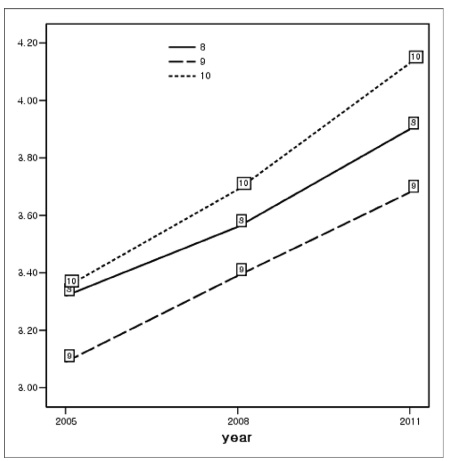
Fig. 3-1
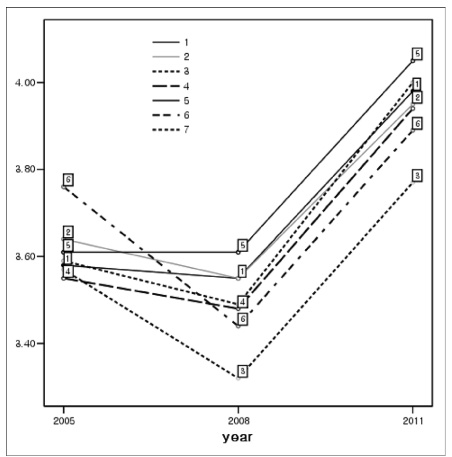
Changes of the foodservice quality attributes relating to the quality of meals served in dining hall by year.
1. Food taste aab F 95.1 p < 0.001
2. Proper temperature of food aab F 86.2 p < 0.001
3. Adequate food quantity bac F 71.1 p < 0.001
4. Diversity of the menu aab F 90.0 p < 0.001
5. Nutrition of food aab F 114.9 p < 0.001
6. Food sanitation bac F 83.9 p < 0.001
7. Quality of food ingredients aab F 126.7 p < 0.001
a, b, c: values are significantly different by year (2005, 2008, 2011)
Fig. 3-2
Changes of the foodservice quality attributes relating to the foodservice operation served in dining hall by year
8. Teacher's guidance in order abc F 73.1 p < 0.001
9. Gathering feedback on school meals abc F 68.6 p < 0.001
10. Providing information about school meals abc F 116.3 p < 0.001
a, b, c: values are significantly different by year (2005, 2008, 2011)
Fig. 3-3
Changes of the foodservice quality attributes relating to dining environment served in dining hall by year
11. distribution smoothly abc F 165.0 p < 0.001
12. Comfort eating places bac F 120.0 p < 0.001
13. Kindness of employee abc F 72.4 p < 0.001
a, b, c: values are significantly different by year
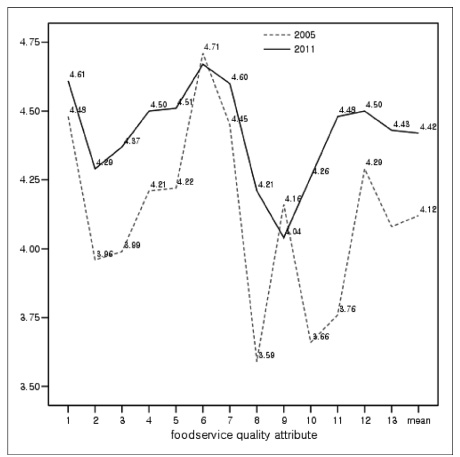
Fig. 4
Importance of 13 foodservice quality attributes by year.
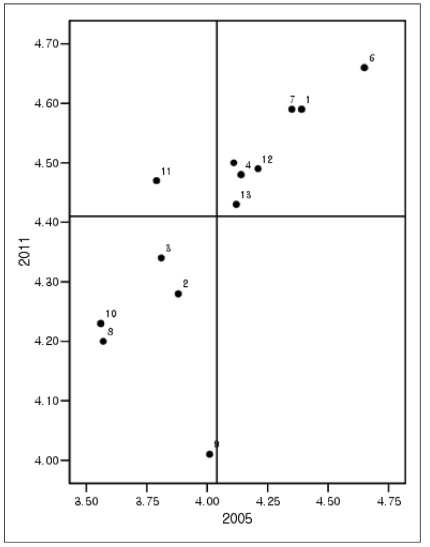
1. Food taste
2. Proper temperature of food
3. Adequate food quantity
4. Diversity of the menu
5. Nutrition of food
6. Food sanitation
7. Quality of food ingredients
8. Teacher's guidance in order
9. Gathering feedback on school meals
10. Providing information
11. Distribution smoothly
12. Comfort eating places
13. Kindness of employee
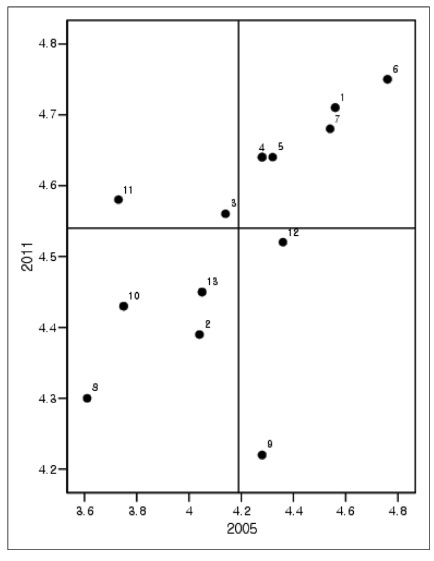
Fig. 5
Comparison of Importance of 13 foodservice quality attributes about school lunch service serving in the classroom between 2005 and 2011.
Fig. 6
Comparison of Importance of 13 foodservice quality attributes about school lunch service serving in the dining hall between 2005 and 2011.
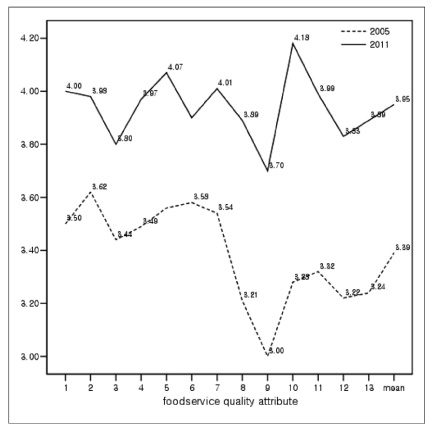
Fig. 7
Performance evaluation of 13 foodservice quality attributes by year.
1. Food taste
2. Proper temperature of food
3. Adequate food quantity
4. Diversity of the menu
5. Nutrition of food
6. Food sanitation
7. Quality of food ingredients
8. Teacher's guidance in order
9. Gathering feedback on school meals
10. Providing information
11. Distribution smoothly
12. Comfort eating places
13. Kindness of employee
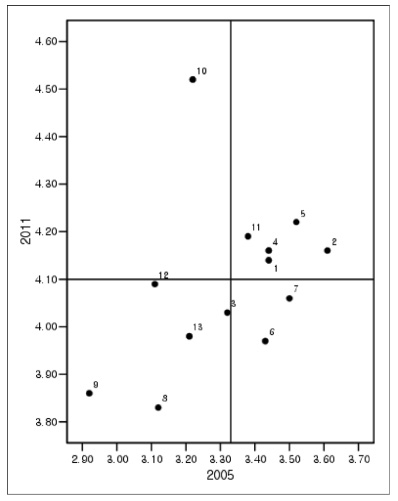
Fig. 8
Comparison of performance evaluation of 13 foodservice quality attributes about school lunch service serving in the classroom between 2005 and 2011.
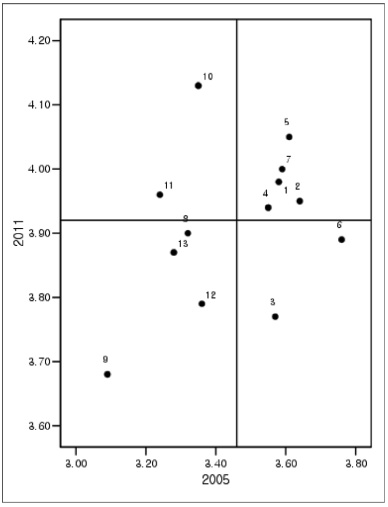
Fig. 9
Comparison of performance evaluation of 13 foodservice quality attributes about school lunch service serving in the dining hall between 2005 and 2011.
Table 1
Performance evaluation of foodservice quality attributes by year and dining area
1) Mean ± SD *: p < 0.05, **: p < 0.01, ***: p < 0.001
Table 2
Foodservice quality attributes affecting students' overall satisfaction of school lunch service served in the classroom by year
VIF: Variance Inflation Function *: p < 0.05, **: p < 0.01, ***: p < 0.001
Table 3
Foodservice quality attributes affecting students' overall satisfaction of school lunch service served in the dining hall by year
VIF: Variance Inflation Function *: p < 0.05, **: p < 0.01, ***: p < 0.001
Figure & Data
REFERENCES
Citations
Citations to this article as recorded by
Analysis of the Frequently Served Menus and Trends in Nationwide School Lunch Meals: 2021∼2023 Data from the School Meal Menu Information on the NEIS Open Educational Information Portal Seo Ha Lee, Insun Kang, Bo Kyung Kwon, Hyo Bin Im, Min A Lee Journal of the Korean Society of Food Science and Nutrition.2024; 53(10): 1084. CrossRef
Examining Boarding School Foodservice Satisfaction and Patronage of Sources of Meals Christopher Mensah, Melody Enyonam Appietu Journal of Culinary Science & Technology.2020; 18(6): 507. CrossRef
Improving Perception and Satisfaction on Middle and High School Foodservice: The Role of Student Participation Program in Serving School Meals Jeong-Eun Park, Kyung-Suk Choi Korean Journal of Community Nutrition.2018; 23(3): 243. CrossRef
A Survey of Satisfaction with Quality attributes of Meal Services for Low-income Children in Wonju Hae Sook Oh The Korean Journal of Community Living Science.2014; 25(2): 233. CrossRef
Evaluation of the Quality Attribute and Satisfaction on School Foodservice in 2010 Il-Sun Yang, Bo-Sook Yi, Moon-Kyung Park, Seung-Hee Baek, Yoo-Sun Chung, Jin-Yi Jeong, Yoon-Ji Kim, Hye-Young Kim Korean Journal of Community Nutrition.2013; 18(5): 491. CrossRef
Comparative Analysis of the Quality Attributes Affecting Students' Satisfaction on School Lunch Service of Middle School by Year
Fig. 1
Students' overall satisfaction on school lunch service by year and dining area.
Fig. 2-1
Changes of the foodservice quality attributes relating to the quality of meals served in classroom by year.
1. Food taste bac F 131.2 p < 0.001
2. Proper temperature of food bac F 93.2 p < 0.001
3. Adequate food quantity bac F 96.3 p < 0.001
4. Diversity of the menu bac F 132.9 p < 0.001
5. Nutrition of food bac F 98.1 p < 0.001
6. Food sanitation bac F 130.3 p < 0.001
7. Quality of food ingredients bac F 124.7 p < 0.001
a, b, c: values are significantly different by year (2005, 2008, 2011)
Fig. 2-2
Changes of the foodservice quality attributes relating to the foodservice operation served in classroom by year.
8. Teacher's guidance in order aab F 54.8 p < 0.001
9. Gathering feedback on school meals abc F 73.9 p < 0.001
10. Providing information about school meals abc F 161.9 p < 0.001
a, b, c: values are significantly different by year (2005, 2008, 2011)
Fig. 2-3
Changes of the foodservice quality attributes relating to dining environment served in classroom by year.
11. Distribution smoothly aab F 87.1 p < 0.001
12. Comfort eating places aab F 82.3 p < 0.001
13. Kindness of employee bac F 84.1 p < 0.001
a, b, c: values are significantly different by year (2005, 2008, 2011)
Fig. 3-1
Changes of the foodservice quality attributes relating to the quality of meals served in dining hall by year.
1. Food taste aab F 95.1 p < 0.001
2. Proper temperature of food aab F 86.2 p < 0.001
3. Adequate food quantity bac F 71.1 p < 0.001
4. Diversity of the menu aab F 90.0 p < 0.001
5. Nutrition of food aab F 114.9 p < 0.001
6. Food sanitation bac F 83.9 p < 0.001
7. Quality of food ingredients aab F 126.7 p < 0.001
a, b, c: values are significantly different by year (2005, 2008, 2011)
Fig. 3-2
Changes of the foodservice quality attributes relating to the foodservice operation served in dining hall by year
8. Teacher's guidance in order abc F 73.1 p < 0.001
9. Gathering feedback on school meals abc F 68.6 p < 0.001
10. Providing information about school meals abc F 116.3 p < 0.001
a, b, c: values are significantly different by year (2005, 2008, 2011)
Fig. 3-3
Changes of the foodservice quality attributes relating to dining environment served in dining hall by year
11. distribution smoothly abc F 165.0 p < 0.001
12. Comfort eating places bac F 120.0 p < 0.001
13. Kindness of employee abc F 72.4 p < 0.001
a, b, c: values are significantly different by year
Fig. 4
Importance of 13 foodservice quality attributes by year.
1. Food taste
2. Proper temperature of food
3. Adequate food quantity
4. Diversity of the menu
5. Nutrition of food
6. Food sanitation
7. Quality of food ingredients
8. Teacher's guidance in order
9. Gathering feedback on school meals
10. Providing information
11. Distribution smoothly
12. Comfort eating places
13. Kindness of employee
Fig. 5
Comparison of Importance of 13 foodservice quality attributes about school lunch service serving in the classroom between 2005 and 2011.
Fig. 6
Comparison of Importance of 13 foodservice quality attributes about school lunch service serving in the dining hall between 2005 and 2011.
Fig. 7
Performance evaluation of 13 foodservice quality attributes by year.
1. Food taste
2. Proper temperature of food
3. Adequate food quantity
4. Diversity of the menu
5. Nutrition of food
6. Food sanitation
7. Quality of food ingredients
8. Teacher's guidance in order
9. Gathering feedback on school meals
10. Providing information
11. Distribution smoothly
12. Comfort eating places
13. Kindness of employee
Fig. 8
Comparison of performance evaluation of 13 foodservice quality attributes about school lunch service serving in the classroom between 2005 and 2011.
Fig. 9
Comparison of performance evaluation of 13 foodservice quality attributes about school lunch service serving in the dining hall between 2005 and 2011.
Fig. 1
Fig. 2-1
Fig. 2-2
Fig. 2-3
Fig. 3-1
Fig. 3-2
Fig. 3-3
Fig. 4
Fig. 5
Fig. 6
Fig. 7
Fig. 8
Fig. 9
Comparative Analysis of the Quality Attributes Affecting Students' Satisfaction on School Lunch Service of Middle School by Year
Performance evaluation of foodservice quality attributes by year and dining area
1) Mean ± SD *: p < 0.05, **: p < 0.01, ***: p < 0.001
Foodservice quality attributes affecting students' overall satisfaction of school lunch service served in the classroom by year
VIF: Variance Inflation Function *: p < 0.05, **: p < 0.01, ***: p < 0.001
Foodservice quality attributes affecting students' overall satisfaction of school lunch service served in the dining hall by year
VIF: Variance Inflation Function *: p < 0.05, **: p < 0.01, ***: p < 0.001
Table 1
Performance evaluation of foodservice quality attributes by year and dining area
1) Mean ± SD *: p < 0.05, **: p < 0.01, ***: p < 0.001
Table 2
Foodservice quality attributes affecting students' overall satisfaction of school lunch service served in the classroom by year
VIF: Variance Inflation Function *: p < 0.05, **: p < 0.01, ***: p < 0.001
Table 3
Foodservice quality attributes affecting students' overall satisfaction of school lunch service served in the dining hall by year
VIF: Variance Inflation Function *: p < 0.05, **: p < 0.01, ***: p < 0.001