Articles
- Page Path
- HOME > Korean J Community Nutr > Volume 24(3); 2019 > Article
-
Research Article
- Analysis of Dietary Behaviors, Food Consumption Frequency and Blood Clinical Indices by Residence Types of Female College Students in Seoul
-
Ru Zi Lee
 , Jung Hee Kim
-
Korean Journal of Community Nutrition 2019;24(3):183-196.
DOI: https://doi.org/10.5720/kjcn.2019.24.3.183
Published online: June 30, 2019
1Graduate School of Seoul Women's University, Seoul, Korea, Student.
2Department of Food and Nutrition, Seoul Women's University, Seoul, Korea, Professor.
- Corresponding author: Jung Hee Kim. Department of Food and Nutrition, College of Natural Sciences, Seoul Women's University, 621 Hwarangno, Nowon-gu, Seoul 01797, Korea. Tel: (02) 970-5646, Fax: (02) 976-4049, jheekim@swu.ac.kr
Copyright © 2019 The Korean Society of Community Nutrition
This is an Open-Access article distributed under the terms of the Creative Commons Attribution Non-Commercial License (http://creativecommons.org/licenses/by-nc/3.0/) which permits unrestricted non-commercial use, distribution, and reproduction in any medium, provided the original work is properly cited.
- 1,253 Views
- 1 Download
- 6 Crossref
Figure & Data
REFERENCES
Citations

- Differences in Nutritional Status According to the Residence Types among University Students in Gwangju
Geum-Bi Ryu, Young-Ran Heo
Journal of the Korean Society of Food Science and Nutrition.2024; 53(2): 207. CrossRef - Usage and Quality Satisfaction of Convenience Food at Convenience Stores according to the Eating Behavior of University Students in Southern Gyeonggi Province
Se-In Oh, Ok-Sun Kim
Journal of the East Asian Society of Dietary Life.2023; 33(6): 492. CrossRef - Beliefs, self-efficacy, subjective norms, and eating behaviors according to the breakfast frequency among female university students in South Korea
Hye Jin Kim, Kyung Won Kim
Nutrition Research and Practice.2023; 17(6): 1170. CrossRef - A Franchise Hamburger Menu for University Students Determined by Identifying Selection Attributes Using Conjoint Analysis
Yu-Ni Choi, Sung-Suk Chung, Jeong-Ok Rho
Journal of the East Asian Society of Dietary Life.2022; 32(4): 250. CrossRef - Analysis of Usage, Preference, and Satisfaction for Convenience
Store Dessert among University Students in Chungbuk Area
Go Eun Lee, Hye-In Yang, Yun-Jung Bae
Journal of Biotechnology and Bioindustry.2021; 9: 63. CrossRef - Comparison of consumption behaviors and development needs for the home meal replacement among Chinese college students studying abroad in Korea, Chinese college students in China, and Korean college students in Korea
Mi Ae Bae, So Hyun Park, Siyao Cheng, Kyung Ja Chang
Nutrition Research and Practice.2021; 15(6): 747. CrossRef
General characteristics and anthropometric indices of subjects
*, ***: p<0.05 and p<0.001 by Fisher's exact test since cells have expected frequency less than 5
1) Mean ± SD
2) Body Mass Index
3) Blood Pressure
4) Number of subjects, ( ): % of subjects
NS: Not significantly different among groups by one-way ANOVA and Duncan's multiple range test
Dietary behaviors of subjects
**, ***: p<0.01 and p<0.001 by Fisher's exact test since cells have expected frequency less than 5
1) Number of subjects, ( ): % of subjects
Food consumption frequency of subjects
*, **, ***: p<0.05, p<0.01 and p<0.001 by Fisher's exact test since cells have expected frequency less than 5
1) Number of subjects, ( ): % of subjects
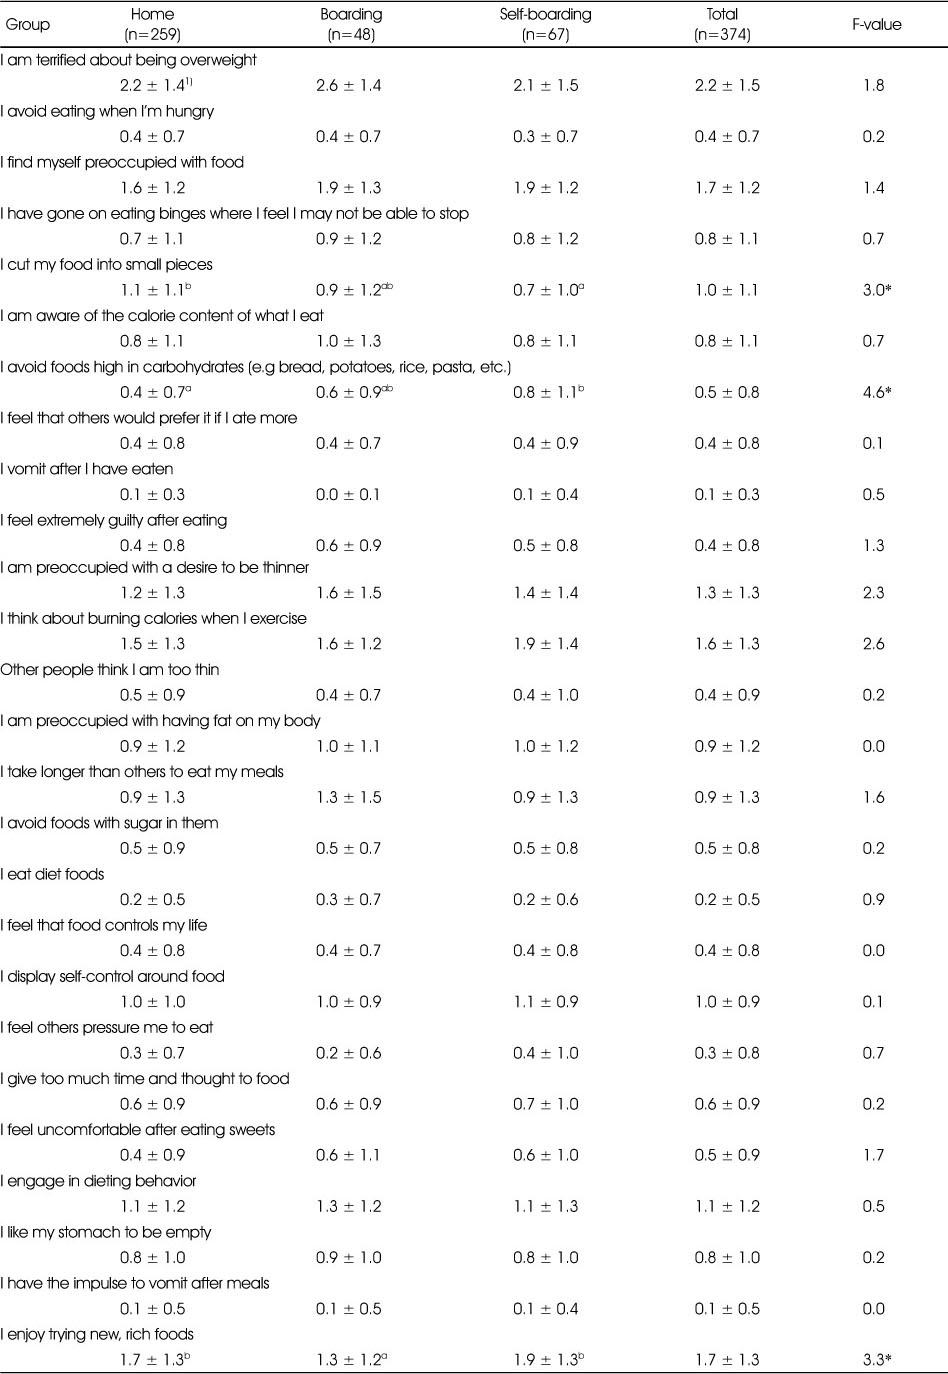
Eating Attitudes Test (EAT-26) of subjects
Values are scaled as follows: always; 4 point, usually; 3 point, often; 2 point, sometimes; 1 point, rarely; 0 point, never; 0 point
1) Mean ± SD
a, b: Means with different superscript letters are significantly different at p<0.05 among 3 groups by ANOVA and Duncan's multiple range test
Blood clinical indices of subjects
Hb: hemoglobin; Hct: hematocrit
1) Mean ± SD
2) % of subjects who are below or above the cut-off points (Hb<12 g/dL, Hct<36%, Triglyceride≥150 mg/dL, Total cholesterol≥200 mg/dL, HDL-cholesterol <50 mg/dL, glucose≥100 mg/dL)
NS: Not significantly different among groups by one-way ANOVA and Duncan's multiple range test
*, ***: p<0.05 and p<0.001 by Fisher's exact test since cells have expected frequency less than 5 1) Mean ± SD 2) Body Mass Index 3) Blood Pressure 4) Number of subjects, ( ): % of subjects NS: Not significantly different among groups by one-way ANOVA and Duncan's multiple range test
**, ***: p<0.01 and p<0.001 by Fisher's exact test since cells have expected frequency less than 5 1) Number of subjects, ( ): % of subjects
*, **, ***: p<0.05, p<0.01 and p<0.001 by Fisher's exact test since cells have expected frequency less than 5 1) Number of subjects, ( ): % of subjects
Values are scaled as follows: always; 4 point, usually; 3 point, often; 2 point, sometimes; 1 point, rarely; 0 point, never; 0 point 1) Mean ± SD a, b: Means with different superscript letters are significantly different at p<0.05 among 3 groups by ANOVA and Duncan's multiple range test
Hb: hemoglobin; Hct: hematocrit 1) Mean ± SD 2) % of subjects who are below or above the cut-off points (Hb<12 g/dL, Hct<36%, Triglyceride≥150 mg/dL, Total cholesterol≥200 mg/dL, HDL-cholesterol <50 mg/dL, glucose≥100 mg/dL) NS: Not significantly different among groups by one-way ANOVA and Duncan's multiple range test

 KSCN
KSCN


 PubReader
 Cite
Cite


