
Articles
- Page Path
- HOME > Korean J Community Nutr > Volume 23(3); 2018 > Article
-
Research Article
- Improving Perception and Satisfaction on Middle and High School Foodservice: The Role of Student Participation Program in Serving School Meals
-
Jeong-Eun Park, Kyung-Suk Choi

-
Korean Journal of Community Nutrition 2018;23(3):243-256.
DOI: https://doi.org/10.5720/kjcn.2018.23.3.243
Published online: June 30, 2018
Graduate School of Education, Daejin University, Pocheon, Korea.
1Department of Food Science and Nutrition, Daejin University, Pocheon, Korea.
- Corresponding author: Kyung-Suk Choi. Department of Food Science and Nutrition, Daejin University, 1007 Hokuk-ro, Pocheon 11159, Korea. Tel: (031) 539-1864, Fax: (031) 539-1860, kchoi@daejin.ac.kr
• Received: June 17, 2018 • Revised: June 24, 2018 • Accepted: June 24, 2018
Copyright © 2018 The Korean Society of Community Nutrition
This is an Open-Access article distributed under the terms of the Creative Commons Attribution Non-Commercial License (http://creativecommons.org/licenses/by-nc/3.0/) which permits unrestricted non-commercial use, distribution, and reproduction in any medium, provided the original work is properly cited.
- 2,083 Views
- 7 Download
- 4 Crossref
Abstract
-
Objectives
- We evaluated the extent to which implementation of student participation programs in serving school meals impacts student perception and satisfaction with school foodservice in middle and high school settings.
-
Methods
- Students' perception of management and satisfaction with quality attributes of school foodservice were assessed by questionnaire methods and compared by the program implementation status of student participation in serving school meals. Correlation and multiple regression analyses were performed to identify factors affecting perception and satisfaction.
-
Results
- The overall mean score for perception regarding the management of school foodservice was low (3.53 out of 10 points) and middle school students showed a higher mean score than high school students (4.10 vs. 2.94 points). In both middle and high schools, student perception was significantly higher in schools implementing the program. The average score for student satisfaction with the quality of school foodservice was 3.50 out of 5 points. Similarly, we observed a significantly higher satisfaction among middle versus high school students (3.93 vs. 3.04 points) and in schools implementing the program versus those that were not. Overall, student participation in serving school meals resulted in increases in satisfaction with school foodservice of 0.269 and 0.466 points among middle and high school students, respectively.
-
Conclusions
- Implementation of student participation in serving school meals could be used as a strategy to improve perception and satisfaction of students with their school foodservice. Establishment of guidelines of student serving participation programs encompassing different perspectives from students, dietitians and school faculties are warranted.
- 1. Lee MY, Choi KS. Current status and activation needs for student nutrition counseling among elementary and middle·high school dietitians. Korean J Community Living Sci 2013; 24(4): 497-515.Article
- 2. Yi BS. Comparative analysis of the quality attributes affecting students' satisfaction on school lunch service of middle school by year. Korean J Community Nutr 2012; 17(4): 479-493.Article
- 3. Parasuraman A, Zeithaml VA, Berry LL. SERVQUAL: A multiple-item scale for measuring consumer perceptions of service quality. J Retailing 1988; 64(1): 12-40.
- 4. Yang IS, Yi BS, Park MK, Baek SH, Chung YS, Jeong JY, et al. Evaluation of the quality attribute and satisfaction on school foodservice in 2010. Korean J Community Nutr 2013; 18(5): 491-504.Article
- 5. Ministry of Education & Human Resources. Comprehensive improvement measures of school lunch programs (2007–2011) [internet]. Ministry of Education & Human Resources; 2006; cited 2018 May 1]. Available from: http://library.moe.go.kr/viewer/MediaViewer.
- 6. Lee KE. Adolescents' nutrient intake determined by plate waste at school food services. Korean J Community Nutr 2005; 10(4): 484-492.
- 7. Ministry of Education & Human Resources. Satisfaction of school lunch programs [internet]. Ministry of Education & Human Resources; 2011; cited 2018 May 1]. Available from: http://library.moe.go.kr/viewer/MediaViewer.
- 8. Kim KA, Kim SJ, Jung LH, Jeon ER. Degree of satisfaction on the school foodservice among the middle school students in Gwang-ju and Chonnam area. Korean J Soc Food Cookery Sci 2002; 18(6): 579-585.
- 9. Yang IS, Park MK. Identifying the quality attributes affecting customer satisfaction of school foodservice by city and province: student, parents, and faculty. J Korean Diet Assoc 2008; 14(3): 302-318.
- 10. Park MK, Yang IS, Yi BS, Kim YS. Analysis of the quality attributes and the customers' satisfaction in school foodservice by school type and distribution place. J Korean Diet Assoc 2010; 16(2): 83-99.
- 11. Lee KA, Lyu ES. Comparison of student satisfaction with foodservice of middle school by place for meal service in Busan area. J Korean Soc Food Sci Nutr 2005; 34(2): 209-218.Article
- 12. Yoo YJ, Hong WS, Choi YS. The assessment of high school students' foodservice satisfaction. Korean J Soc Food Cookery Sci 2000; 16(2): 112-120.
- 13. Han KS, Hong SH. The menu preference of middle school student in contracted management middle school foodservice. Korean J Diet Cult 2002; 17(1): 1-15.
- 14. Lee KY, Bae YJ, Choi MK, Kim MH. Satisfaction on school meal service and food preference of elementary school students in Chungnam. Korean J Food Nutr 2017; 30(1): 129-138.Article
- 15. Kim JH, Kim HS. A survey on the satisfaction of middle school students with school meals and their food preferences. J Korea Contents Assoc 2016; 16(5): 488-496.Article
- 16. Park SH, Choe YC. Students' satisfaction of school lunch according to the dietary habit and educational experience of nutrition and food. Fam Environ Res 2015; 53(4): 425-432.Article
- 17. Lee EJ. A study on the degree of satisfaction with school dinner by school meal service in Daegu. Korean J Culinary Res 2012; 18(4): 277-291.Article
- 18. Shin KH, Lee YM, Cho WK. Survey on foodservice satisfaction and dietary education needs for improvement of school foodservice in middle school students in Seoul. Korean J Community Nutr 2017; 22(2): 127-135.ArticleLink
- 19. Yoon J, Choo YJ, Chung SJ, Ryu SH. Satisfaction of elementary students eating school lunch; Association with level of involvement in school lunch service. Korean J Community Nutr 2005; 10(5): 668-676.
- 20. Ministry of Education & Human Resources. 2014 Workshop of school lunch programs [internet]. Ministry of Education & Human Resources; 2014; cited 2018 May 31]. Available from: http://library.moe.go.kr/viewer/MediaViewer.
- 21. Kim YR, Kim EJ, Choi MK. Perception and satisfaction of free foodservice in male middle school students in Chungnam. J Korean Diet Assoc 2014; 20(2): 87-98.Article
- 22. Jang ER, Choi HS, Lyu ES. Evaluation of perception and foodservice satisfaction of free school meals by elementary school students in Busan. J Korean Soc Food Sci Nutr 2016; 45(12): 1830-1837.Article
- 23. Kim HS, Yoon JH. Development of multiple-item scale for measuring customer satisfaction of university foodservice. J Tourism Sci 2012; 36(8): 297-315.
- 24. Kim HD, Son ES, Kang SM. A study on the customer's satisfaction of institutional food service: Focused on the Busan and Gyeongnam area. J Tourism Sci 2012; 37: 127-147.
- 25. Kim KJ, Yi BS, Park MK. Analysis of the recognition and quality attributes on school lunch services of middle school students by gender in Gyeonggi province. J Korean Soc Sch Health 2010; 23(2): 295-307.
- 26. Kim SH, Lee KA, Yu CH, Song YS, Kim WK, Yoon HR, et al. Comparisons of student satisfaction with the school food service programs in middle and high schools by food service management types. Korean J Nutr 2003; 36(2): 211-222.
- 27. Korea Centers for Disease Control and Prevention. 2007 Growth standard for children and adolescents [internet]. Ministry of Health & Welfare; 2007; cited 2018 May 1]. Available from: http://www.cdc.go.kr/CDC/info/CdcKrInfo0201.jsp?menuIds=HOME001-MNU115.
- 28. Lee KH, Park ES. School food service satisfaction and menu preferences of high school students: Focused on Iksan, Cheonbuk. Korean J Community Nutr 2010; 15(1): 108-123.
- 29. Park KJ, Jang MR. Survey on satisfaction of fifth and sixth grade students from elementary school food service in Won-ju. J Korean Diet Assoc 2008; 14(1): 13-22.
- 30. Choo YJ, Lee JH, Yoon JH, Ryu SH. Relationship between levels of dietitians' management activities and job satisfaction in elementary school foodservice operations. Korean J Community Nutr 2005; 10(4): 546-554.
REFERENCES
Table 1
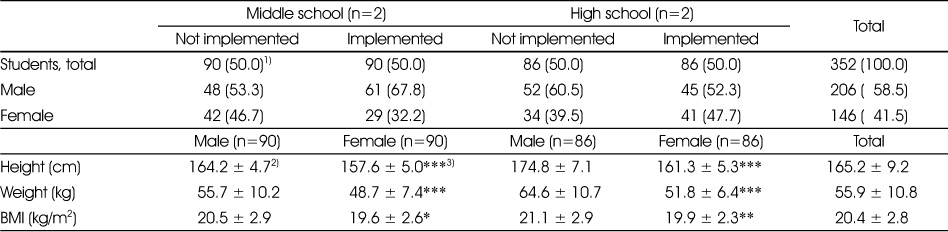
Number and anthropometric status of student respondents from middle and high schools according to the implementation status of student participation program in serving school meals
Table 2
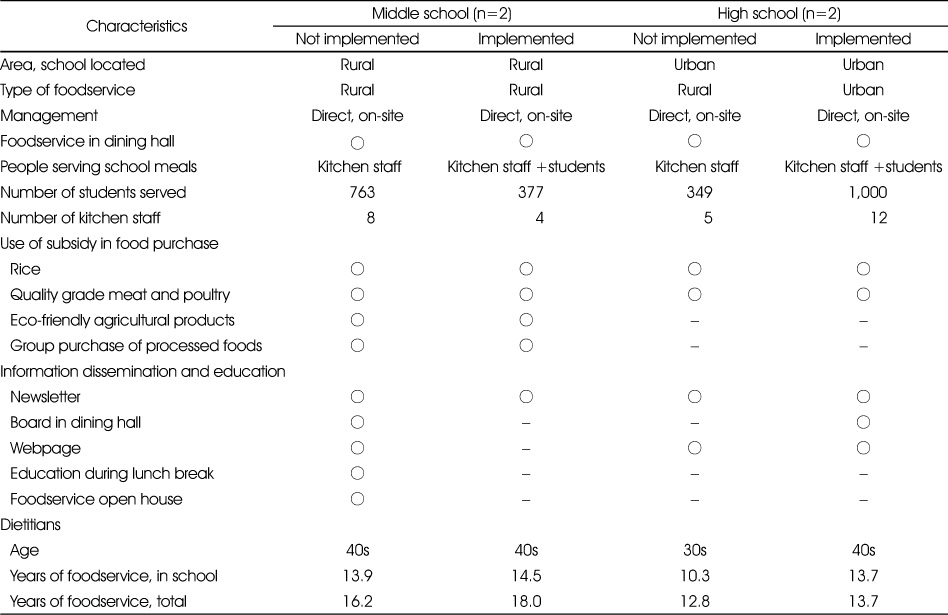
Characteristics of school foodservice operations and affiliated dietitians according to the implementation status of student participation program in serving school meals
Table 3

Perception of students on management of school foodservice according to the implementation status of student participation program in serving school meals
Abbreviation: HACCP, Hazard Analysis Critical Control Point
1) n (%); score +1 was assigned for ‘know’ and 0 for ‘don't know’
2) Mean ± SD, out of maximum score of 10
3) Chi-squared test by program implementation status, ***: p<0.001, **: p<0.01, *: p<0.05
4) Chi-squared test between middle and high school students, ***: p<0.001, **: p<0.01, *: p<0.05
5) t-test by program implementation status, ***: p<0.001
6) t-test between middle and high school students, ***: p<0.001
Table 4
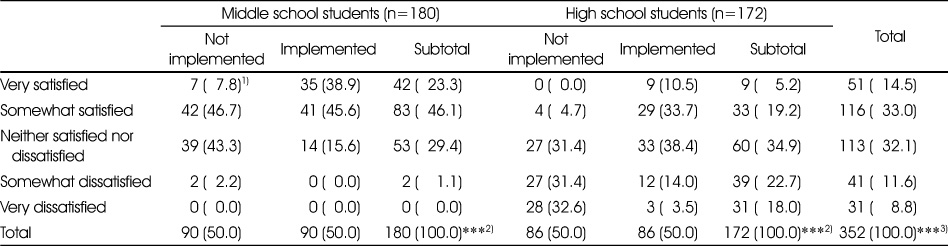
Satisfaction of students on the overall quality of school foodservice according to the implementation status of student participation program in serving school meals
Table 5
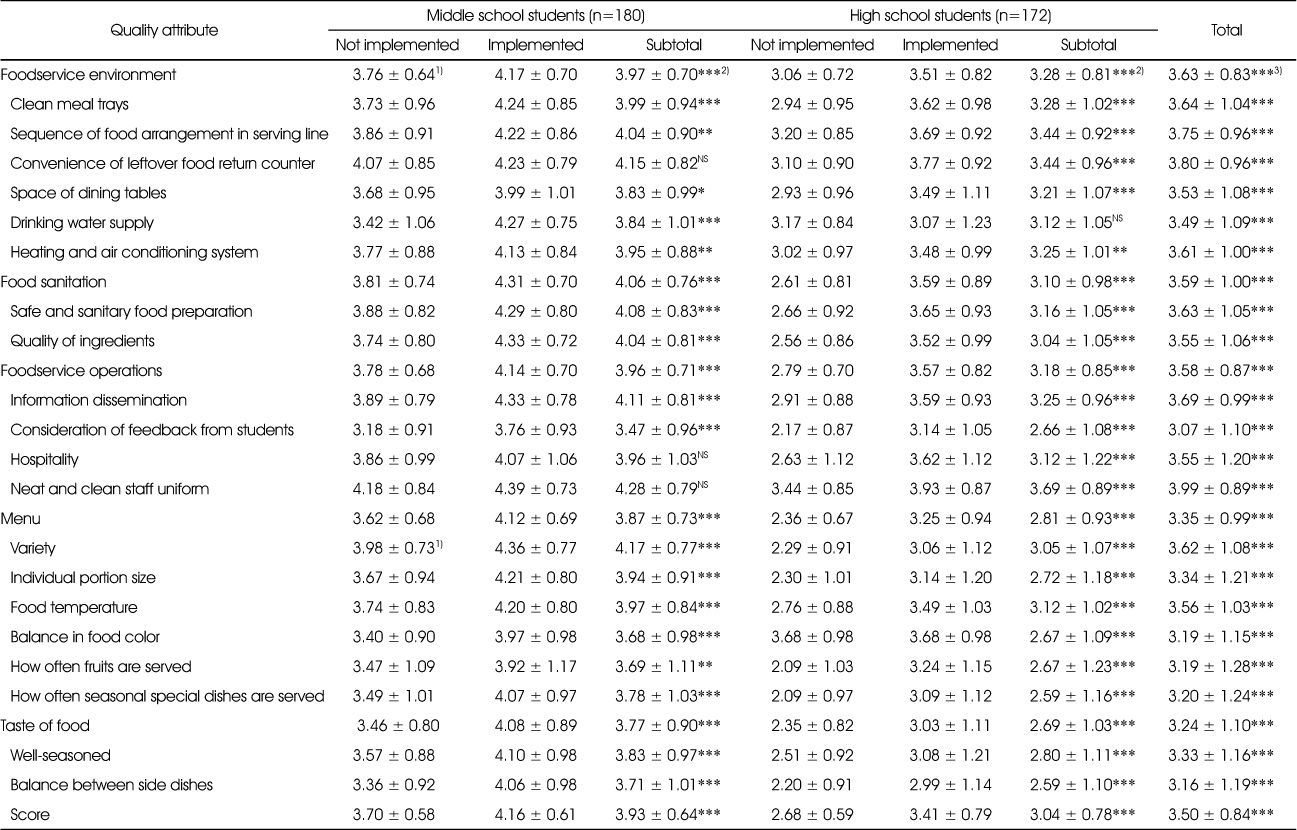
Satisfaction of students on the specific quality attributes of school foodservice according to the implementation status of student participation program in serving school meals
1) Mean ± SD; score +5 was assigned for ‘very satisfied’, +4 for ‘somewhat satisfied’, +3 for ‘neither satisfied nor dissatisfied’, +2 for ‘somewhat dissatisfied’ and +1 for ‘very dissatisfied’
2) t-test by program implementation status, ***: p<0.001, **: p<0.01, *: p<0.05, NS: Not significant
3) t-test between middle and high school students, ***: p<0.001
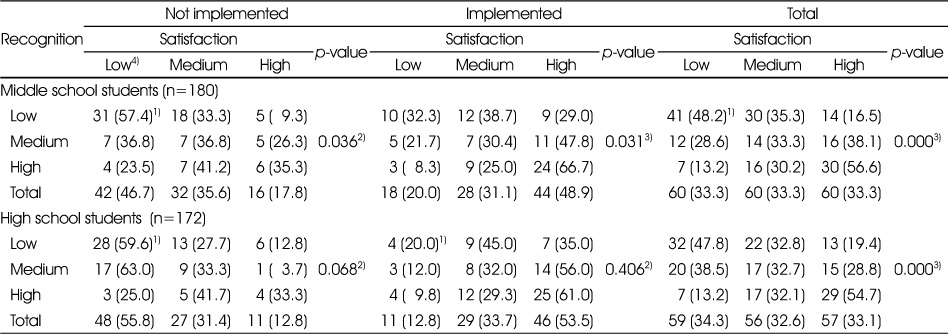
Table 6
Comparison of perception and satisfaction of students on school foodservice according to the implementation status of student participation program in serving school meals


Figure & Data
REFERENCES
Citations
Citations to this article as recorded by 
- Survey on consumer perceptions, health benefits and preferences of kindergarten and school foodservices in Korea, including related keywords reported in newspaper: a mixed-methods study
Gyoungok Gang, Chaewon Park, Hyeja Chang
Korean Journal of Community Nutrition.2025; 30(4): 309. CrossRef - Developing educational videos to inform rightly about school foodservice from kindergarten to high school: a case study
Gyoungok Gang, Chaewon Park, Haejin Kang, Wan Soo Hong, Yoo Kyoung Park, Sook Hee Choi, Seung Hye Kim, Jieun Choi, Jihyun Park, Hyeja Chang
Korean Journal of Community Nutrition.2024; 29(2): 97. CrossRef - Causal relationship among quality factors, emotional responses, and satisfaction of school food service in Henan province, China
Miaomiao Li, Young Eun Lee
Nutrition Research and Practice.2023; 17(2): 356. CrossRef - Feasibility Study on Application of Revised Nutritional Standards for School Lunches: Consumer Satisfaction Survey
Meeyoung Kim, Youngmin Nam
Journal of the East Asian Society of Dietary Life.2019; 29(5): 367. CrossRef
 Cite
CiteImproving Perception and Satisfaction on Middle and High School Foodservice: The Role of Student Participation Program in Serving School Meals
Improving Perception and Satisfaction on Middle and High School Foodservice: The Role of Student Participation Program in Serving School Meals
Number and anthropometric status of student respondents from middle and high schools according to the implementation status of student participation program in serving school meals
Abbreviation: BMI, body mass index
1) n (%)
2) Mean ± SD
3) Significantly different by sex ***: p<0.001, **: p<0.01 *: p<0.05
Characteristics of school foodservice operations and affiliated dietitians according to the implementation status of student participation program in serving school meals
Perception of students on management of school foodservice according to the implementation status of student participation program in serving school meals
Abbreviation: HACCP, Hazard Analysis Critical Control Point
1) n (%); score +1 was assigned for ‘know’ and 0 for ‘don't know’
2) Mean ± SD, out of maximum score of 10
3) Chi-squared test by program implementation status, ***: p<0.001, **: p<0.01, *: p<0.05
4) Chi-squared test between middle and high school students, ***: p<0.001, **: p<0.01, *: p<0.05
5) t-test by program implementation status, ***: p<0.001
6) t-test between middle and high school students, ***: p<0.001
Satisfaction of students on the overall quality of school foodservice according to the implementation status of student participation program in serving school meals
1) n (%)
2) Chi-squared test by program implementation status, ***: p<0.001
3) Chi-squared test between middle and high school students, ***: p<0.001
Satisfaction of students on the specific quality attributes of school foodservice according to the implementation status of student participation program in serving school meals
1) Mean ± SD; score +5 was assigned for ‘very satisfied’, +4 for ‘somewhat satisfied’, +3 for ‘neither satisfied nor dissatisfied’, +2 for ‘somewhat dissatisfied’ and +1 for ‘very dissatisfied’
2) t-test by program implementation status, ***: p<0.001, **: p<0.01, *: p<0.05, NS: Not significant
3) t-test between middle and high school students, ***: p<0.001
Comparison of perception and satisfaction of students on school foodservice according to the implementation status of student participation program in serving school meals
1) n (%)
2) p-value from Fisher's exact test
3) p-value from chi-squared test, ***: p<0.001
4) Low: 1st tertile, medium: 2nd tertile, high: 3rd tertile
Correlation coefficients of perception and satisfaction of students on school foodservice according to the implementation status of student participation program in serving school meals
1) Pearson's correlation coefficient
2) ***: p<0.001, **: p<0.01, *: p<0.05 NS: Not significant
Regression analyses results with 5 dependent quality attribute variables on school foodservice overall satisfaction
Table 1
Number and anthropometric status of student respondents from middle and high schools according to the implementation status of student participation program in serving school meals
Abbreviation: BMI, body mass index 1) n (%) 2) Mean ± SD 3) Significantly different by sex ***: p<0.001, **: p<0.01 *: p<0.05
Table 2
Characteristics of school foodservice operations and affiliated dietitians according to the implementation status of student participation program in serving school meals
Table 3
Perception of students on management of school foodservice according to the implementation status of student participation program in serving school meals
Abbreviation: HACCP, Hazard Analysis Critical Control Point 1) n (%); score +1 was assigned for ‘know’ and 0 for ‘don't know’ 2) Mean ± SD, out of maximum score of 10 3) Chi-squared test by program implementation status, ***: 4) Chi-squared test between middle and high school students, ***: 5) 6)
Table 4
Satisfaction of students on the overall quality of school foodservice according to the implementation status of student participation program in serving school meals
1) n (%) 2) Chi-squared test by program implementation status, ***: 3) Chi-squared test between middle and high school students, ***:
Table 5
Satisfaction of students on the specific quality attributes of school foodservice according to the implementation status of student participation program in serving school meals
1) Mean ± SD; score +5 was assigned for ‘very satisfied’, +4 for ‘somewhat satisfied’, +3 for ‘neither satisfied nor dissatisfied’, +2 for ‘somewhat dissatisfied’ and +1 for ‘very dissatisfied’ 2) 3)
Table 6
Comparison of perception and satisfaction of students on school foodservice according to the implementation status of student participation program in serving school meals
1) n (%) 2) 3) 4) Low: 1st tertile, medium: 2nd tertile, high: 3rd tertile
Table 7
Correlation coefficients of perception and satisfaction of students on school foodservice according to the implementation status of student participation program in serving school meals
1) Pearson's correlation coefficient 2) ***:
Table 8
Regression analyses results with 5 dependent quality attribute variables on school foodservice overall satisfaction


